

Vertigo3d/E+ via Getty Images
If we pull up a long-term technical chart of Taro Pharmaceutical Industries Ltd. (NYSE:TARO), we can see that shares remain above the stock’s multi-year trend line which dates back all the way to 1998. This essentially means that shares remain in a long-term bull market despite the fact that shares have been making lower lows consistently for some time now. However, given the fact that we see no significant bullish divergences at present in either the RSI momentum indicator or indeed the MACD, the likelihood is that shares will test long-term support depicted below which may mean the $30 level approx may come into view here before a final long-term bottom is printed.
Although long-term charts are not useful for trading purposes, what they do provide is insights into the underlying trend of the stock which simply cannot be ascertained from more short-term timeframes. Although short-term charts can be very much emotionally driven, multi-decade charts address far more information where rationality and psychology (Human states which generally do not change) are much more to the fore.
Suffice it to say, our job is to decipher whether indeed Taro Pharmaceutical would be a strong buy at the $30 level. We can gain insights into this answer by monitoring the company’s trends regarding its earnings and linking this to the company’s valuation in general. Remember, Taro has no debt on its balance sheet which means interest expenses can not erode the company’s net profit to any significant degree. Furthermore, the fact the shares are presently trading under book value permits us to focus on the company’s earnings expectations and particularly what is expected in this present fiscal year (ends March 2023)
Long-Term Chart Of Taro Pharmaceutical (Stockcharts.com)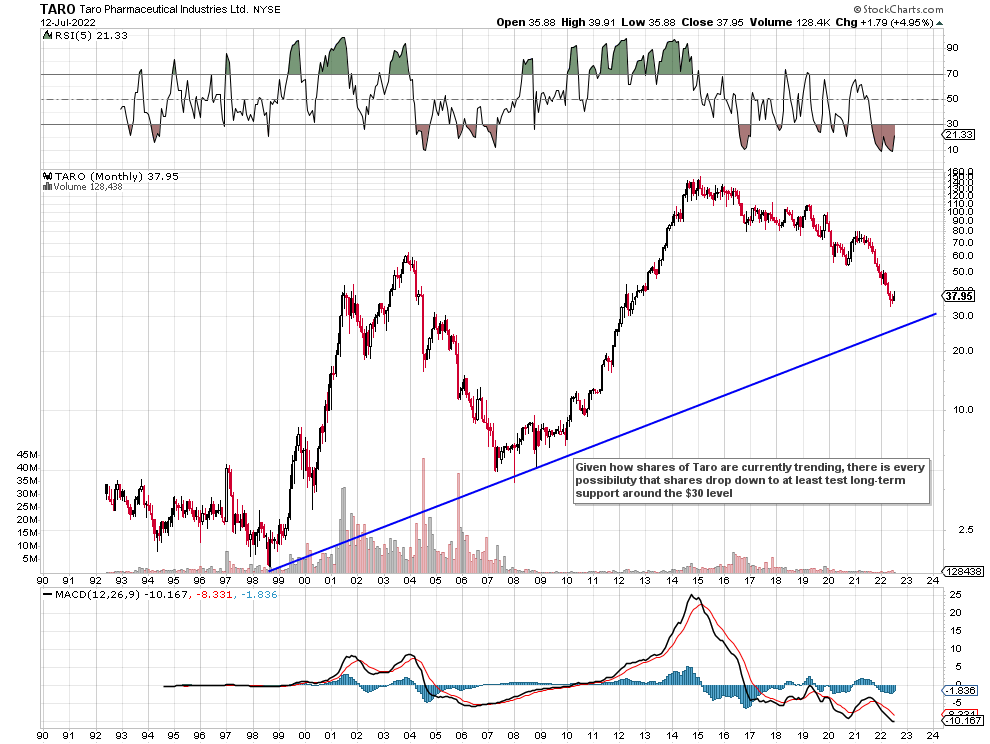
Being chartists, we believe Taro’s share price action on the technical chart is a full reflection of the stock’s known fundamentals such as but not limited to the recent DOJ investigations and subsequent cash payments, the recent Alchemee purchase, and the current competitive pressures which exist in this industry. In spite of these headwinds, the company reported a net profit of $58.3 million for its most recent fiscal year (which ended March 2022). However, it is the forward earnings multiple of 9.75 which has really caught our attention for the following reason.
Cheap Earnings
Earnings growth is the main driver of stock prices, period. Given that the above earnings multiple corresponds to projected earnings of $3.86 per share, Taro´s forward earnings yield comes in at (Projected Earnings/Stock Price – 3.86/37.62) 10.26%. This 10.26% projected yield equates to the investor´s rate of return if indeed management decided to pay out all of its earnings to shareholders.
Taking into account however our $30 entry point, our projected annual yield would now increase to 12.87%. Now, given how Taro’s U.S. market, in particular, may potentially not live up to expectations due to significant competitive pressures, that 12%+ forward earnings yield has to be taken with a grain of salt.
We get this but even if we are wrong, there is still plenty of buffer between that projection and the prevailing inflation rate. Remember, with high single-digit inflation rates continuing to be the norm at present, investors will undoubtedly begin to price this new narrative into their positions. Suffice it to say, it is all about real returns going forward so double-digit nominal returns from certain equities are bound to come under extra scrutiny going forward from investors.
Cash Flow
When we look at the most recent year-end cash flow statement, we see that net cash of almost $159 million was actually used in the fiscal year. However, when we take out monies associated with loss contingencies and the settlement, we see that the adjusted operating cash flow number comes to a positive $165 million number. Although a forward cash-flow multiple can not be predicted at present due to the uncertainty regarding ongoing civil antitrust issues, the adjusted trailing operating cash-flow multiple for example comes in at 8.61.
Furthermore, Taro has a proven track record with respect to its consistent generation of cash flow over many years. This is another reason why we believe investors will step in here if indeed the $30 level approx is encountered soon enough.
Conclusion
Taro’s share price performance for many years now has not been pretty, to say the least. Furthermore, we believe there most likely will be further declines before we print a hard bottom here. In saying this, if indeed long-term support gets tested, the potential reward at the point would be significantly larger than the downside risk in Taro in our opinion. We will be watching this one carefully going forward. We look forward to continued coverage.
Be the first to comment