

JHVEPhoto
Target Corporation (NYSE:TGT) is about a week fresh off their Q3FY22 earnings release. Over the past five days, the stock is up nearly 4% but is little changed over the past month. Comparable peer, Walmart (WMT), on the other hand is up 11% on the month. Likewise, the broader S&P 500 index is also up over the same comparable period, though to a lesser scale of about 4%.
Weighing on overall monthly performance was a 14% decline on the day of their release, which was then followed by a series of downgrades from various firms on Wall Street. Presently, Seeking Alpha’s (“SA”) Quant system grades the stock with a hold rating, with favorable marks on profitability that are more than offset by weak grades in other categories, such as valuation and growth.
This is a notable contrast to the strong buy ratings assessed at the beginning of the year.
Seeking Alpha – TGT Quant Rating History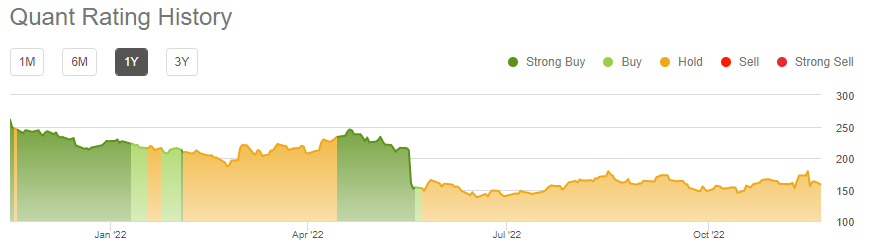
SA authors also appear to be on the same page, with most coverage over the last 30 days focused on holding. Two even made the case for selling.
Seeking Alpha – Summary Of SA Author Sentiment For TGT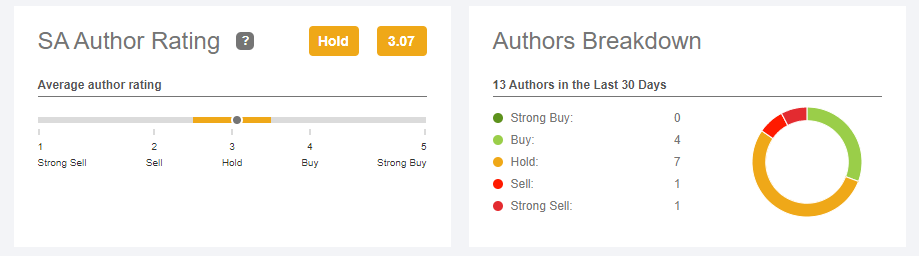
Overall, Wall Street views the stock more favorably. 14 out of 32 analysts over the last 30 days, for example, rate the stock as a strong buy. With an average price target of just under $180, the stock has upside of approximately 13%, according to consensus estimates.
Shares, however, are likely to remain under pressure. The company has missed earnings expectations for three quarters in a row, and they have significantly cut their margin outlook. In addition, inventory balances are still running high despite additional promotional activity. This increases the risk of the company being forced to engage in even more aggressive markdowns, especially if they experience a lackluster holiday sales season. While a short-term rebound is likely, it may prove safer to hold off on initiation for at least one or two more quarters.
TGT’s Business And Key Metrics
TGT is a leading retailer of a wide assortment of general merchandise and food, with total annual sales over the last twelve months (“LTM”) of approximately +$108B. This is well above sales figures achieved in the years prior to 2019. At that time, sales were averaging less than +$80B/year.
Compared to related names within the S&P 500, TGT is smaller than the larger supercenters of WMT and Costco (COST), with an enterprise value just a fraction of that commanded by either of the two.
Seeking Alpha – Capitalization Summary Of TGT Compared To Peers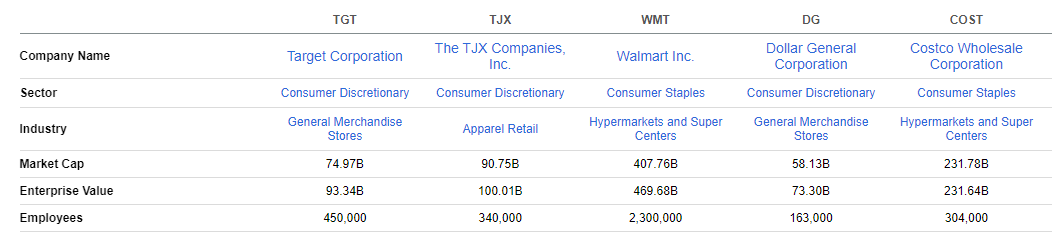
And while they are closely similar in market cap to The TJX Companies (TJX) and Dollar General (DG), annual revenues are more than double generated by either of those companies. TJX, however, does operate on significantly higher operating margins of over 9% versus TGT’s 4.5%.
Seeking Alpha – Key Income Statement Statistics Of TGT Compared To Peers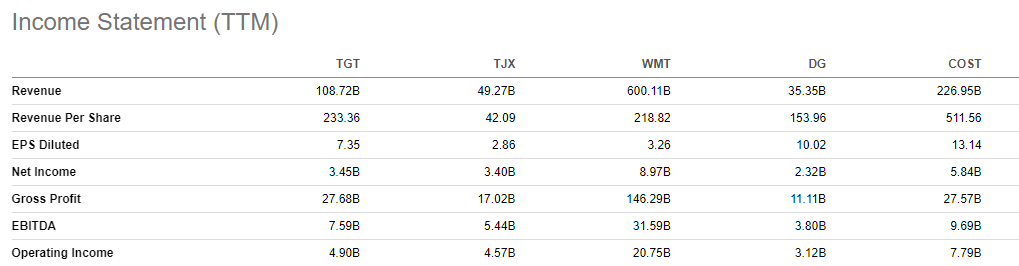
Comparable gross profit margins and strong cash generation offsets some of the weakness on overall operating margins, but many of their profitability metrics still lag behind the competition.
Seeking Alpha – Profitability Metrics Of TGT Compared To Peers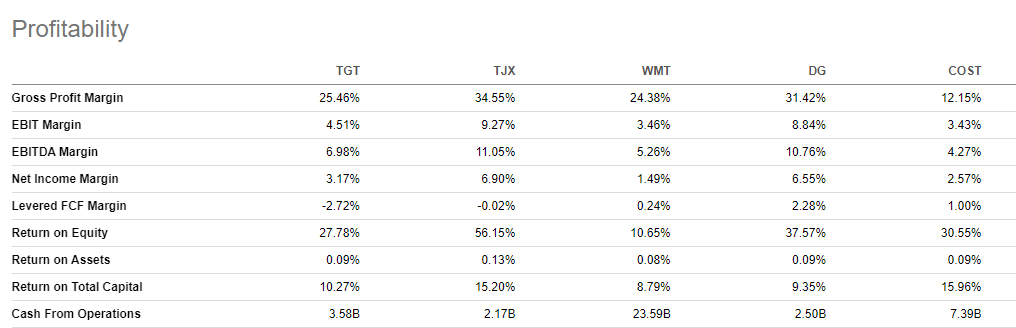
What Were TGT’s Expected Earnings?
Heading into their earnings release, expectations were already low. Earlier in the year, the company reported poor first quarter earnings results that came in less than expectations. And less than three weeks following that report, they issued a profit warning due to actions necessary to clear out excess goods.
That warning then came to fruition as second quarter net earnings came in 90% below prior year levels, with a 1.2% decline in operating margins. In-line with the warning prior to the release, this underperformance was largely attributable to inventory problems resulting from the shift in consumer spending habits from goods to services.
On the second quarter call, however, management noted that the financial impact of their inventory actions were largely behind them. This was followed by guidance projecting a rise in operating margins to 6% in the second half of the year.
With this in mind, investors were expecting third quarter earnings per share (“EPS”) and revenues of $2.18/share and +$26.4B, respectively. After missing expectations in the prior two quarters, shareholders were on edge.
Seeking Alpha – Summary Of TGT’s Earnings Performance Compared To Consensus Estimates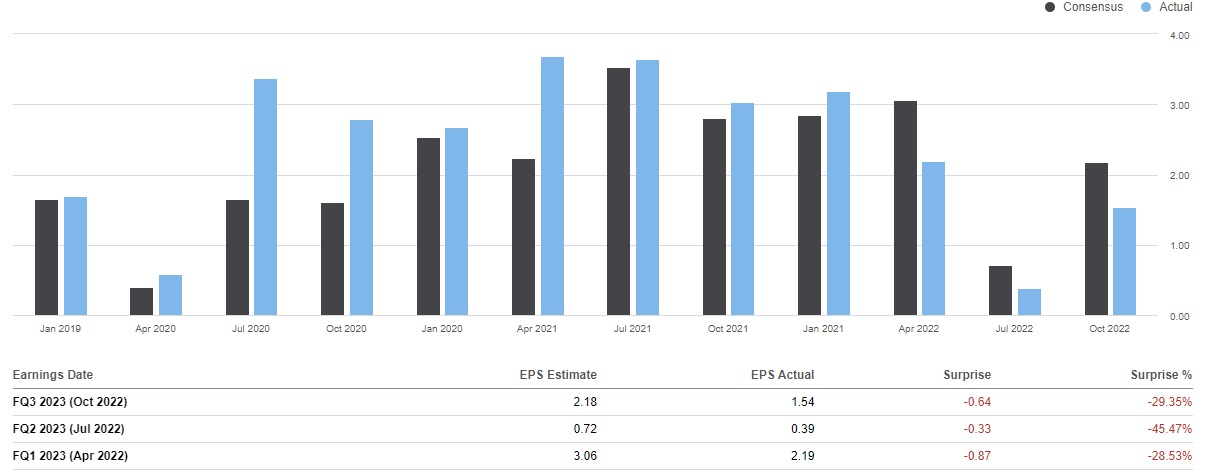
Nevertheless, there was a sense of optimism following strong results by WMT and The Home Depot (HD) on the day prior. WMT, for example, reported comparable sales growth of 8.2% and, more importantly, provided favorable commentary on their current inventory balances, with their glut down about half a billion from the prior quarter.
The positive news from both WMT and HD sent most retailers broadly higher on the day. The rally, however, proved to be short lived, at least for TGT.
Did TGT Beat Earnings?
After providing hopeful commentary on their Q2 release, shares plunged following the release of their Q3 results. Overall, the company reported total revenues of +$26.5B. This was up about 3.5% YOY and +$120M better than expected.
Earnings, however, badly missed estimates for the third consecutive quarter. This time by $0.64/share, which was 29% below consensus estimates. While it was less of a miss than the second quarter, it comes as no solace, considering YTD earnings have now missed by a collective $1.84/share.
Top line sales continue to benefit from growth in customer traffic levels. And comparable store sales were up 2.7% during the quarter, which was slightly better than expected. But the company did note increasing signs of consumer stress, especially in the back half of the quarter.
Through the first two months of the quarter, for example, comparable sales were up over 3%, according to management. In October, however, growth decelerated significantly to less than 1%. Additionally, compared to the two months prior, the sales mix in October was weighted more towards promotions, which is suggestive of the heightened level of price sensitivity exhibited by the consumer.
As persistently high rates of inflation and rising rates continue to erode consumer purchasing power, many are dipping further into reserves and/or relying on increased borrowings to fund their purchases. Accordingly, many are becoming more hesitant to purchase goods at full price.
And this appears to be occurring across the income spectrum, as noted by WMT on their conference call, where they attributed earnings strength in part to increased sales to households earning over $100K/year. While WMT benefits from being known for their “everyday low prices”, TGT tends to be viewed to the contrary. It also doesn’t help that TGT is more dependent on selling discretionary goods.
Strong growth in frequency goods, such as foods, beverages, and beauty and household essentials, did offset some of the weakness experienced in the more discretionary categories, such as apparel, home, and electronics. But even in the frequency items, consumers weren’t exactly splurging. Many were trading into smaller pack sizes and/or opportunistically buying in bulk during promotions.
The one exception to this was their beauty products, which continued to deliver strong sales growth. In the current quarter, sales in this category were up in the mid-teens, driven by their Ulta Beauty partnership, which contributed to a tripling in YOY sales volume.
What To Expect In The Periods Ahead
Management was clearly cautious in their tone throughout the earnings call. In particular, they lowered their expectations for the holiday quarter, which is notable since a larger share of annual revenues customarily occurs in November and December.
Marked deceleration was noted in October and the first half of November. Interestingly, however, overall retail sales were up sharply during October, according to data released by the Commerce Department on the same day of TGT’s earnings release.
While shoppers did spend more on staples, such as energy and food, they also spent more on discretionary items, perhaps enticed by a greater amount of discounted goods in advance of the upcoming holiday season.
If there was a pull forward in demand, this could indeed result in a muted holiday season for TGT. With inventory balances still elevated, margins could be pressured further if the company has to more aggressively markdown goods in January and February.
Management did note that they expect to end the season with cleaner inventory balances. But with inventory balances still up 50% from three years ago, it could take more than several months to work through the balances.
YCharts – TGT’s Quarterly Inventory/Sales Ratio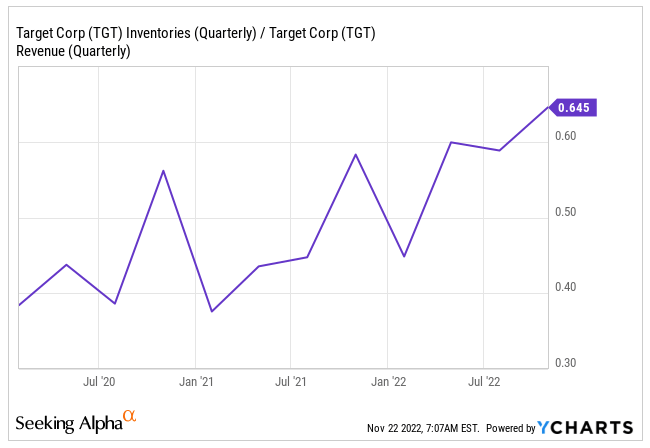
Adding further pressure to margins are increased thefts and higher incremental costs of managing early inventory due to improved lead times on orders. Collectively with increased promotional activity, these three factors are expected to reduce gross margin by more than +$600M for the year.
With all this in mind, Q4 comparable sales are now expected to decline by a low-single digit percentage, and operating margins are expected to be 3%, which is a far cry from the 6% projected earlier in the year.
In addition, TGT expects to start a cost-cutting effort to save about +$2B to +$3B over the next three years. However, no major layoffs or hiring freezes are expected as part of the new program. In fact, the company plans to hire about 100K additional workers for the holiday season. This is in-line with last year and an opposite approach to WMT, who announced that they would be hiring about 40K fewer workers.
Is TGT A Buy Following Earnings?
TGT is clearly struggling compared to other major retailers. They have missed earnings estimates for three consecutive quarters and recently slashed their outlook for operating margins to a level that is half of where it was originally expected to be.
Perpetually misjudging their inventory requirements is one major factor to the underperformance. Prior to 2020, for example, the company was turning inventory in about 60 days. That has since expanded to 72 days over the last twelve months.
Consequently, the company is now being forced to discount many of these excess goods, which is perhaps resulting in a greater pull forward in consumer demand in advance of the holiday season. With inventory balances about 14% higher than last year heading into December, TGT could find themselves more aggressively marking down products in January and February.
Despite their inventory woes, traffic levels are still up about 1.4% from last year, and they are still gaining market share in their five main categories. Demand is particularly strong in their beauty products, while demand for their other frequency items trails just slightly behind figures reported by WMT.
A recently announced cost-cutting program, in addition to newly initiated partnerships with popular brands, such as Disney (DIS) and Ulta Beauty (ULTA) are two potential catalysts that could prop shares higher in later periods.
But at present, the economic landscape heading into the prime holiday season is too uncertain for new initiation. While their earnings multiple has compressed over the past several months, their current enterprise value in relation to EBITDA is still above 5-year averages. For those seeking a bargain in the retail sector, TGT is one that is not yet at an “everyday low price.”
Be the first to comment