

Berkut_34/iStock via Getty Images
It has been over a year since we last wrote about Targa Resources (NYSE:TRGP) – March 16, 2021 to be exact, and it is time to revisit the company to see how it is doing. In the previous article, we explored what Targa was going to do with all its new-found free cash flow. Based on Targa’s guidance and the consensus macro-outlook, and a bit of speculative guesswork, here were the top 5 expectations at the time:
Expectation #1 based on Targa’s guidance: Targa will pay Stonepeak Infrastructure Partners, their joint venture equity partner, between $900-950MM to buy Stonepeak’s portions of 3 joint ventures and reap a return of 5-6x EBITDA or $168MM/year at the midpoint. The terms for a buyback became more favorable in Q1 2022 so Targa guided towards a buyback during this time. Result: Targa’s guidance was spot on. They paid $925MM and closed this transaction on Jan 10, 2022. After closing, Targa owned a 25% interest in the GCX natural gas pipeline, a 75% interest in the Grand Prix NGL pipeline and 100% interest in fractionation train 6 in Mont Belvieu, TX. The only surprise – Targa turned right around and sold their entire 25% interest in the GCX pipeline for $857MM, collecting an 11x EBITDA multiple on the deal.
Expectation # 2, based on general consensus: The commodity outlook was favorable and would lift Targa returns. Boy was this an understatement. Who could have foreseen Henry Hub natural gas price north of $9/MMbtu, WTI at $120/bbl and the Mont Belvieu NGL Composite Liquid pricing blowing out to $12.62/MMbtu? While we’ve come down off those levels, commodity prices are still elevated, and the consensus view is that they will remain elevated. Using Targa’s published “Commodity Price Sensitivity” chart, the high commodity prices added $573MM in net EBITDA in 2022 relative to 2020. That’s a shocking amount.
Expectation # 3, based on general consensus: Basis spreads between Waha and Henry Hub would not blow out due to sufficient takeaway capacity in the Permian Basin. Public E&P companies would refrain from increasing their CAPEX spend while private companies may choose to hedge and drill. Result: Waha basis spreads have been healthy due to sufficient takeaway capacity. Although Permian gas production is climbing, there are enough projects in the work, including the recently announced 2.0 to 2.5 Bcf/d Matterhorn Express Pipeline and several pipeline capacity improvement projects to prevent depressed Waha natural gas prices. Public E&P companies have maintained their discipline while private companies drilled away. The net result is relatively slow and modest growth with strong demand recovery leading to higher commodity prices.
Expectation # 4, based on the math: After paying for dividends (both common and preferred), Targa would generate $654MM in additional free cash flow in 2021 and $780MM in additional cash flow in 2022. Result: After paying out $87MM in preferred distributions and $92MM in common distributions, Targa generated a whopping $955MM in additional free cash flow in 2021. In 2022, despite raising the common distribution to $1.40 per share from $0.40 per share in 2021, Targa will generate $1,119MM in additional free cash, and this is excluding the recent Lucid Energy acquisition, which we will discuss in detail below. Targa is printing gobs of cash.
Expectation #5, based on speculation: Targa could take-out their preferred equity in 2022 (generating another $90MM/year in FCF), or use it to fund new growth CAPEX, or buy another small midstream company or buy a significant swath of common equity. Result: I used the wrong conjunction as Targa did all of the above: they took out the last of the preferred equity in April of this year, paying $974MM. They increased their growth CAPEX from $400MM in 2021 to $750MM in 2022 and they bought two systems: Southcross Energy in the Eagle Ford in April of this year for $200MM and the recently announced Lucid Energy for $3,550MM in the Delaware Basin. Targa even managed to whittle down the common share count by around 800K shares.
It’s time to revise your guide
On the Q1 2022 earnings call, Jeremy Tonet, an energy research analyst at JP Morgan asked the obligatory question regarding updated guidance. It’s a question that comes up often when it’s clear that the annual guidance needs adjusting: “So just reconcile these different things. I know the commodity price isn’t baked into the guide where it is right now, but Southcross annualizing first quarter all points to above the high end. Is there any offsets over the balance of the year that we should be thinking about?” This is polite analyst speak for “your guidance needs adjusting.”
Jennifer Kneale and Matthew Meloy, Targa’s CFO and CEO, then spent a considerable amount of time dancing around the subject, pointing out this nuance and that nuance, and generally saying that yes, things look favorable. Jeremy responded to this brilliantly, “Got it. So I didn’t hear anything to walk me away from kind of $2.7 billion, $2.8 billion [2022 EBITDA] or more if commodity prices…” And the entire Targa team burst out laughing in a rare moment of levity. Matt then interjected through suppressed laughter, “We have not been that specific. We just said, I think we’re in good shape as we kind of move throughout the rest of this year if prices hang around here — even if prices don’t hang around here, I think we’re in really good shape.” Everybody on that call knew the guide would be revised higher, but Targa wanted to wait for the Lucid Energy announcement to provide better clarity.
A month and half later, Targa’s June 16th press release announced the acquisition of Lucid Energy and revised the guide to $2.675 billion to $2.775 billion excluding the Lucid Energy Acquisition. Jeremy was spot on.
Lucid Energy Acquisition
Before we dive into the updated numbers, let’s take a minute to highlight a few bullet points on the Lucid Energy acquisition. This is a spectacular purchase for Targa:
- The gathering and processing system is in the core of the Delaware basin with over 20+ years of inventory at the current drilling pace. If you’re going to buy a new system, buy it in the Permian cores – take your pick, Delaware or Midland, they are both growing. For more information on the Permian basin, read Oil and Gas Blues – Implications of a Peaking Permian.
- It comes with 1050 miles of pipe and 1.4 bcf/d of natural gas processing.
- Long-term fixed-fee contracts with 600,000 dedicated acres. This is 938 square miles, which is massive. The Delaware has multiple stacked intervals to drill, and Lea and Eddy counties are in the core of the basin.
- It is expected to grow significantly in 2023 with 40 rigs on dedicated acres drilling away.
- It will offer a healthy 7.5 x EBITDA based on 2023 numbers.
- Some of the processing volumes are currently being subcontracted to third-party companies, so Targa will gladly move this business over to their plants to process.
- Over time, they can move significant incremental volumes through Targa’s Logistics and Transportation systems (NGL transportation, fractionation, LPG export services).
- It overlays their existing system, so integration will be minimal.
- Targa’s balance sheet is so strong, the acquisition will drive the debt to EBITDA ratio modestly higher, from 2.7 to 3.5 (on a proforma basis).
- It is accretive to Targa shareholders – we’ll dig into the numbers next.
Targa’s Delaware System (Targa Resources )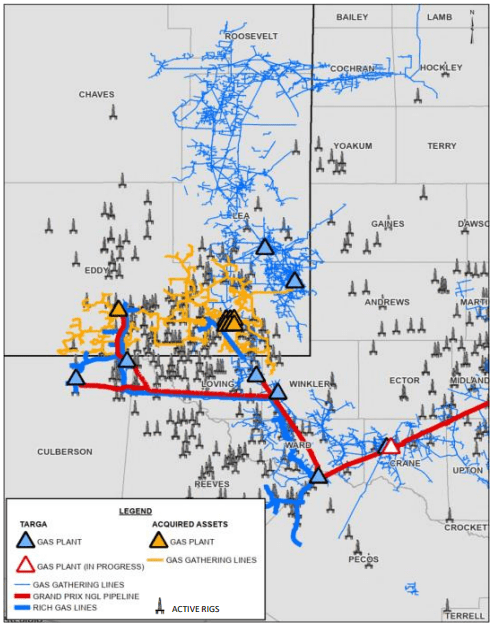
One thing that the press release didn’t do was to provide the updated 2022 guidance with the Lucid Energy acquisition, in part because the date of closing hasn’t been set. It is expected to close in Q3, but it didn’t specify a date and didn’t specify the EBITDA return in 2022. If we make some assumptions, the full guidance will look something like this:
Targa’s EBITDA estimate for 2022 and 2023 (Author)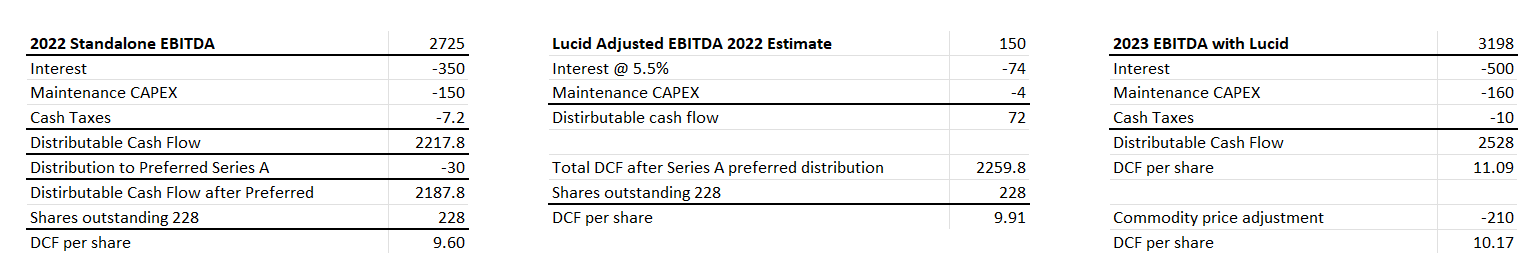
All figures are in millions of dollars except distributable cash flow or DCF per share. The chart makes several assumptions:
- The acquisition will close in mid Q3 2022.
- The average interest on the debt used to finance the acquisition will be 5.5%.
- Lucid’s EBITDA is $100MM per quarter in 2022, rising to $473MM for all of 2023.
- Since the system is less than 5 years old, the maintenance CAPEX will be $10MM per year or less.
- Adding a bit of conservatism to the outlook, the chart assumes no growth from the legacy Targa systems, which is unlikely.
- EBITDA will climb to between $3000MM and $3200MM depending on commodity prices and Targa’s overall volumes.
- Based on these assumptions, 2023 DCF per share will be between $10 and $11 per share, depending on commodity prices.
- The upper band of $3200MM in EBITDA is based on their current commodity price guide for 2022, and assumes that prices will remain this way into 2023: Targa’s updated financial expectations for 2022 assume natural gas liquids (“NGL”) composite prices average $1.05 per gallon, crude oil prices average $100 per barrel and Waha natural gas prices average $6.00 per million British Thermal Units (“MMbtu”) for the remainder of 2022.
- The lower band of $3000MM in EBITDA assumes this is walked back with natural gas liquids (“NGL”) composite prices averaging $0.85 per gallon, crude oil prices at $75 per barrel and Waha natural gas prices averaging $3.75 per million British Thermal Units (“MMbtu”) for 2023.
These EBITDA and DCF figures are all records for Targa. No wonder the Targa team is laughing… laughing all the way to the bank.
Growth Capex and Acquisitions – Return on Invested Capital
Using their annual reports, I compiled all their invested CAPEX since 2015 and created the following chart.
Targa’s invested capital 2015-2022 (Author with data from Targa’s annual reports)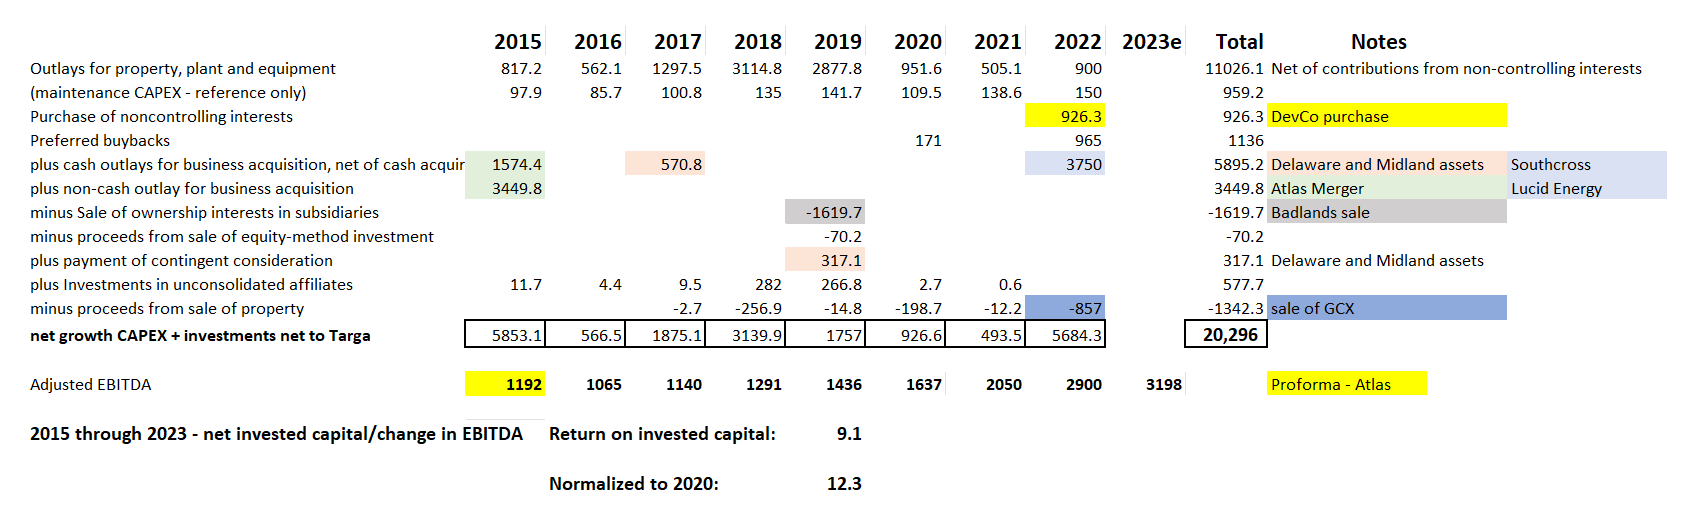
There is a lot to unpack with this busy chart:
- Figures are in millions of dollars except the return on invested capital at the bottom center of the chart.
- Outlays for property, plant and equipment include both growth CAPEX and maintenance CAPEX. The final calculations include both these CAPEX buckets. I have listed maintenance CAPEX on a separate line for reference only. The outlays for property, plant and equipment are also net of contribution from non-controlling interests. We don’t want to include this CAPEX because both the CAPEX contribution and the equity in these investments belong to third-party companies.
- For the net amount that Targa has invested, the sale of property reduces the final figure and acquisitions increase it. From 2015 through 2022, Targa has invested (or will invest) $23.3 billion in capital and they have sold $3 billion, so the net amount of capital invested in $20.3 billion.
- The 2014 adjusted EBITDA was $970MM. Based on our previous estimates, Targa will grow EBITDA to $3.2 billion, meaning that Targa invested a net of $20.3 billion to grow EBITDA by $2.2 billion or a 9.1% return on invested capital (net invested capital divided by the growth in EBITDA).
- Because we are in a high commodity price environment and Targa’s EBITDA figures change significantly with fluctuations in commodity prices, you might be interested to know what that return would be in a low commodity price environment. Using Targa commodity price sensitivity chart, we can normalize these numbers for 2020, which is an extremely low commodity price environment (WTI at $39/bbl, Waha at $1.50/MMbtu and NGL Composite at $0.39/gal). This puts a lower bound on the return and gives us a range – essentially 9x to 12x.
If we take the midpoint of that CAPEX return (10.5) and convert that to percent terms, that means that Targa is earning on average 9.5% on their investments net of declines across their entire portfolio. That last part is important. In their latest presentation, Targe highlights that the 3 most recent transactions – Southcross purchased at 3x EBTIDA, Lucid purchased at 7.5x EBITDA and the sale of GCX pipeline sold for 11x EBITDA – generated a net return of 6.5x. That is true and it should be commended, but it doesn’t include the declining returns for their sprawling systems across the lower 48 where drilling is at a minimum. We must balance the great purchases and sales with the declining footprints elsewhere.
A return of 9.5% might not sound like a lot, but remember, we are still in a very low interest rate environment, even with the Fed’s recent 0.75% hike in short term interest rates. Targa’s cost of capital is around 5%. From the end of 2014 to the end of 2022, Targa will have grown their net debt from roughly $3 billion to $10 billion. As their leverage ratios got too stretched, they added preferred equity and joint ventures (at roughly a 9% cost of capital) to soak up the additional capital needed without stretching their balance sheet. Then, as their balance sheet improved, they simplified the capital structure and “took-out” these higher cost of capital investments. The net effect of all of this is to significantly goose the returns for the equity investor.
So where does the common equity investor stand? As stated above, distributable cash flow (DCF) in 2023 is estimated to be between $10-$11 per share. As of Friday, June 17, 2022’s closing price of $60.65 per share, this gives us a DCF return of 16.5% to 18% in 2023. Since we don’t need to worry about the Series A Preferred equity because it was purchased in Q1 2022, that’s it. That makes Targa a buy at these price levels. That’s the fundamental analysis.
Technical Analysis
If fundamental analysis is the wise university professor, quietly and systematically walking you through the company’s financials, year-by-year, step-by-orderly-step, price action is a manic-depressive creature. At times, price can be completely divorced from the fundamentals of the company. From March of 2020 to April 2022, Targa sold from a low of $3.66/share to a high of $81.50/share. What is the current price action telling us to do?
Targa Price Chart from 2019-2022 – Weekly Candles (Author – Software is Motivewave)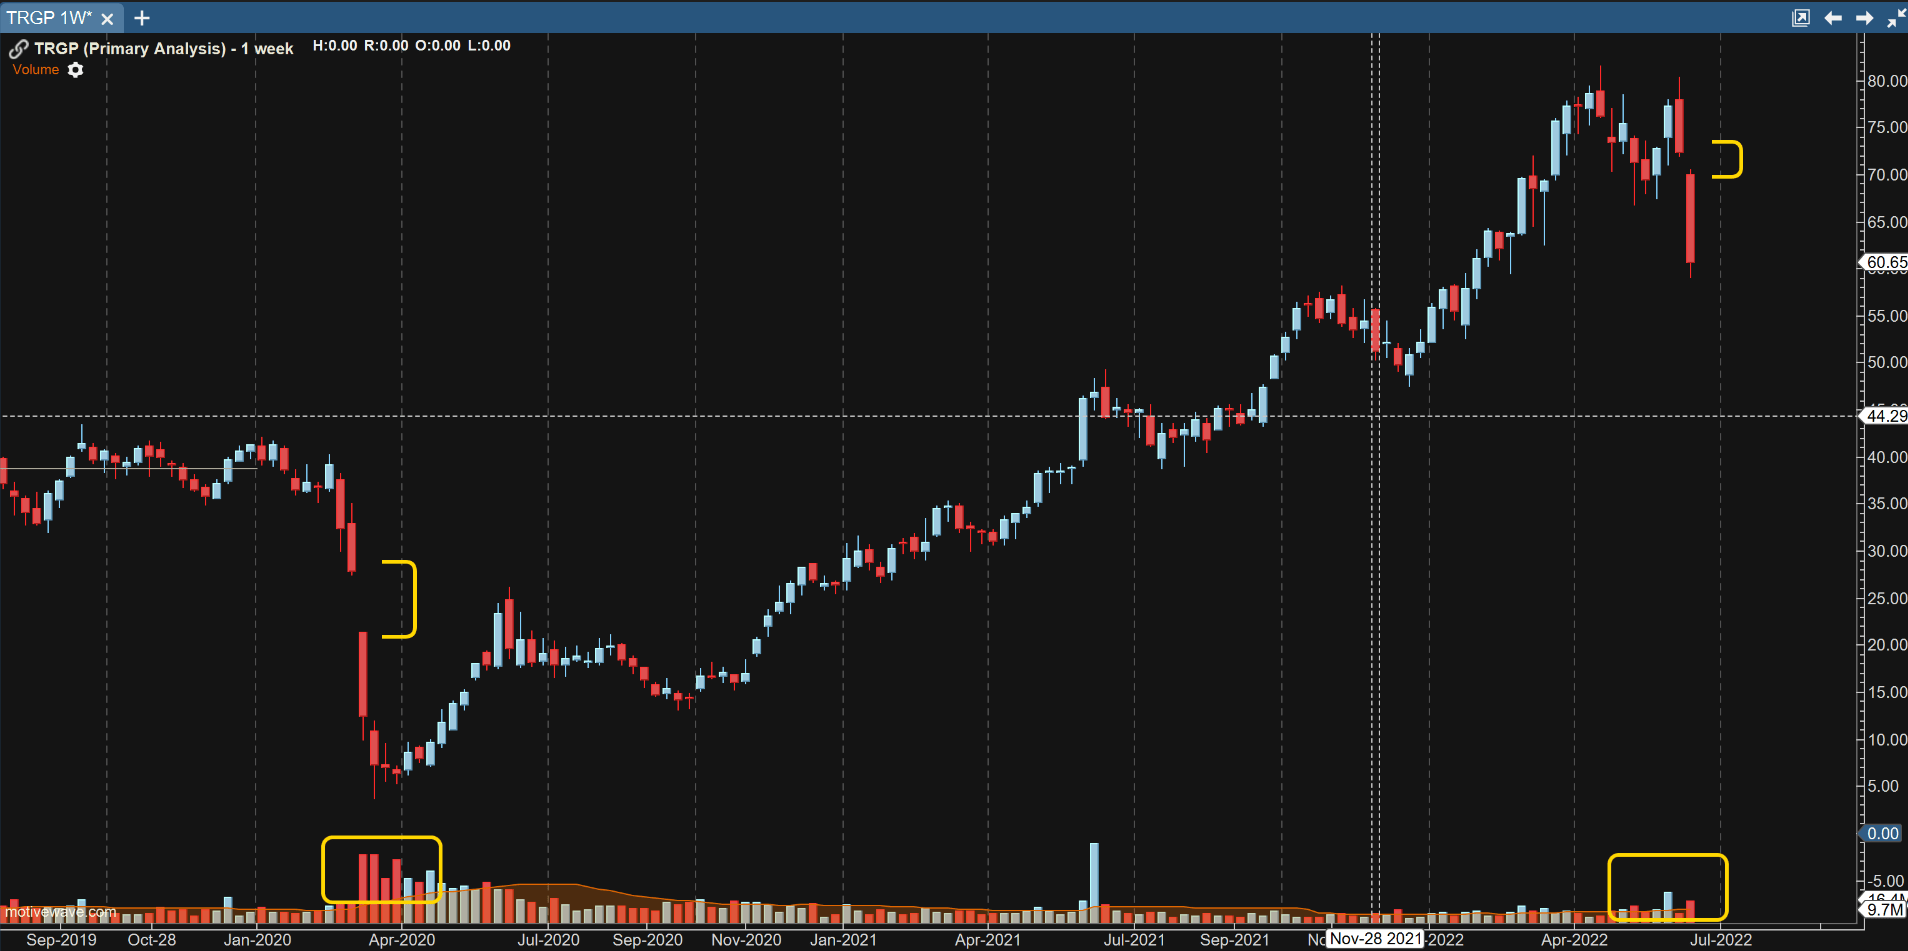
This is a weekly candle chart of Targa spanning from Sept 2019 through today. We’ve highlighted a few things on the chart. The yellow bracket on the left-hand side of the chart shows a large price gap when the bottom fell out of the oil and gas market during the early stages of COVID. Note the ginormous volume signature at the bottom of the chart that dwarfs the volume bars shown previously. That is a ton of leverage leaving the space in a hurry. It is companies and funds and individuals chased out of their positions, needing to sell at any price. It took pricing a year to recover that gap.
On the right-hand side of the chart, we see another recent price gap (smaller yellow bracket), on slightly higher than normal volume but not nearly as much volume as was seen in March of 2020. That is price exhaustion from a huge run-up, and a lack of buyers. Large, “hot,” weekly candles (larger than any candle on the run-up), on relatively average volume, tell us that the move from March of 2020 to April 2021 is retracing. We may get a bounce into the gap, but it will take us a while to recover. In the meantime, it is hard to know where the price will settle. In technical analysis, we are taught to “look to the left” for support. I see support at $58, $48 and certainly in the $42 range. What stops the pull-back is hard to gauge. In any case, price action is telling us to wait for the chart to settle out before buying anything.
Conclusion
Based on fundamentals, Targa is a buy with a 2023 DCF yield of 16.5% to 18%. Although their debt to EBITDA ratio will climb to 3.5 by year’s end, they are generating so much cash flow that all things being the same, this ratio will drop back down to 2.8 by the end of 2023. Their balance sheet is so strong, they can simply rinse and repeat next year – buy another large system and keep growing their DCF yield organically and through acquisitions. Targa is a growth stock.
Due to the recent volatility, investors can afford to be patient and wait for a better entry point. Back in the 2008 financial crisis, Energy was the last sector to be taken out. Given the fears around higher interest rates and a potential recession, we may be experiencing a miniature version of that. However, I’m of the camp that says you can’t have a recession without a meaningful deterioration of the employment numbers. May’s employment numbers came in very strong on a seasonally adjusted basis, which tells us that higher interest rates and inflation have yet to kill the growing economy. It makes sense then to buy into the price weakness when valuations rise significantly.
Be the first to comment