

buzbuzzer/E+ via Getty Images
Due to their stability and strong cash flows, REITs can make for some of the best investment opportunities on the market. Of course, it all boils down to finding a quality operator and remaining patient. One firm that has performed extraordinarily well over the past couple of years is Tanger Factory Outlet Centers (NYSE:SKT). This player, which has a consolidated portfolio of 30 outlet centers totaling 11.5 million square feet of gross leasable area, plus an ownership interest in six unconsolidated outlet centers totaling 2.1 million square feet, has been a real winner for long-term investors. Even after seeing shares rise significantly, the exciting thing is that the company appears to offer even more upside moving forward. Because of this, I’ve decided to retain my ‘buy’ rating on the enterprise for the time being.
A nice recovery
Back in March of 2020, I wrote an article about Tanger Factory Outlet Centers. In that article, I said that the company was looking quite attractive. But at that time, we were still in the earliest stages of the COVID-19 pandemic. I did warn that the company could experience some downturn as a result. Sure enough, that did come to pass, but the company has, so far, done quite well to recover. Ultimately, I felt that shares were cheap enough and the quality of the company was high enough to warrant a ‘buy’ rating, which means that I felt like it would outperform the broader market over an extended time frame. Based on the data provided, that has come to pass. Inclusive of distributions paid out to shareholders, the company has generated a return since the publication of that article of 170.3%. That compares to the 70.6% return achieved by the S&P 500 over the same period of time.
Author – SEC EDGAR Data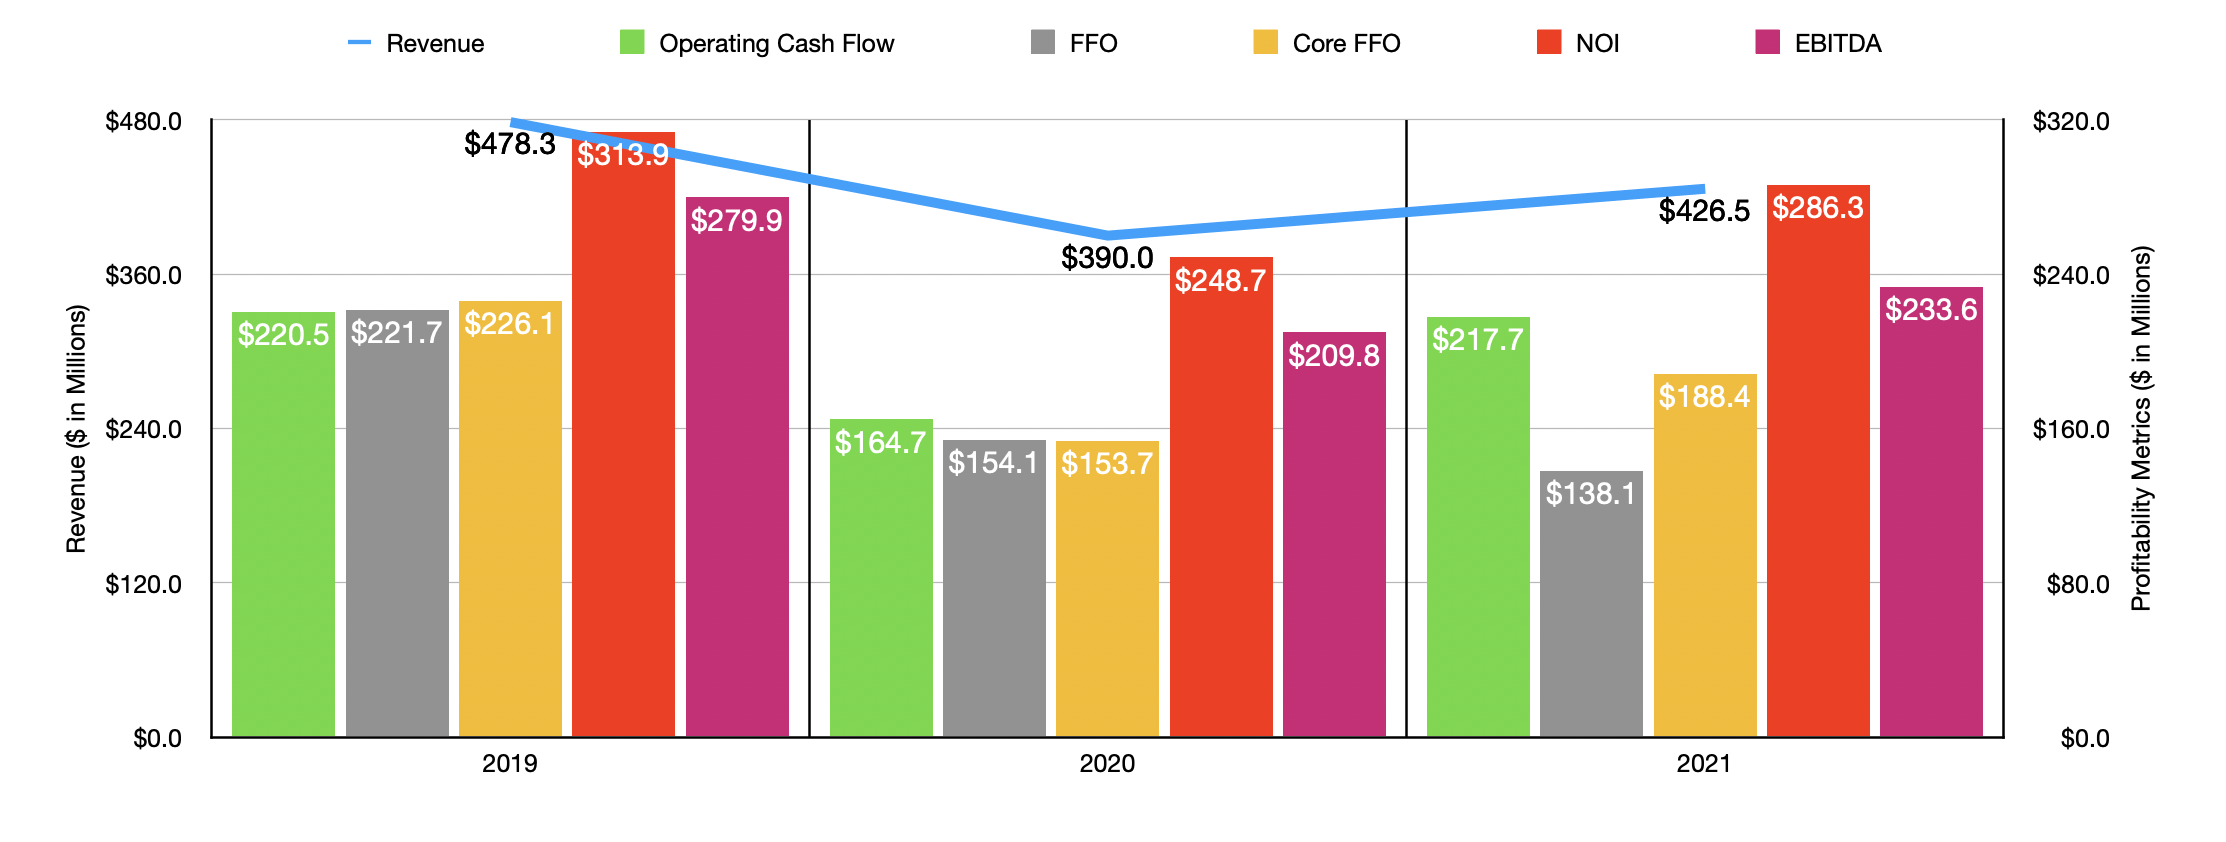
To be clear, the 2020 fiscal year was rather difficult for Tanger Factory Outlet Centers. After seeing revenue hit $478.3 million in 2019, the metric then fell to $390 million last year. This came as the occupancy rate at its shopping centers dropped from 97% to 92%. In addition to that, the company was also impacted by a decline in the average annual base rent per square foot. This metric declined from $25.35 in 2019 to $21.10 in 2020. This brought with it declines in profitability. Operating cash flow, for instance, dropped from $220.5 million to $164.7 million. As the chart above illustrates, other profitability metrics for the company also suffered.
The good news for investors is that this decline was short-lived. During the 2021 fiscal year, revenue rebounded some, climbing to $426.5 million. This came as the occupancy rate at the company’s properties increased to 95% and as the average annual base rent per square foot grew to $23.79. Although revenue was not yet back to the pre-pandemic levels, it is worth noting that the company unloaded one of its 31 shopping centers leading up to this point. That would have had an impact on the company’s top line even if it recovered entirely to pre-pandemic levels. Operating cash flow climbed to $217.7 million for the year. FFO, or funds from operations, continued to decline, dropping from $154.1 million in 2020 to $138.1 million last year. But if we make certain adjustments, this metric would have risen from $153.7 million to $188.4 million. Net operating income, also known as NOI, increased from $248.7 million in 2020 to $286.3 million last year. And EBITDA made the climb from $203.8 million to $233.6 million.
Author – SEC EDGAR Data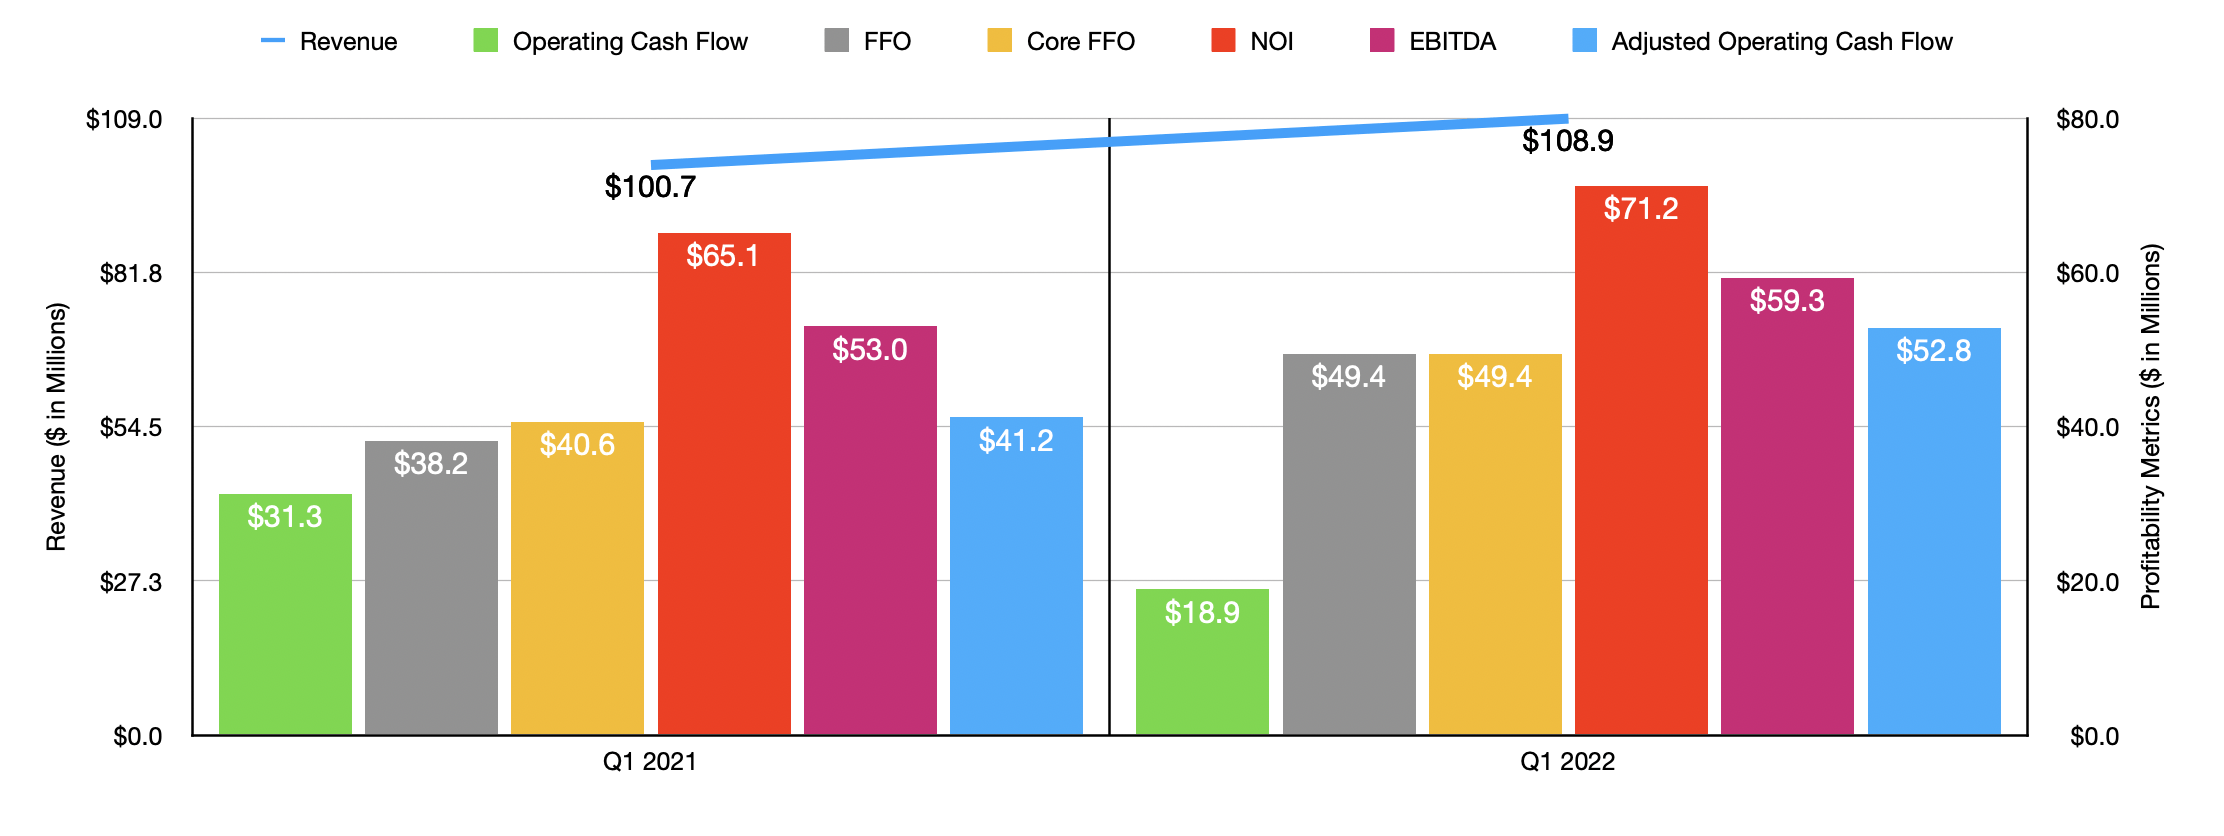
Growth for the company has continued into the 2022 fiscal year. Revenue went from $100.7 million in the first quarter of last year to $108.9 million the same time this year. This came in large part because of an increase in the company’s occupancy rate from 92% to 94.3%. Operating cash flow did suffer, dropping from $31.3 million last year up to $18.9 million this year. However, other profitability metrics have shown year-over-year improvements. As an example, if we adjust for changes in working capital, operating cash flow would have risen from $41.2 million to $52.8 million. FFO rose from $38.2 million to $49.4 million. Meanwhile, the adjusted figure for this increased from $40.6 million to $49.4 million. An increase also came from NOI, with the metric ultimately climbing from $65.1 million to $71.2 million. And finally, EBITDA also showed improvement, rising from $53 million to $59.3 million.
Author – SEC EDGAR Data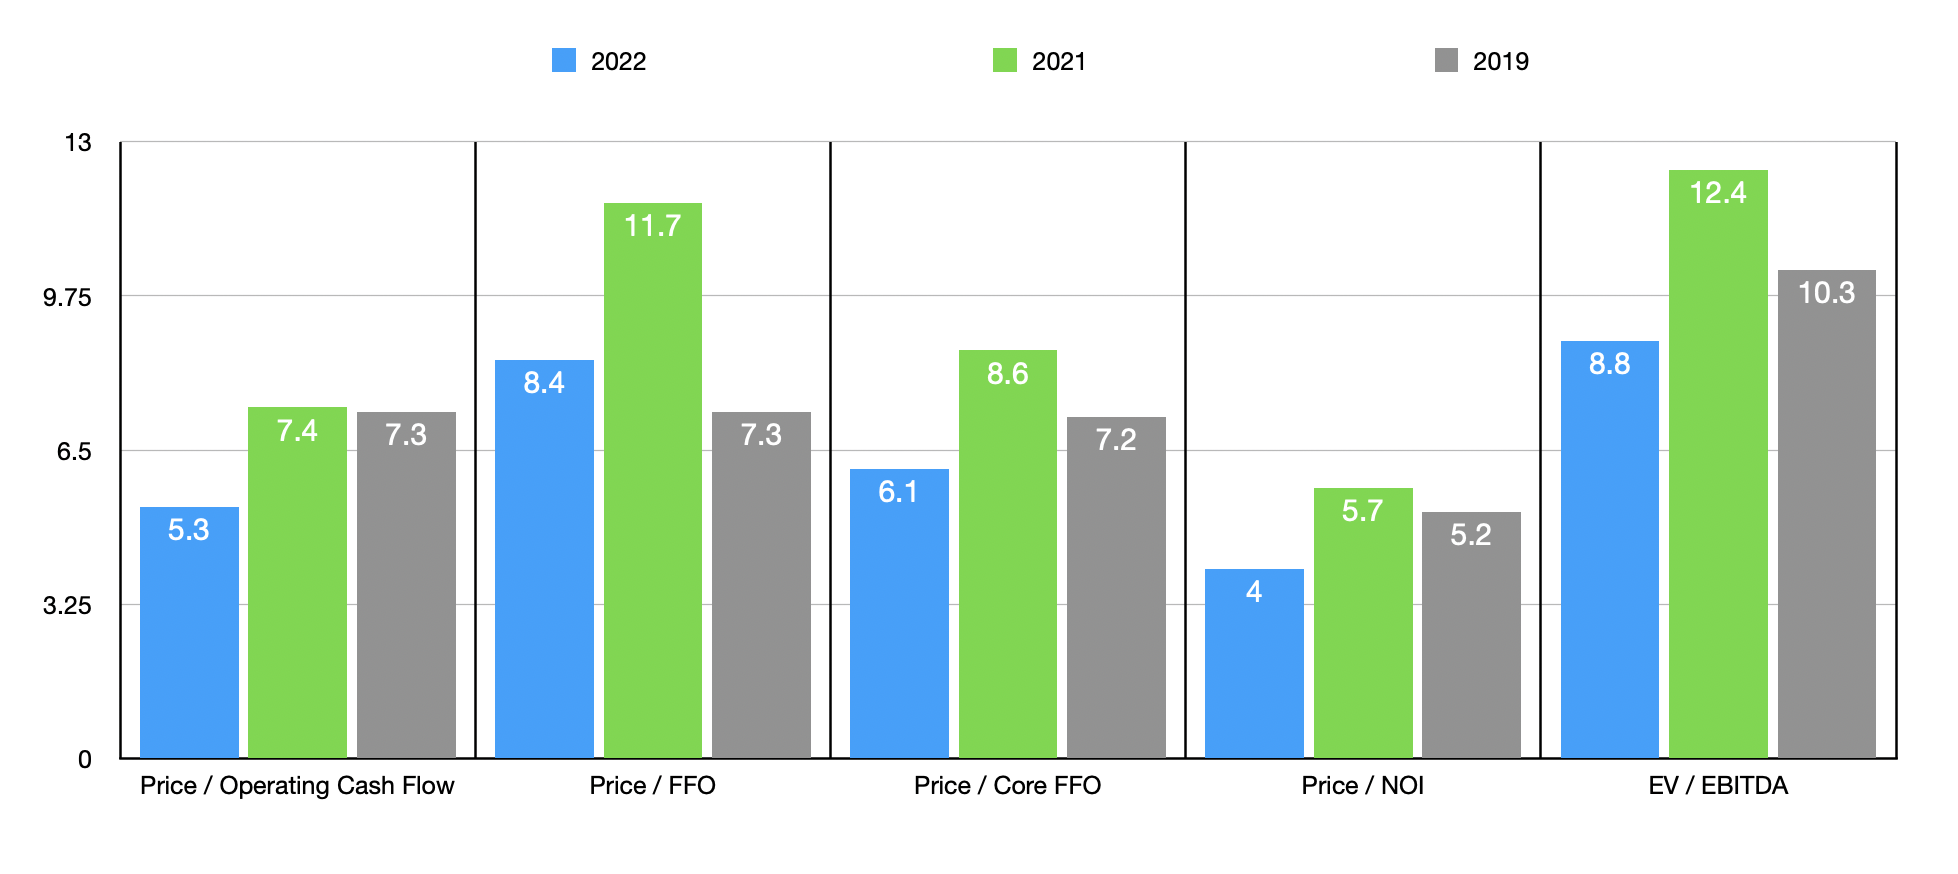
For the current fiscal year, management forecasted FFO per share of between $1.71 and $1.79. At the midpoint, this would translate to a reading of $193.4 million. Assuming that other profitability metrics will change at the same rate that this should, we should anticipate adjusted FFO of $263.8 million. Operating cash flow should be around $304.9 million, while NOI should be $400.9 million. Meanwhile, EBITDA should come in at around $327.1 million for the year. Using these figures, shares of the company look rather cheap. The price to operating cash flow multiple, on a forward basis, is 5.3. That compares to the 7.4 and 7.3 readings that we get if we use 2021 and 2019 figures, respectively. The price to FFO multiple should be 8.4. The price to adjusted FFO multiple would be about 6.1, while the price to NOI multiple should be just 4. Finally, the EV to EBITDA multiple should come in at around 8.8. Just as was the case with the price to operating cash flow multiple, each of these are cheaper than the figures for the company if we were to rely on 2021 results or 2019 results.
In addition to shares being low on an absolute basis, they are also low relative to similar players. Using our 2021 results, I decided to compare Tanger Factory Outlet Centers to five similar firms. On a price to operating cash flow basis, these companies ranged from a low of 8.9 to a high of 18.8. And using the EV to EBITDA approach, the range was from 13.8 to 22.2. In both cases, Tanger Factory Outlet Centers was the cheapest of the group.
| Company | Price / Operating Cash Flow | EV / EBITDA |
| Tanger Factory Outlet Centers | 7.4 | 12.4 |
| Acadia Realty Trust (AKR) | 14.0 | 15.5 |
| Saul Centers (BFS) | 8.9 | 17.5 |
| InvenTrust Properties (IVT) | 18.8 | 22.2 |
| Urban Edge Properties (UE) | 12.9 | 13.8 |
| Getty Realty Trust (GTY) | 13.6 | 13.9 |
Takeaway
Although shares of Tanger Factory Outlet Centers have risen tremendously over the past two years, the data suggests that the company might still have further upside moving forward. Even if the firm does not achieve the financial performance I estimated for the 2022 fiscal year, the stock still looks cheap on an absolute basis and relative to similar players. Because of this, I have decided to retain my ‘buy’ rating on the enterprise.
Be the first to comment