

shalamov/iStock via Getty Images
In the investing world, the Aesop fable (likely written hundreds of years BC) about the tortoise and the hare is referenced on a regular basis. For good reason, because the race resembles the internal struggle we face every year while trading or investing.
What is in your account after a number of years is determined by the compound returns of your portfolio. It is not based on the average return per year you achieve. Thinking about the difference helps me to prioritize multi-year returns and tends to decrease my appetite to be at the top of the leaderboard this year. Not that I would mind, but striving to be there could actually be counterproductive.
If you earn 10% this year but then go on and lose 10% the next, you are down 1%. You are not even. The arithmetic return is 0% but the compound return is -0.5% (.99^2 – 1).
Interestingly, as the return dispersion is higher, the compound return goes down(in a scenario where the average remains the same).
One of the nicer graphs I’ve ever seen to illustrate this effect is by a fellow Seeking Alpha author, Simple Allocation:
Graph by Simple Allocation (Seeking Alpha)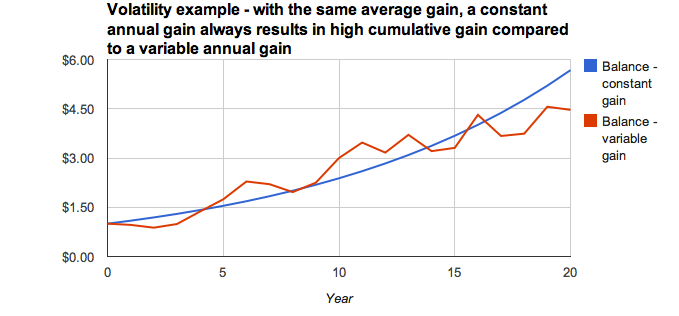
At the same average returns, the less volatile time series compounds into a much greater sum.
I don’t think the above is evident to many. Early in my development as an investor, I gravitated towards classical value investing (think Benjamin Graham and the early Warren Buffett). To this day, that’s the foundation of how I approach investing. But there are some maxims in the value school that have tripped me up. For example, there’s a famous Buffett quote that gets repeated now and then:
“Charlie (Munger) and I would much rather earn a lumpy 15 percent over time than a smooth 12 percent.”
Interestingly, it depends on the volatility. If you own 12% per year 10 years in a row, and you are up 7% one year and 17% the next, you are compounding at 11.89% per year.
If you are up 50% and down 20% the next year, ten years in a row, you achieved average annual returns of 15%. Your compounded annual return is much lower at 9.54%. You end up with way less money compared to the smooth 12%.
It is contradicted by another one of his ideas:
Rule nr.1 is don’t lose money, rule nr.2 is don’t forget the first rule.
This idea holds up a lot better. Yet we’ve just gone through a decade or so with the lowest interest rates in 5000 years of recorded history. It has been tough to generate any returns without running the risk of losing some money.
I’m arguing that reducing volatility can improve returns even if it means decreased risk-taking. This is what Howard Marks (another investor that I hold in very high regard) wrote in one of his famous memos:
It’s essential to recognize that protection from volatility generally isn’t a free good. Reducing volatility for its own sake is a suboptimizing strategy: It should be presumed that favoring lower-volatility assets and approaches will – all things being equal – lead to lower returns.
When I first started out investing seriously (buying individual stocks, I dabbled in China funds before), I was still a professional poker player. I had some winnings above what I could profitably put at risk at the tables and figured it would be good to put it to productive use in the markets. Reading up on investing, things clicked pretty quickly, as there are many analogs between gambling and investing. I’m not always sure there are differences, except you are supposed to do one of them in a suit.
I started out with the assumption that the efficient market hypothesis was correct and that the message many regulating bodies are spreading to this day: “with increased returns, come increased risks,” is true.
After all, a few guys got a Nobel Prize for cooking it up, and it was pretty much gospel in the academic community. If you’re unaware of it, it is precious to understand the basic concept. At the same time, I wished I had understood its limitations sooner.
Having a little bit of knowledge can be dangerous in markets. Thinking I got this stock market thing figured out, I quickly devised a strategy.
1) I was going to buy individual stocks (efficient market so stock-picking is impossible but if it isn’t, I figured taking a value approach is free optionality).
2) I was buying high beta stocks because higher risk = higher returns
3) I diversified into twenty stocks or so (because of academic research showing diversification benefits falling off quickly above 20 stocks, I have a different view now)
I ran that portfolio straight into the Great Financial Crisis of ’08. Of course, I got wrecked. At some point, it hurt so much I didn’t open my brokerage account anymore for over a year.
Later I learned there’s a paper called betting-against-beta and there’s a factor called low-volatility investing (great long-term perspective here) that both beat the market. They’re both systematic strategies emphasizing taking less risk and outperforming the market. Don’t take this as a blind recommendation for low-volatility products, as I have reservations about these from time to time.
I’m saying that everyone is competing to squeeze the highest return out of their capital under management. Counterintuitively, you may squeeze more out of your capital by creating a portfolio that’s less risky instead of riskier. Volatility does not equal risk. The value investor community will sometimes argue it has nothing to do with each other. In my opinion, the truth is in between. High volatility is a risk in itself, but its absence does not prove the absence of risk.
I encourage everyone to do the calculations for themselves in a spreadsheet program. It can be an eye-opener. Here are the results of a 10-year time series I ran with different standard deviations. The standard deviations of ~0.05, ~0.1, and ~0.2 correspond with the time series being up 5%, down 5% and so on, up 10%, followed by down 10%, and so on, etc.
| Average return per year | Standard deviation | CAGR |
| 0.00% | 0.05270462767 | -0.13% |
| 0.00% | 0.1054092553 | -0.50% |
| 0.00% | 0.2108185107 | -2.02% |
As you can see, at the same average return, the compound growth rate decreases with higher standard deviations.
What if you do the same thing for positive average returns? Here’s another table for a 10-year time series:
| Average return per year | Standard deviation | CAGR |
| 10.00% | 0.2108185107 | 8.17% |
| 12.00% | 0.05270462767 | 11.89% |
| 15.00% | 0.3689323937 | 9.54% |
| 20.00% | 0.632455532 | 3.92% |
| 25.00% | 0.790569415 | 0.00% |
Note how, contrary to what Buffett argued, the CAGR at 12% with a standard deviation of 5% is higher than the CAGR of a 15% average return with a standard deviation of 0.36.
To put the above into context, here’s an overview of several asset classes and Morningstar’s expected returns as well as the listed standard deviation:
|
Asset Class |
Return Data Series (Benchmark) |
Expected Return |
Standard Deviation |
|
U.S. Large-cap Growth Stocks |
Russell Top 200 Growth |
8.25% |
21.82% |
|
U.S. Large-cap Value Stocks |
Russell Top 200 Value |
9.60% |
17.47% |
|
U.S. Mid-cap Growth Stocks |
Russell Midcap Growth |
10.41% |
23.22% |
|
U.S. Mid-cap Value Stocks |
Russell Midcap Value |
12.48% |
19.17% |
|
U.S. Small-cap Growth Stocks |
Russell 2000 Growth |
9.98% |
27.62% |
|
U.S. Small-cap Value Stocks |
Russell 2000 Value |
13.29% |
22.46% |
|
Non-U.S. Dev Stocks |
MSCI EAFE |
10.02% |
20.62% |
|
Non-U.S. Emrg Stocks |
MMSCI Emerging Mkts |
14.35% |
29.65% |
|
U.S. Investment Grade Bonds |
Barclays US Agg Bond TR USD |
3.36% |
7.08% |
|
U.S. High-Yield Bonds |
Barclay US Corporate High Yield TR USD |
7.37% |
11.33% |
|
Non-U.S. Dev Bonds |
Citi WGBI NonUSD USD |
3.08% |
11.22% |
|
Cash |
Citi Treasury Bill 3 Mon USD |
0.97% |
1.67% |
|
Commodities |
DJ UBS Commodity TR |
4.48% |
17.86% |
|
U.S. Real Estate |
FTSE NAREIT-Equity |
8.92% |
23.55% |
Conclusion
My takeaway from all of this has been that I want to aim for returns as high as the market will give me, given my skill set, while being somewhat consistent from period to period. Usually, this is looked at yearly by long-term investors, but it makes sense that if you want to control annual volatility, you’ll have to limit quarterly/monthly/etc. volatility to an extent. In future articles, I’ll talk about the practical ways I try to achieve my goals.
Be the first to comment