

Sundry Photography
In this analysis of Taiwan Semiconductor Manufacturing Company Limited, TSMC (NYSE:TSM), we examine the company’s position following the increasing tensions between the US and China in recent years. We believe TSMC is best positioned to benefit from both the US and China markets, despite the rising tension. To analyze this further, we first determined whether TSMC benefits from US and China in terms of subsidies, exemptions, and trade. We next analyzed the company’s supply chains to identify how integrated it is with US and China companies. Lastly, we examined the company’s competitive strengths in the semicon foundry market, in terms of market share, technological prowess, pricing power, advanced packaging, and capacity.
To illustrate the significance of the US and China, both economies are the two largest in the world with the US being 1st (GDP of $23 tln) followed by China as 2nd (GDP of $17.7 tln) in 2021. Furthermore, the US has the world’s largest stock market by country (market capitalization of $46 tln) in 2022, followed by China in second place (market cap of $10.7 tln). In terms of military strength, the US has the highest military expenditures at $801 bln and accounting for 38% of global military spending in 2021, whereas China is second with $293 bln or 14% of global military spending in 2021.
Moving on to demographics, China has the largest population at 1.4 bln while the US is third at 337 mln in 2021. In terms of Taiwan specifically, both US and China are its top trading partners with China as its largest country by exports (27.7%) followed by the US in second place (14.6%).
To illustrate the importance of both countries in the semiconductor industry, we present several charts below:
Semiconductor Sales Share by Region
WSTS, Omdia, SIA, Khaveen Investments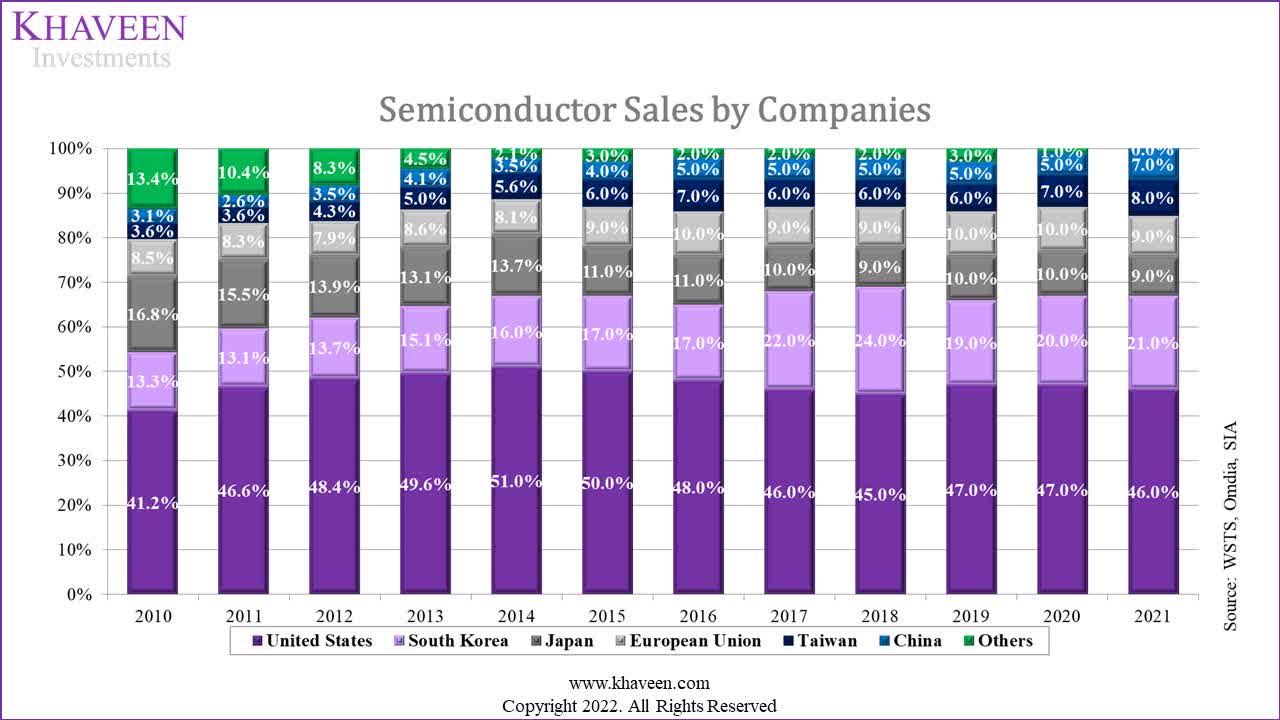
Based on the chart of the industry sales breakdown by companies, the US accounts for 46% of the global industry sales thus highlighting the dominance of US-based semicon firms. China while only accounting for 7% of the industry sales, grew rapidly since 2010, more than doubling its share from 3.1%.
Semiconductor Manufacturing Capacity by Region
BCG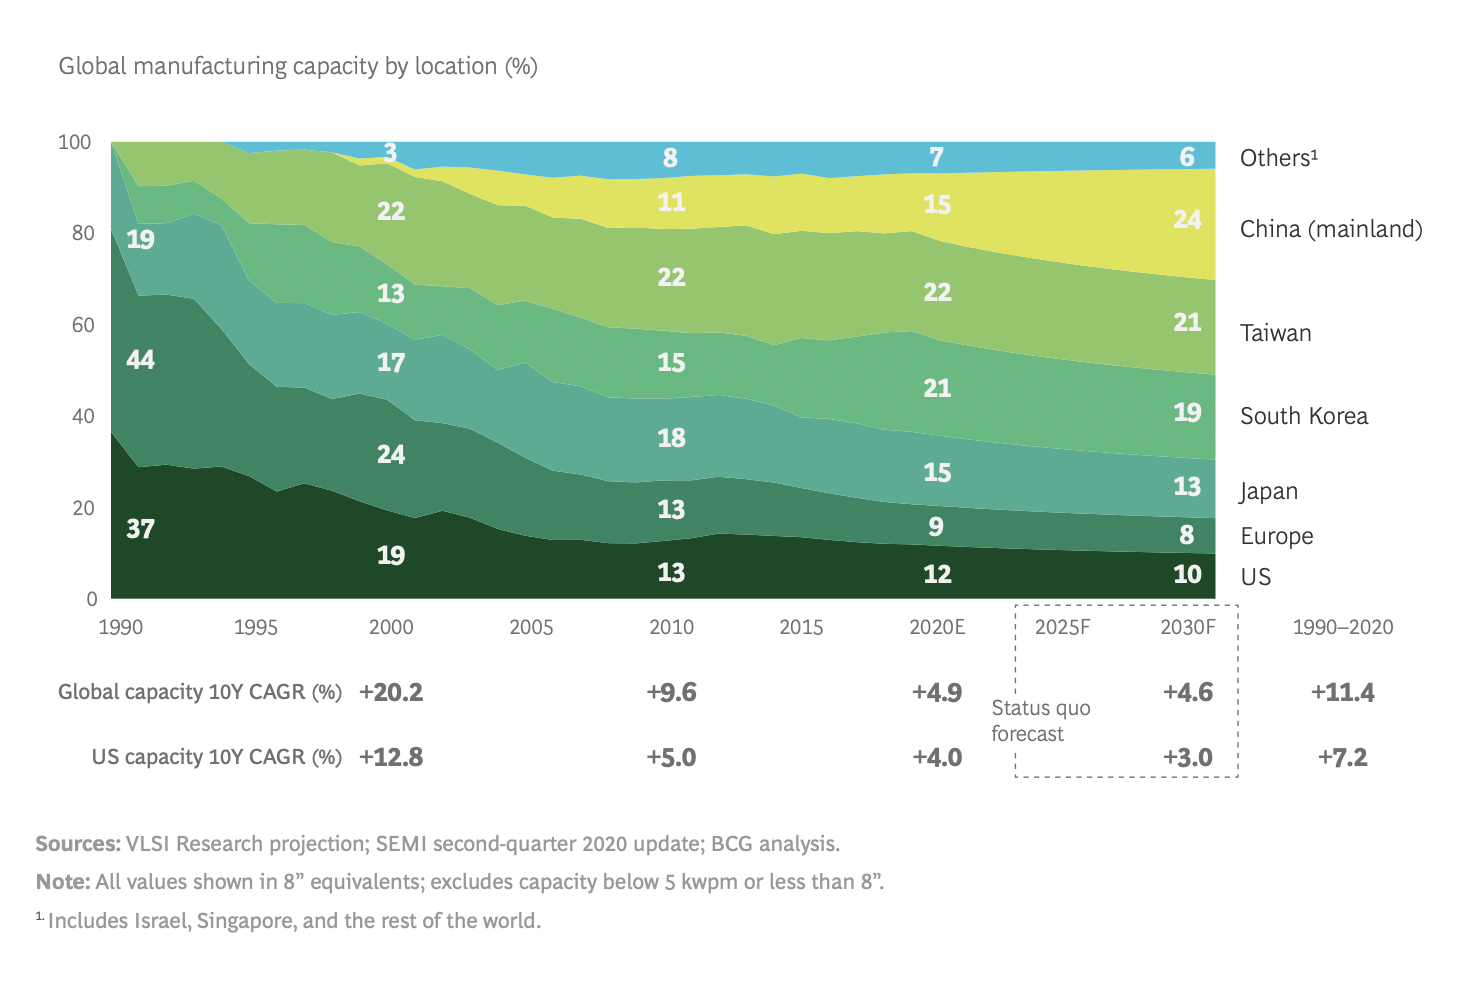
In terms of manufacturing capacity by location, China grew rapidly from just a share of 3% in 2020 to an estimated 15% in 2020 and is forecasted by BCG to increase to a share of 24% by 2030. On the other hand, the US share of global manufacturing had decreased from 37% and is expected to reach 10% by 2030 but still ahead of Europe due to higher costs in the US by 30% compared to Taiwan and South Korea and 50% compared to China for semicon fabs.
Semiconductor Sales by Customer Location
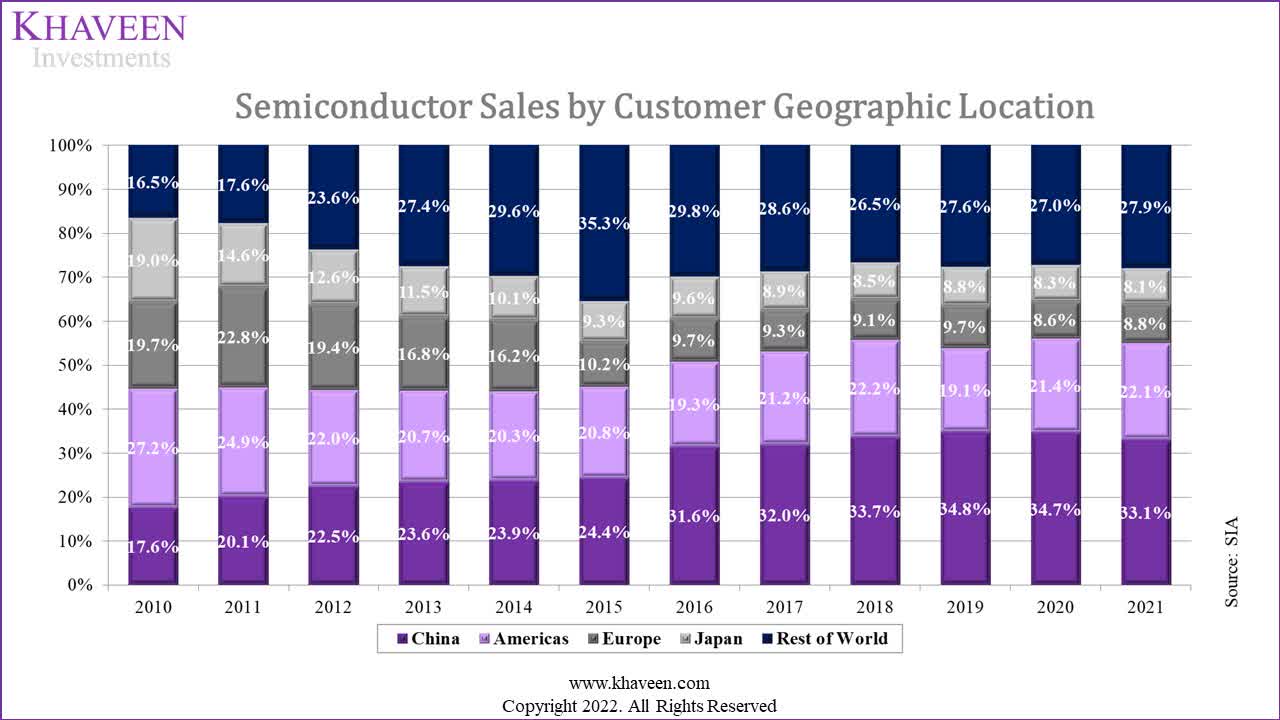
Additionally, in terms of the industry sales breakdown by customer geographic location, China is the largest market and its share grew rapidly in the period from 17.6% to 33.1% in 2021. This coincides with the rise of manufacturing activity in China from a share of 8.7% of global manufacturing output in 2004 to 30% in 2022. This is followed by the US as the second largest market with a share of 22.1% in 2021.
Therefore, we believe this highlights the importance of both US and China in the semiconductor industry, which in turn affects the world’s largest semiconductor foundry: TSMC.
Political Sweet Spot
Taiwan is an island located off Mainland China and has been run independently by a democratically elected government according to the Council on Foreign Relations. Tensions between China and the US relating to Taiwan had increased over the years. The Chinese government maintains the One China principle with the “PRC as the only legitimate government of China” and “seeks Taiwan’s eventual unification with the mainland”. The US on the other hand acknowledges the One China principle but “rejects any use of force to settle the dispute” from the Taiwan Relations Act.
Taiwan has become an important U.S. partner in trade and investment, health, semiconductor and other critical supply chains, investment screening, science and technology, education, and advancing democratic values. – US Department of State
US President Joe Biden was quoted when asked if the US would defend Taiwan in the event of an invasion to which he replied…
Yes, if in fact, there was an unprecedented attack.
However, Taiwan’s DPP leader has a “status quo” stance of “neither unification nor independence and close ties with the United States”.
Despite the escalation of the US-China trade war in 2018 with the US imposing tariffs on Chinese goods, Taiwan was the largest beneficiary of trade diversion according to the UN Conference on Trade and Development (UNCTAD) as it “saw an increase of US$4.2 billion (NT$127.8 billion) in exports to the U.S.” on products ranging from machinery, communications equipment and chemicals.
Thus, we believe Taiwan to be in a political sweet spot as we view both major nations as neither seeking to directly provoke Taiwan but competing for it as China seeks to unify with the mainland and the US seeks to maintain the status quo as it views Taiwan as an important partner.
Furthermore, to identify the impact on TSMC, we examined whether it benefits from government assistance from US and China in terms of subsidies and exemptions it had benefitted from with the US sanctions against China as well as from the US-China trade war.
Subsidies
In 2020, TSMC announced its new $12 bln fab expansion in Arizona, US, expected to be completed by 2024. The company stated that “subsidies will be a key factor in TSMC’s decision to set up a fab in the US”. In 2022, the US government introduced the $52 bln CHIPS Act with TSMC a beneficiary of the federal government assistance program through subsidies and tax incentives for its expansion in Arizona. Furthermore, in terms of state assistance, the company did also receive financial incentives from Phoenix including $200 mln for infrastructure development such as roads and sewers and traffic lights costing $500,000.
In China, the government had set up the $150 bln National IC Fund to spur the growth of its domestic production of semiconductors as well as its Made in China 2025 plan to become an “advanced manufacturing leader” including semiconductors. According to the Information Technology & Innovation Foundation, local firms such as SMIC, Tsinghua Unigroup and Hua Hong benefitted significantly compared to foreign companies with SMIC having the highest state subsidies as a % of revenue of more than 40%. Though, TSMC also benefitted with under 3% of state subsidies of revenues. When TSMC announced its expansion in Nanjing, China, it stated that its $3 bln investment would capitalize on Chinese subsidies.
Exemptions
As a beneficiary of the US CHIPS Act, TSMC will receive subsidies for its US expansion. However, the US CHIPS Act 2022 includes pledges by companies that receive subsidies not to expand in China. In 2022, the US government imposed new restrictions on semicon equipment exports to China by requiring licensing to be obtained. However, TSMC along with other non-US companies received short-term exemptions from the US government’s restrictions on equipment exports for their China expansion. For example, TSMC received a 1-year exemption for equipment sales for its new Nanjing fab in China.
The one-year authorization that we received cover the Nanjing facility. – Wendell Huang, CFO
We believe this highlights that the US government has given time for companies such as TSMC to apply for licensing to obtain US equipment exports in China. In addition, “licenses to Chinese chipmakers will face a presumption of denial”. We believe this supports that the US does not view TSMC as a Chinese company, as it was given the exemption and could apply the licensing.
Trade War
In 2018, the US government implemented tariffs on various Chinese goods including semiconductors. Furthermore, the SIA estimated that $6.3 bln of semiconductors were included in the tariffs. Thus, we analyzed how TSMC was affected.
|
Companies |
2017 |
2018 |
2019 |
2020 |
2021 |
2020 vs 2018 Growth % |
|
Hua Hong Semiconductor (‘HKD’) (OTCPK:HHUSF) |
6,298 |
7,291 |
7,307 |
7,456 |
12,676 |
|
|
Growth % |
15.8% |
0.2% |
2.0% |
70.0% |
2.3% |
|
|
Semiconductor Manufacturing International (‘HKD’) (OTCQX:SMICY) |
24,498 |
26,334 |
24,835 |
30,597 |
42,803 |
|
|
Growth % |
7.5% |
-5.7% |
23.2% |
39.9% |
16.2% |
|
|
GlobalFoundries Inc (‘USD’) (GFS) |
6,176 |
6,196 |
5,813 |
4,851 |
6,585 |
|
|
Growth % |
0.3% |
-6.2% |
-16.5% |
35.7% |
-21.7% |
|
|
Samsung Foundry (‘USD’) (OTCPK:SSNLF) |
4,600 |
4,656 |
12,267 |
14,054 |
18,796 |
|
|
Growth % |
1.2% |
163.5% |
14.6% |
33.7% |
201.8% |
|
|
United Microelectronics (TWD) (UMC) |
149,285 |
151,253 |
148,202 |
176,821 |
213,011 |
|
|
Growth % |
1.3% |
-2.0% |
19.3% |
20.5% |
16.9% |
|
|
TSMC (‘USD’) |
32,900 |
33,697 |
35,737 |
47,632 |
57,231 |
|
|
Growth % |
2.4% |
6.1% |
33.3% |
20.2% |
41.4% |
Sources: Company Data, Trendforce, Khaveen Investments
As seen in the table, all companies experienced slower growth in 2019 following the tariffs except for TSMC and Samsung. Though for Samsung, we previously highlighted that “it spun off its System LSI division to provide foundry services according to Trendforce” which resulted in a surge in revenue for that year. However, in 2019, the semicon industry experienced a slowdown as the market sales declined by 12.1% based on SIA. Moreover, in 2021, all companies had a surge in growth as the industry experienced a supply crunch with the industry utilization rate reaching over 95% in December 2020. Thus, we compared the growth between 2018 and 2020 where TSMC witnessed the highest growth (excluding Samsung) at 41.4% followed by UMC at 16.9%.
Therefore, we believe this could indicate that TSMC benefitted from the tariffs on Chinese goods amid the US-China trade war with its superior growth rate of 41.4% during the period due to the exemption of the company from the tariffs and because of the trade diversion to Taiwan which was the largest beneficiary according to UNCTAD.
Conclusion: Political Sweet Spot
All in all, we believe TSMC is in a political sweet spot. Despite the US-China tensions, TSMC had benefitted from government assistance in the form of subsidies from the US with the CHIPS Act and state subsidies for its Arizona fab expansion. Besides that, the company also benefitted from Chinese subsidies as it expanded in Nanjing. Moreover, despite the US restrictions on semicon equip sales to China, TSMC had benefitted from the 1-year exemption which we believe provides time for it to obtain licensing to continue purchasing equipment for its China expansion and highlight its positive position, as the US does not view it as a Chinese company. Lastly, amid the US-China trade war which included tariffs on Chinese semiconductors, we believe TSMC’s superior growth to competitors indicates it benefitted from the imposed tariffs on Chinese competitors.
Integrated Supply Chain Across Both Sides
In the case of TSMC, the company’s management highlighted from its latest earnings briefing that the company views every customer to be important and will do business with all customers in compliance with regulations.
I would like to say that every region is important to TSMC. However, let me say that, under the condition of work compliance with all the rules and regulations, TSMC will continue to serve all the customer all over the world. That’s our position. – C. C. Wei, CEO
Furthermore, although TSMC is based in Taiwan, we analyzed the interconnectivity of the company’s supply chains on a global scale, especially between US and China.
Customers
From its annual report, TSMC…
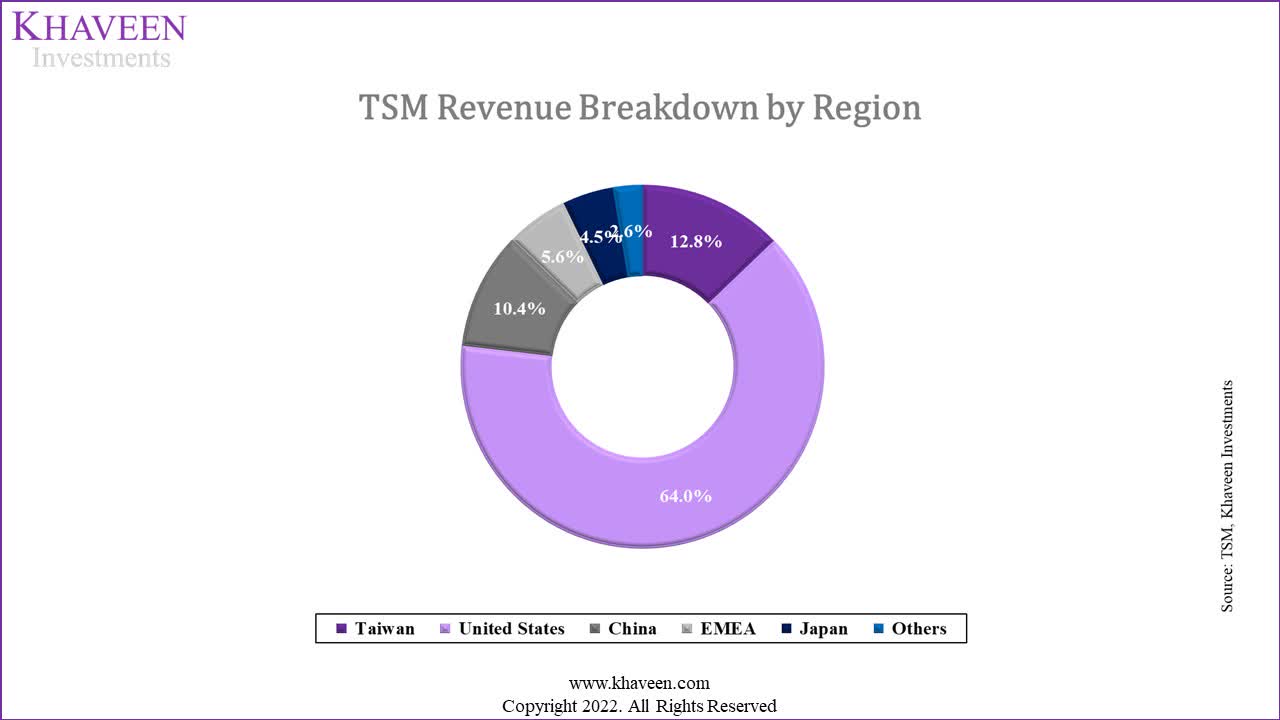
categorized the net revenue mainly based on the countries where the customers are headquartered.
Based on the chart, companies headquartered in the United States contributed 64% to TSMC’s revenue in 2021, due to customers like Apple, AMD and Qualcomm. Taiwan comes in second, contributing 12.8% to TSMC’s revenue whereas China is third, contributing 10.4% of TSMC’s revenue.
|
TSMC Largest Customers |
2021 Revenue ($ mln) |
% of TSMC Revenue |
Country |
|
Apple (AAPL) |
14,840 |
25.9% |
US |
|
MediaTek (OTCPK:MDTKF) |
3,319 |
5.8% |
Taiwan |
|
AMD (AMD) |
2,821 |
4.9% |
US |
|
Qualcomm (QCOM) |
2,232 |
3.9% |
US |
|
Broadcom (AVGO) |
2,158 |
3.8% |
US |
|
Nvidia (NVDA) |
1,620 |
2.8% |
US |
|
Sony (SONY) |
1,454 |
2.5% |
Japan |
|
Marvell (MRVL) |
796 |
1.4% |
US |
|
STMicro (STM) |
790 |
1.4% |
Switzerland |
|
ADI (ADI) |
607 |
1.1% |
US |
|
Intel (INTC) |
481 |
0.8% |
US |
Source: Statista, Bloomberg, DigiTimes, Khaveen Investments
Apple is by far TSMC’s biggest customer contributing 25.9% of its revenues. The top 10 customers of TSMC contribute approximately 54.4% of its total revenues.
Major Suppliers
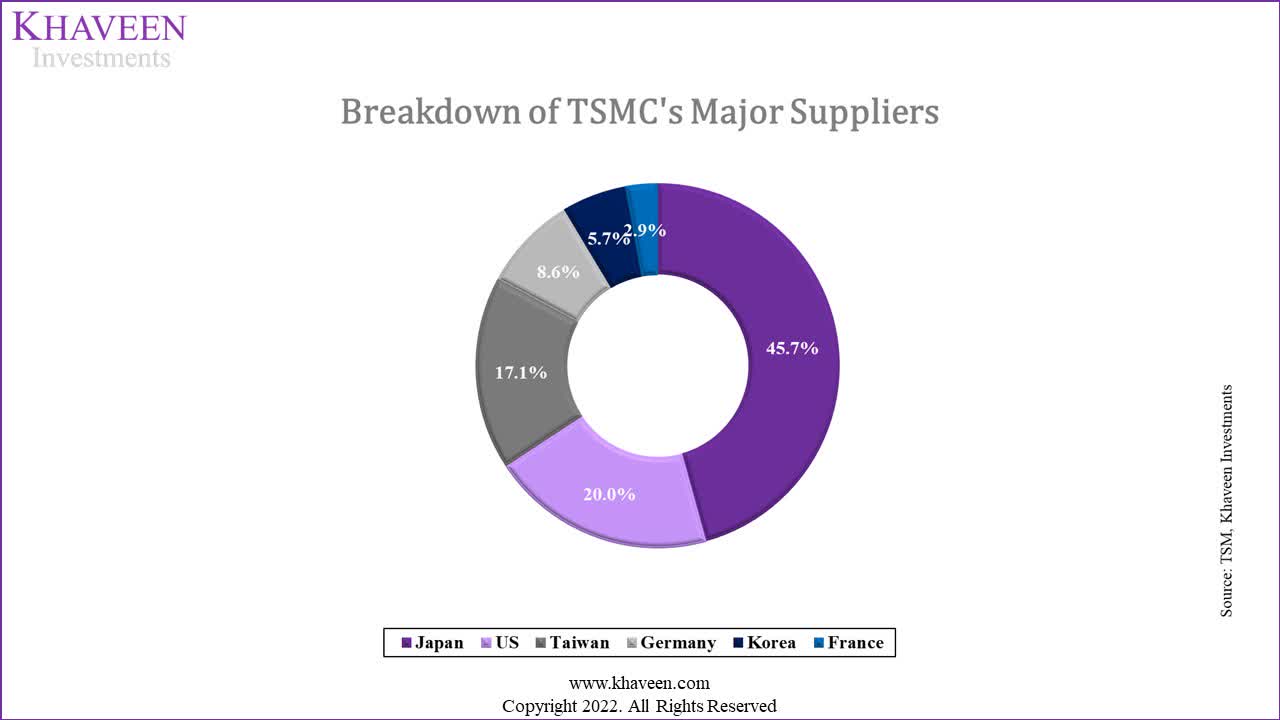
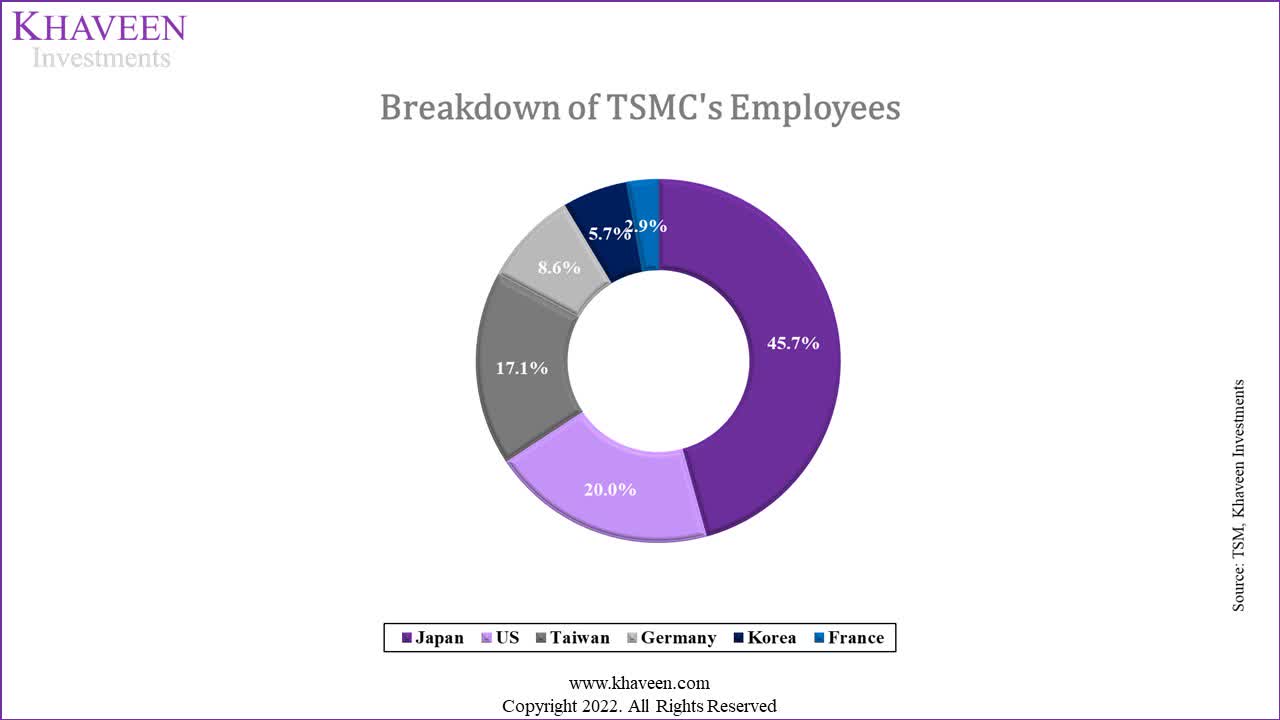
From its annual report, Japanese companies made up about 45.7% of the major suppliers of TSMC with products ranging from raw wafers, chemicals, lithography materials and gases. Coming in second is the US making up 20% of the companies followed by Taiwan with 17.1%.
Manufacturing Capacity
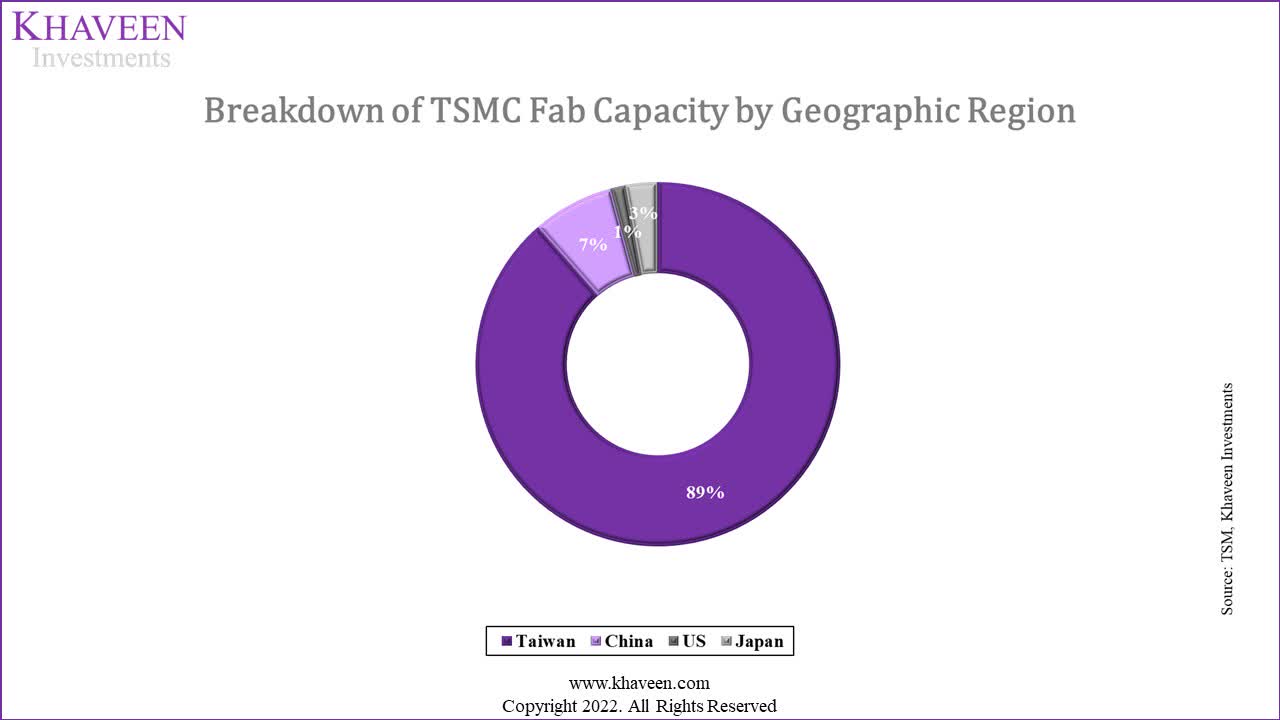
In terms of TSMC’s manufacturing sites, 75% of TSMC’s fabs are located in Taiwan, with 2 each in the US and China, and 1 new fab still under construction in Japan. Moreover, in terms of capacity by geographic region, Taiwan has the highest share of the company’s manufacturing capacity at 89%. This is followed by China at 7%, Japan at 3% and the US at 1%.
Employees
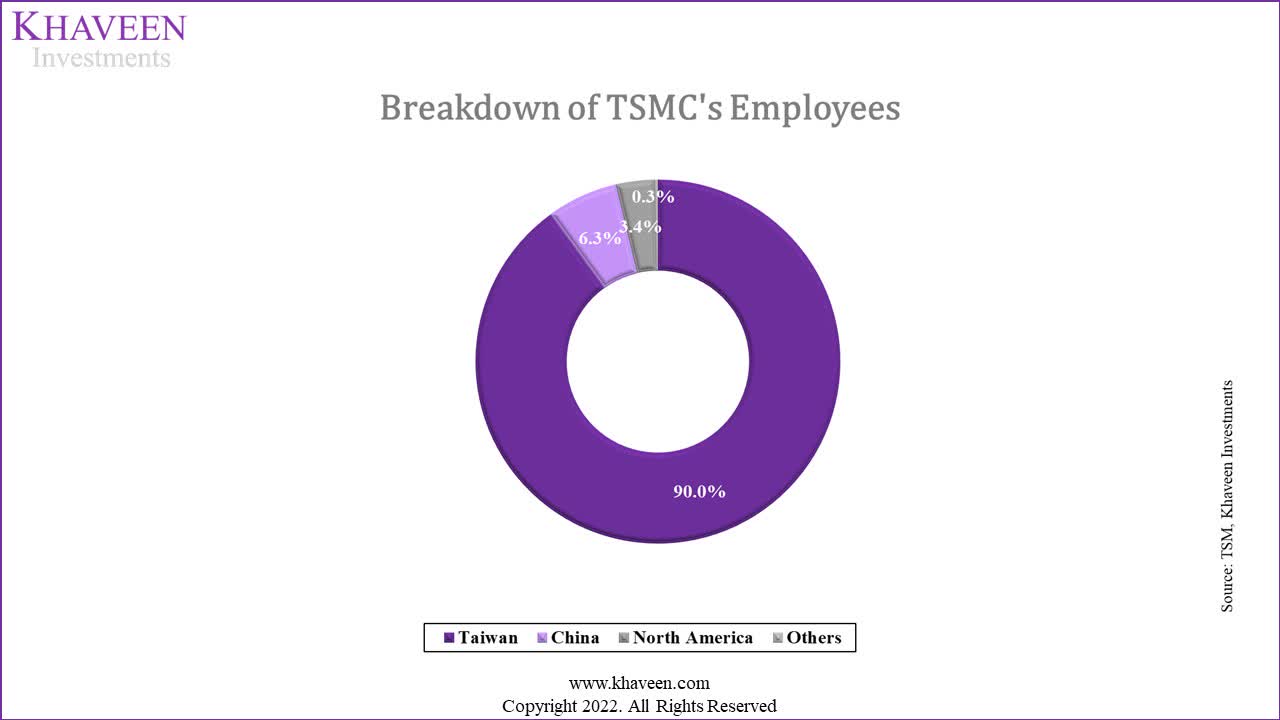
Lastly, based on the chart of the employee breakdown of TSMC by geographic region, 90% of the company’s employees are located in Taiwan. This is followed by China at 6.3% and North America at 3.4%.
Conclusion: Integrated Supply Chain Across Both Sides
|
Factor |
US |
China |
Taiwan |
|
Customers |
64% |
10.4% |
12.8% |
|
Major Suppliers |
20% |
– |
17.1% |
|
Manufacturing Capacity |
1% |
7% |
89% |
|
Employees |
3.4% |
6.3% |
90% |
Source: Khaveen Investments
Therefore, TSMC’s major geographic regions by customers are the US, its largest at 64% of revenue followed by China at 3rd representing 10.4% of revenue. Moreover, while Japan represents the largest country in terms of its major suppliers, the US is 2nd at 20% of its total number of major suppliers. By manufacturing footprint, the majority of TSMC’s capacity by region is in Taiwan at 89% followed by China at 7% and the US at 1% of total capacity but the company is expanding production in both countries. Finally, both China and US also play a significant role in TSMC in terms of where its employees are based as seen in the chart above. Based on these factors including customers, suppliers, manufacturing sites and employees, we believe the company’s exposure to both US and China for each of these factors highlights the company’s highly integrated supply chain with both nations while maintaining enough local Taiwanese integration to remain independent
Complete Market Dominance
As covered in our previous analyses, we identified TSMC’s strength as the market leader in the semiconductor foundry sub-industry. We determined TSMC’s market positioning based on its market share, technology in terms of manufacturing process technology, capacity, and ASP, to establish whether TSMC is the undisputed market leader in the semicon foundry sub-industry.
Market Share
Company Data, Trendforce, Khaveen Investments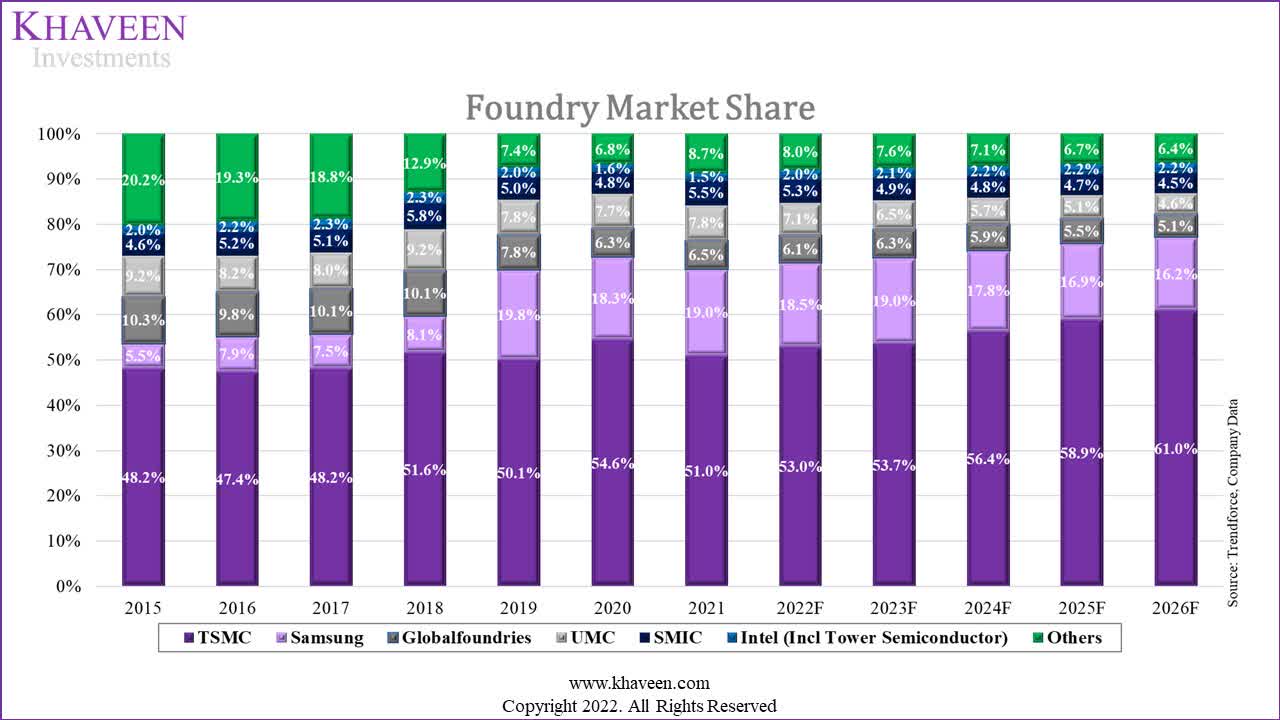
Since 2015, the foundry market share had consolidated among the top 5 foundries which are TSMC, Samsung, GlobalFoundries, UMC and SMIC. TSMC has further cemented its position as the clear market leader with a share of 51% in 2021. This is followed by the number two player, Samsung, at 19% in 2021. Whereas, GlobalFoundries has been overtaken by UMC to be the 3rd largest foundry with a 7.8% market share. Based on our forecast, we expect TSMC to continue gaining share driven by superior revenue growth at a 5-year forward average of 21.3% supported by average wafer shipment and ASP growth of 8.7% and 12.3% respectively, compared to the foundry market forecasted growth rate of 20% according to IC Insights.
Process Technology
IC Insights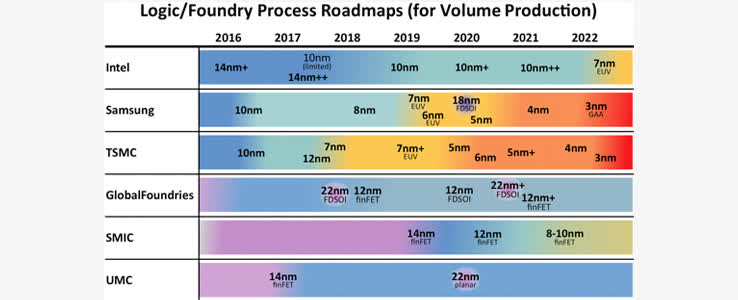
From the chart above, TSMC continues to lead in terms of process technology with its N3 process in 2022 as well as Samsung which had rolled out 3nm chips in the first half of 2022 using the Gate-All-Around transistor architecture. Beyond 2022, Apple is also preparing to use TSMC’s 2nm chips and is expected to be commercially available in late 2025 according to DigiTimes. Overall, we believe this highlights TSMC’s technological leadership with its advanced process technology and roadmap.
We still believe the most important is in is a technology leadership, manufacturing and our customer trust. And so in different locations, manufacturing or whatever, we still think that technology leadership is the most important thing. And so that’s our strategy. We make it simple, the technology, manufacturing and customer trust. – C.C. Wei, CEO
Wafer Capacity
|
Company |
Annual Wafer Capacity (‘000s) (12-inch equivalent) |
|
TSMC* |
14,179 |
|
GlobalFoundries |
2,228 |
|
UMC** |
4,201 |
|
SMIC** |
3,312 |
|
Samsung Foundry** |
5,313 |
*2021 wafer shipments
**8-inch wafers converted to 12-inch equivalent
Source: Company Data, DigiTimes, Khaveen Investments
In terms of wafer manufacturing capacity, TSMC had the highest capacity for 12-inch equivalent wafers in 2021 at 14.2 mln wafers per year. This is followed by Samsung and UMC at 5.3 mln and 4.2 mln wafers per year respectively. Thus, this highlights TSMC’s advantage with the highest wafer manufacturing capacity which is unsurprising as the company with the highest market share.
Wafer Pricing
|
Company |
Average Revenue per 12-inch equivalent Wafer ($) |
|
TSMC |
3,550 |
|
GlobalFoundries |
2,774 |
|
UMC |
1,828 |
|
SMIC |
1,643 |
|
Samsung Foundry |
3,538 |
Source: Company Data, DigiTimes, Trendforce, Khaveen Investments
Moreover, to compare the wafer pricing of the foundries, we calculated each company’s revenue in 2021 by their wafers. Based on the table, TSMC had the highest average revenue per wafer at $3,550. Samsung and GlobalFoundries had the next highest average revenue per wafer of $3,538 and $2,774 respectively. Thus, we believe this highlights TSMC’s superior wafer pricing as wafers produced with more advanced nodes command higher pricing according to data from IBS Research.
Advanced Packaging
Yole Development, Khaveen Investments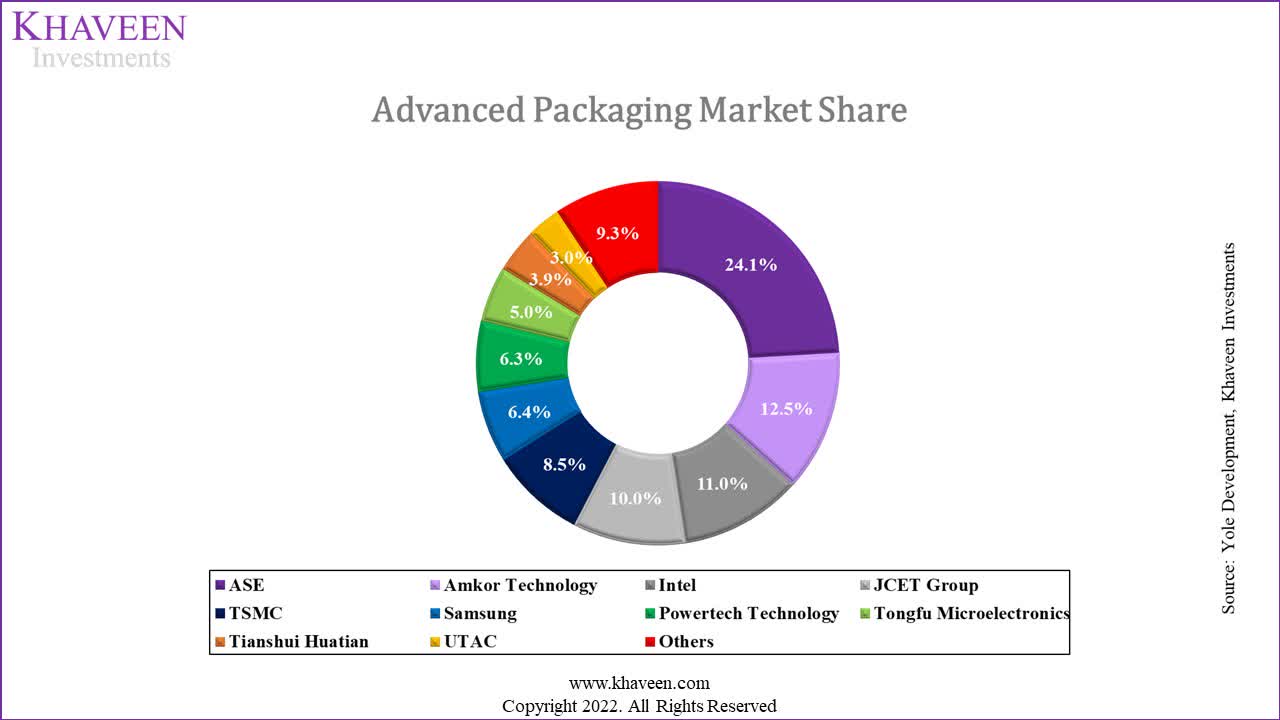
Besides wafer fabrication, TSMC is also involved in the backend with its advanced packaging business segment. Based on the market share chart above, TSMC had the largest share as a pure-play foundry of 8.5% in the 2021 advanced packaging market. In our previous analysis, we identified TSMC’s “advanced packaging strength compared to competitors”. For example, according to WCCF Tech, one of the factors for Apple choosing TSMC over Samsung in the past was its “advanced packaging techniques through its Integrated Fan Out(InFO) approach”. Thus, we believe its advanced packaging business further builds on to TSMC’s foundry strengths.
Conclusion: Complete Market Dominance
Overall, we believe TSMC continues to remain the undisputed foundry leader in the semicon market. This is as it leads in terms of market share of 51% in 2021, more than double that of Samsung and we expect it to continue gaining share with superior revenue growth. Moreover, we believe TSMC has the technological leadership with its advanced process technology and roadmap with the expected 2nm chips by 2025. In addition, compared to competitors, TSMC has the highest capacity (14.18 mln per year) and wafer pricing ($3,550). On top of that, the company is the largest foundry in the advanced packaging market and we believe its advanced packaging builds on its foundry strengths over competitors.
Risk: Geopolitics
One of the risk factors affecting TSMC is geopolitical risk. As explained in the first point, Taiwan is claimed by the PRC and one of the possible scenarios is an invasion of the island by China. According to TSMC’s Chairman, the company is highly integrated with the global supply chain and stated that any invasion would not allow TSMC to continue operating.
Nobody can control TSMC by force. If you take a military force or invasion, you will render TSMC factory not operable, – Mark Liu, TSMC Chairman
Additionally, Bloomberg stated that the US government was preparing contingency plans for the evacuation of TSMC staff. That said, the US Secretary of Defense does not believe that China would likely invade Taiwan in the imminent future.
FP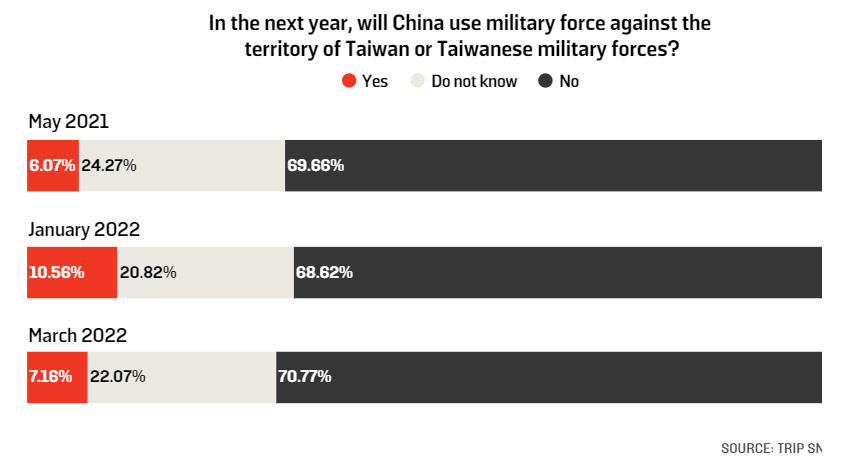
Furthermore, according to surveys by the William & Mary’s Global Research Institute, it found that only 7% of international relations experts at various academic institutions in the US believed that an invasion by China would happen in the next year compared to 71% who believed that it would not occur. Overall, we believe the event of a military conflict would pose a threat to TSMC but could be unlikely to occur according to William & Mary’s Global Research Institute and the US Secretary of Defense.
Valuation
In the table below, we forecasted TSMC’s total revenue growth including wafer, packaging and other revenue from our previous analysis of TSMC. For 2023, we updated our wafer forecast for its ASP growth to be between 3% to 6% (4.5%) based on the reports of TSMC planning to raise its pricing by 6% for 12-inch wafers and 3% to 5% for 8-inch wafers and based it on a 5-year average of 11.3% beyond 2023 but tapered down by 1% per year as a conservative estimate. Based on the table, we see TSMC’s 5-year forward revenue growth rate of 21.3% compared to 21.4% previously.
|
TSMC Revenue Projections ($ mln) |
2021 |
2022F |
2023F |
2024F |
2025F |
2026F |
|
Wafer Revenue |
50,341 |
68,646 |
79,044 |
96,160 |
115,100 |
135,691 |
|
Growth % |
20.0% |
36.4% |
15.1% |
21.7% |
19.7% |
17.9% |
|
Others |
2,761 |
3,173 |
3,646 |
4,190 |
4,815 |
5,533 |
|
Growth % |
34% |
14.9% |
14.9% |
14.9% |
14.9% |
14.9% |
|
Estimated Packaging Revenue |
4,129 |
4,736 |
5,432 |
6,231 |
7,147 |
8,198 |
|
Growth % |
14.7% |
14.7% |
14.7% |
14.7% |
14.7% |
14.7% |
|
Total |
57,231 |
76,555 |
88,123 |
106,581 |
127,062 |
149,422 |
|
Total Growth % |
20.2% |
33.8% |
15.1% |
20.9% |
19.2% |
17.6% |
Source: TSMC, Yole Development, Khaveen Investments
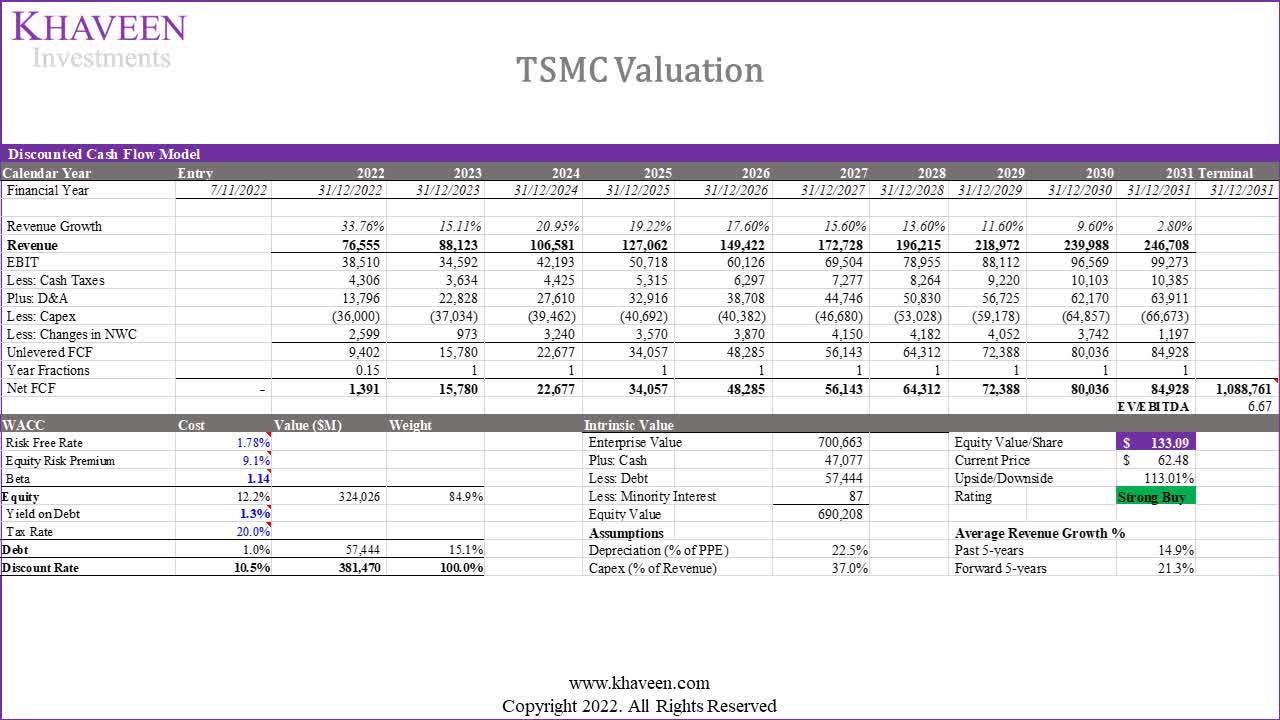
To value the company, we continued to use a DCF analysis as we expect the company to continue to have positive FCFs going forward. For its terminal value, we based it on the average foundry EV/EBITDA of 6.67x.
SeekingAlpha, Khaveen Investments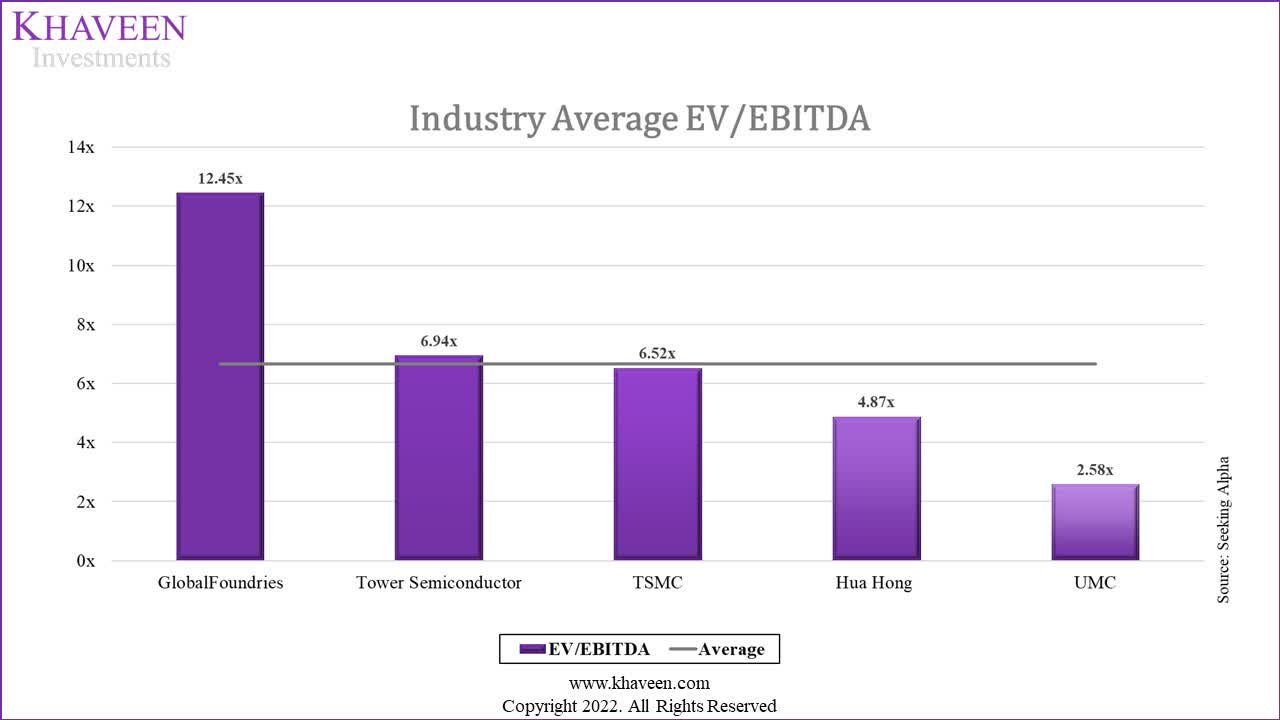
Based on a discount rate of 10.5% (company’s WACC), our model shows its shares are undervalued by 113%.
Verdict
Despite the rising US-China tensions, we believe TSMC is in a political sweet spot as it capitalizes on both sides benefitting from government assistance from both US and China with its expansions in Nanjing and Arizona through subsidies. Moreover, we believe its 1-year exemption from the US semicon equipment ban highlights that the company is not treated as a Chinese company. Also, we believe this is indicated as the company had superior growth to competitors amid the US-China trade war with tariffs imposed on Chinese semiconductors.
We believe TSMC’s supply chain is highly integrated with both US and China. The locations of its customers, suppliers, manufacturing fabs, and employees, are all heavily integrated across the US and China.
Lastly, we believe TSMC continues to remain the undisputed foundry leader in the semicon industry with the highest market share of 51% in 2021, and we expect it to continue gaining share with superior revenue growth. Moreover, we believe its position is supported by its technological leadership with advanced process technology and a 2nm roadmap by 2025. Compared to competitors, TSMC has the highest capacity (14.18 mln per year) and wafer pricing ($3,550). On top of that, the company is the largest foundry in the advanced packaging market and we believe its advanced packaging builds on its foundry strengths over competitors.
Our valuation model indicates a lower price target of $133.09 compared to our previous analysis of $157.01 as the foundry average EV/EBITDA had declined from 8.18x to 6.67x. This still results in an upside of 113%, as its stock had declined by 25% since our last coverage. Thus, we maintain our Strong Buy rating for the company.
“Editor’s Note: This article was submitted as part of Seeking Alpha’s Top Ex-US Stock Pick competition, which runs through November 7. This competition is open to all users and contributors; click here to find out more and submit your article today!”
Be the first to comment