

rocks3/iStock Editorial via Getty Images
T-Mobile US, Inc. (NASDAQ:TMUS) represents the first mobile carrier in terms of 5G coverage share (310 million people and 94% of Americans) and the second wireless communication services provider in the United States. It also represents a strongly growing company in terms of Revenue and EPS.
The growth also occurred through acquisitions such as that of Sprint (2020) whose final migration will take place in 2023. These mergers also contributed in 2022 to an increase in general expenses such as those of services, and this led to a contraction in the operating margin. The company expects to be able to obtain important synergies in terms of supplement capacity but above all in terms of cost savings (with the decommissioning of redundant sites).
We will probably be able to see these results in the next few quarters. In the meantime, we are also recording a slowdown in revenue growth (2022) and above all a downtrend in Capital Turnover and ROCE.
TMUS is generating high Operating Cash Flow (2022 expected $16.5B) and is investing everything in growth (assets and also share repurchase). The market is potentially very competitive but also very broad and with further growth opportunities. This, therefore, represents, in my opinion, a winning strategy.
In terms of share valuation, it seems that the price is overvalued and the expected return may not be such as to cover the risks in this type of investment. My rate is Hold.
Quick Overview
The company defines itself as the ‘America’s supercharged Un-carrier’ and this implies the wireless vocation of the service delivery methods and also the attention to customer satisfaction.
The corporate mission that today also represents a consolidated reality is to create the best 5G network in America. TMUS revenue is made up of wireless services communication plans but also by devices such as smartphones, tablets, and wearables.
The customers/revenue sectors are divided into two main categories: prepaid and postpaid. These two categories are joined by that of equipment towards wholesale.
Financial & Highlights
Revenue and Profitability
10-Q Form + Author Graph
Looking at the Revenue trend, we can see how this is growing from $45B in 2019 to $80B in 2022 with a compound annual growth rate of 21.2%. This represents a very positive figure in a highly competitive market. However, looking at 2022 (TTM) we can see a halt in growth compared to the previous year (2021).
10-Q Form + Author Graph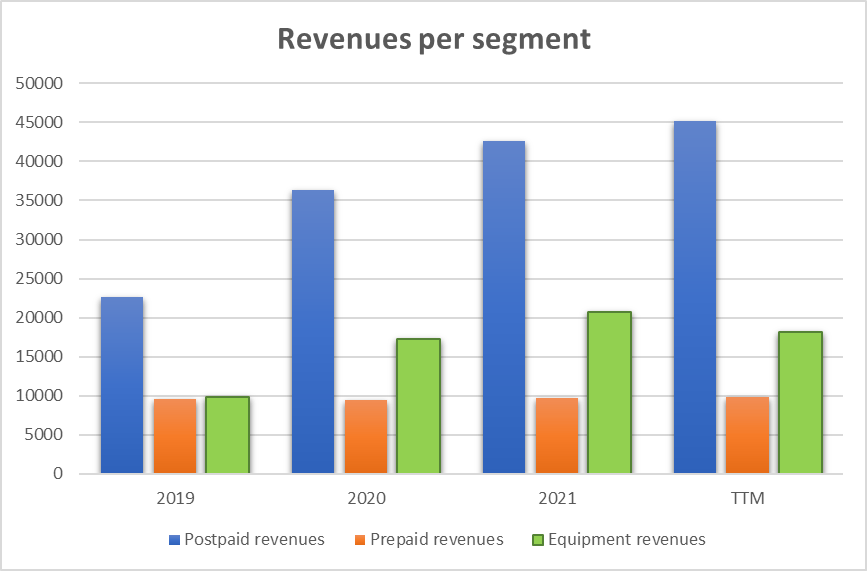
Analyzing the data by business sector, we can see how prepaid have a constant trend while the growth of postpaid is offset by an equal loss of equipment revenue. In particular, the revenue loss was recorded in the revenues from the lease of mobile communication devices which rose from $2,725B in 2021 to $1,184B in 2022 (Q3 Form 10-Q).
In addition, if we look at the graph of revenue over the last year divided by quarter, we can see a general downward trend.
10-Q Form + Author Graph
Returning to the first graph, no less important is the trend (orange line) of the Operating Margin as reported (Form 10-K). The rate has practically halved, going from 12.7% (2019) to 6.1% (2022).
This trend requires an analysis of operating expenses:
10-Q Form + Author Graph
The yellow line represents the total trend of operating expenses which, as expected, has an increasing trend with an incidence that has increased by more than 6 percentage points, going from 87.3% (2019) to 93.9% (TTM). In particular (blue bars) we can see how the cost of service determines the majority of the increase in the total cost.
Reading the 10-Q Form we can understand that the increase in the cost of services is:
“associated with leases and utilities primarily due to the Merger and the continued build-out of our nationwide 5G network, including a new tower master lease agreement in 2020;”
And in the last Q3 10-Q Form The Company expect also:
“As a result of our ongoing restructuring and integration activities, we expect to realize Merger synergies by eliminating redundancies within our combined network as well as other business processes and operations.”
It, therefore, seems that at first the incidence of these expenses has increased precisely to allow the Sprint Corporation Merger (Apr 2020) but in the near future the expectation is that the new synergies created can lead to an important reduction of these costs.
Capital Employment and Profitability
10-Q Form + Author Graph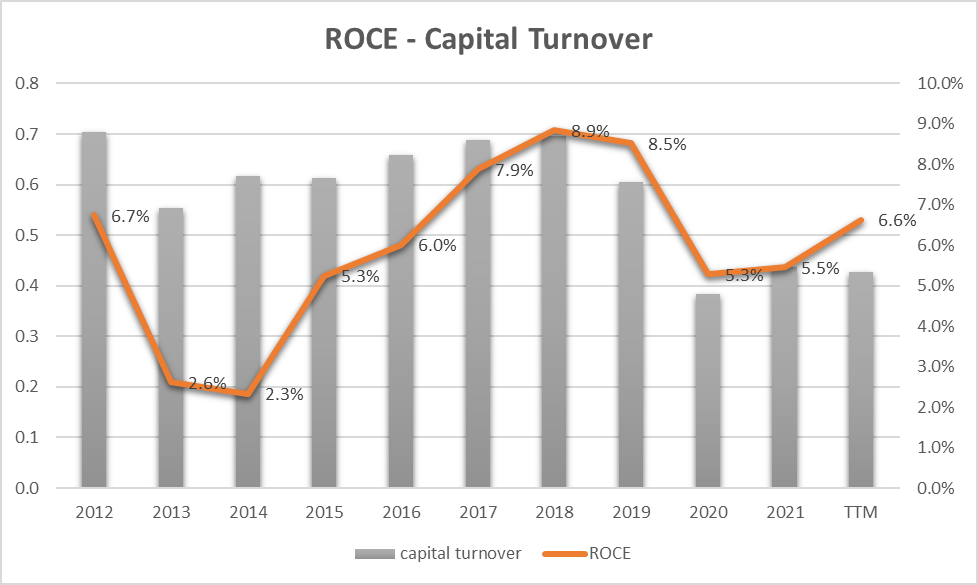
The gray bars represent the Capital Turnover trend (= how many sales are generated as a result of $1 of capital employed). As we can see, the ratio starts from 0.7 in 2012 and drops to 0.4 in 2022. Also in this case, as in the case of operating income, the downward trend is not an excellent sign of the use of capital.
How can this trend be interpreted?
Revenue is growing steadily (over the past 10 years compound annual growth of 15%) but not as much as the capital employed to generate this revenue. It, therefore, appears that the investments made (or the capital employed) at least to date are producing fewer sales than those required to generate an uptrend in capital turnover.
Consequently, ROCE (Return on Capital Employed) also suffers, remaining almost constant from 2012 (6.7%) to today (6.6%).
Cash Flow and CapEx
The Company expects Operating Cash Flow will be 2022 between $16.3 billion to $16.5 billion (up 18% related to 2021). This data represents a great result also as a consequence of the fact that TMUS (Q3 Earnings call).
“have reached an investment-grade rating from all three major agencies, opening access to a much deeper and cost-effective capital pool for the company.”
Management expects also the CapEx will be (2022) at around $13.8B necessary for the implementation of 5G and to continue the successful development of high-speed Internet.
As a result, an estimate of the (2022) Free Cash Flow is around $7.5B (net of merger expenses). This figure represents a growth of approximately 30% on the previous year (2021).
These data represent an excellent performance and allow the company to pursue share buyback strategies (currently 10.9M shares repurchased in 2022) on the one hand, and to invest in new coverage structures on the other as we can hear in the last earnings call:
“I think the other piece we will continue to make, coverage investments. These networks continue to grow. Customer demands continue to grow. We have great growth, as Callie referenced in our business and enterprise space. We need to feed that. We’ve got work to do still in small-town, rural America. So our CapEx profile is feeding both.”
Valuation
EPS Growth Model
Since the company is quite stable in terms of Revenue and EPS growth, I decided to use the EPS growth parameter over the last 10 years as an estimate of future growth. 11.4% is the growth rate (CAGR) of EPS from 2012 ($1.52) to 2022 ($4.47).
The Formula is (by popular investor Benjamin Graham):
Intrinsic value per share = EPS x (8.5 + 2 g)
Where
EPS = earnings per share
g = EPS growth rate = 11.4%
Author Calculation
Example of calculation for 2023:
Intrinsic value per share = EPS x (8.5 + 2 g) = 4.98x(8.5+2×11.4) = $155.75
The last intrinsic value of $267.09 for 2028 underlines an annualized return of 11,2% as the current share price is $141.5.
11.2% is the annualized expected return for the investment in TMUS. It’s not a bad figure in absolute value but it requires great confidence that the EPS growth rate can remain at 11.4% for the next 7 years and this represents an element of risk especially if we look at the operating margin trend.
FCF/Share Model
To define a maximum buying price, I use a formula based on FCF/Share and interest rate.
The formula is:
Maximum buying price = Cash profit per Share/interest rate – 20% (safety discount)
Using the estimates provided by management in the last earnings call, we can identify the company’s total FCF of $7.5B, and by dividing this figure by the number of shares we obtain an estimate of the FCF/share of $5.99.
Interest Rate=inflation Rate = 7.75%
Maximum price before Safety discount = 5.99/7.75%= $79.99
The maximum price at 20% discount = $ 66.66
Under the FCF/Share analysis, it seems that the actual price of $ 141.5 is highly overrated.
Peers Comparison
To compare TMUS with similar companies in terms of market capitalization in the Communication Services sector I have defined the following peers:
• Vodafone Group Public Limited Company (VOD)
• Verizon Communications Inc. (VZ)
• AT&T Inc. (T)
Using Seeking Alpha’s Quant Ratings we have a ‘Strong Buy’ verdict related to the ‘Hold’ rating of the others company.
Seeking Alpha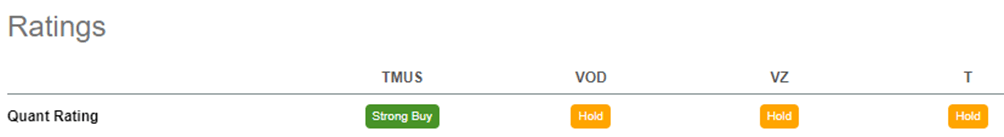
Analyzing the factor grades we can see how TMUS is preferable in terms of Growth and Momentum and reaches an equal rate in terms of Profitability. As also defined in the previous paragraph in terms of Valuation, the company is not the best choice.
Seeking Alpha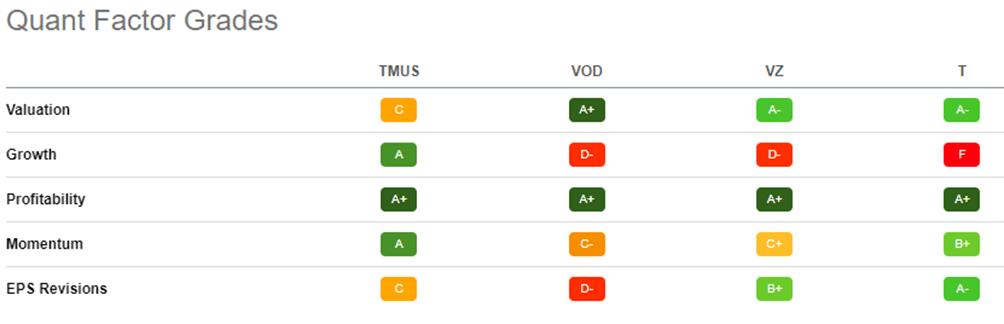
The company is in a growth phase and has yet to reach a certain maturity and stability. Perhaps for this very reason, its price contains a significant part in terms of future growth.
Even looking at the dividend yield, we can see how the other companies have a completely different profile. In the last 4 years, the lowest dividend yield was 4.63%, and the highest was 6.8%. TMUS currently uses all funds for growth and does not pay any dividends.
Seeking Alpha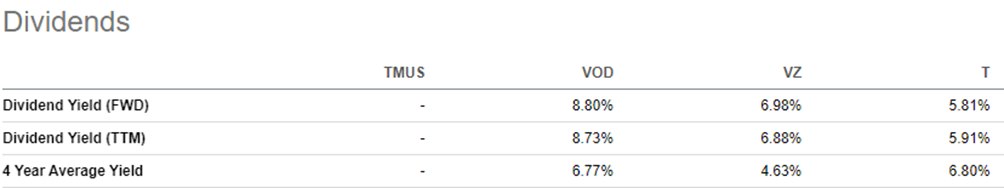
Risks
Expected Synergies and cost savings
As we can hear from the last Earnings Call:
“We now expect merger synergies to be between $5.7 billion to $5.8 billion, up $250 million at the midpoint, primarily as we unlock more network savings driven by accelerated site decommissioning. Merger-related costs, which are not included in core adjusted EBITDA, are expected to be between $4.8 billion and $5 billion before taxes, primarily representing network decommissioning activities.”
I think we will be able to start seeing the benefits of these synergies in 2023 but this could be an element of risk as this has not yet been realized and with a figure concerning operating expenses which, to date, identifies a discordant trend.
Revenue Growth
Company Management expects continuous revenue growth:
“Additionally, we continue to expect postpaid phone ARPU to be up approximately 2% for the full year driven by continued customer adoption of value-added services, including Magenta MAX. And with greater success in attracting new to T-Mobile customers with high-speed Internet, we now expect full year postpaid ARPA to be up in the mid- to high 2% range”
We can see this in the trend of postpaid services. We must also note that total revenue has remained unchanged compared to 2022 and also a decreasing trend in the last 4 quarters. This could be a wake-up call as revenue growth is essential precisely to grow capital turnover and improve the ROCE profitability parameter. A slowdown in revenue growth represents, in my opinion, a major business risk both in terms of profitability and capital employed.
Bottom Line
T-Mobile represents a strong growth company in terms of revenue (15% cagr since 2012) and EPS (11.4%). All profits are invested in new assets to increase coverage or provide excellent customer service. This strategy is bringing excellent results if we look at revenue growth with some concerns related to capital turnover and ROCE. In other words, revenue growth should occur at a higher pace when compared to the capital employed to achieve that growth.
In terms of valuation, the price appears to be high and, in any case, the expected return is not such, in my opinion, as to cover the intrinsic risks of the business. My rating is Hold.
Be the first to comment