

surasak petchang
Investment summary
Finding quality within medical technology (“medtech”) equities has become increasingly difficult in FY22. The high-beta/growth trade has completely unwound, leaving many portions of the sector exposed to heavy drawdown. Alas, low-beta, high quality strategies continue to perform in FY22 and that fact is no truer than in the mid-large cap medtech universe. The distribution of outcomes for the global economy now includes a higher probability of recession amid central bank tightening regimes that look to cool inflation via reverting economic growth. As investors look to step up in quality and liquidity we are looking to cash-compounding ability as a leading indicator of forward equity return.
High rates of free cash conversion below the bottom line are indicative of resilient business models that have a firm grasp over working capital and liquidity. If we are to enter a recessionary environment next year, only the most defensible business models will survive. The same is true if inflation is sticky at ~5% or above. Either way, investors are rewarding bottom-line fundamentals over top-line growth in FY22, in contrast to FY21.
This brings us to our case on Syneos Health, Inc (NASDAQ:SYNH). Our findings indicate the stock has been punished secondary to systematic risks this year. It presents with quality cash-generating characteristics that are attractive in the current climate. However, valuations are a concern on the name, leading us to believe the market has observed and discounted this future value. With that in mind, we are trigger shy on the name. Rate neutral, PT $66.
Exhibit 1.
SYNH 12-month price action
Data: Updata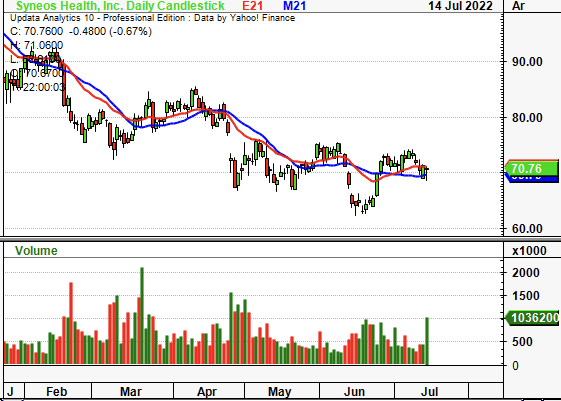
Q1 earnings illustrates fundamental momentum
Turning to the quarter, sales came in at $1.33 billion, up 10.5% YoY. Turnover was underscored by growth in both operating segments. Clinical solutions printed revenue of $1.02 billion, up ~8.5% YoY, whereas commercial solutions revenue came in at ~$318 million, an 18% YoY growth schedule. Meanwhile, it grew operating cash flow to ~$71 for the quarter, pulling down to $0.61 in EPS and $65 million in FCF. These were both down on historical averages secondary to acquisition costs. Noteworthy is that days sales outstanding (“DSO”) increased to 47 days, potentially signaling a headwind to working capital. However, SYNH has tightened up its working capital cycle over the past 3 years to date.
For instance, accounts receivable turnover has held tight and came in at ~3.7x last quarter, in line with historical averages, despite the increase in DSO. Moreover, average receivable collection days narrowed in by ~5 days to 99 days, with the cash conversion cycle decreasing from 95 days in September 2020 to 89 days in Q1 FY22. These improvements are relevant as management reported a spike in accounts receivable related to its large pharmaceutical companies who demand longer/less favorable terms of payment.
SYNH has tailwinds yet to pull through at its operating level as well. It reported book to bill (“Bk2B”) rations of ~1.3x for clinical solutions and ~1.2x for its commercial solutions segment in Q. As such T12M Bk2B ratios are ~1.4x on our calculations. This is supported by a solid demand-pull from backlog. In fact, backlog grew ~26% YoY last quarter. With this approach to working capital management, it also repurchased $150 million worth of its own shares throughout the quarter, offering a respective buyback yield.
The above trends are consistent with longer-term averages. As seen in Exhibit 2, SYNH has averaged a FCF yield of 4.8% since FY18, with a yield as high as ~7.5% in that time. This free cash conversion has occurred on steady gross and operating profit growth. The most important information derived from the chart is the trends. After a step-back during the pandemic, SYNH has since regained the pace of upside at the operating profit and FCF level. These trends are supportive of a name with a long-term history of compounding cash.
Exhibit 2.
SYNH continues to compound operating profit and FCF lending investors c. 5% yield on FCF since FY18
Data: HB Insights, SYNH SEC Filings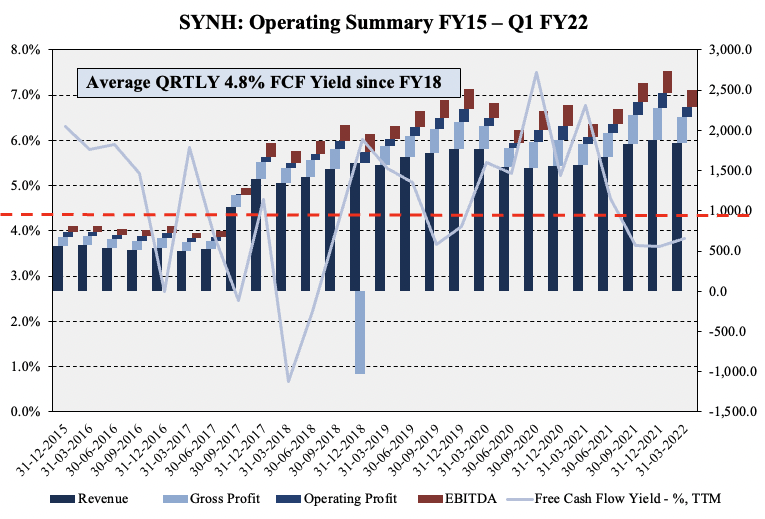
Moreover, Exhibit 4. corroborates these trends in cash conversion. Net-net, CFFO and FCF have grown geometrically by 42% and 58% over the past 5 years to date, albeit with seasonality along the way. Nevertheless, these are desirable characteristics in the current climate. Again, on a trends basis, SYNH comes with a substantial degree of fundamental momentum at the bottom line. Investors are paying a premium for these factors in FY22 and look to sustain this pattern for the foreseeable future. Hence, this picture is conducive to the equity premia discussed here.
Exhibit 3.
SYNH’s generating cash at a geometrically higher rate every 3 years. Demonstrates resilience of business model
Data: HB Insights, SYNH SEC Filings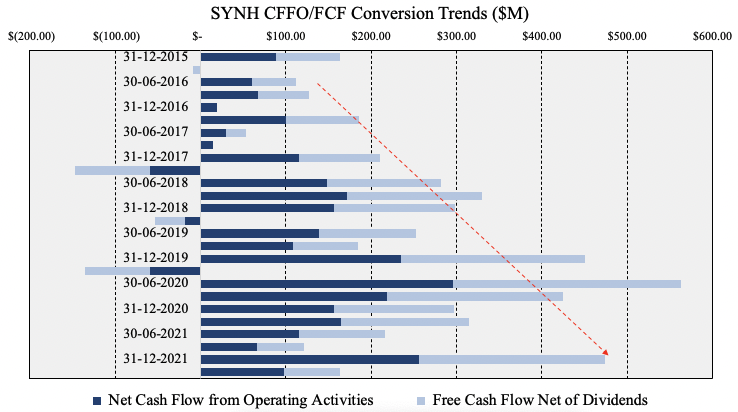
Just to hammer in the nail further, findings also show the company has been compounding return on its capital/asset at a steady rate of ~5-7% on average per year each in that time. ROA and ROIC have averaged that level and held firm during the course of the pandemic as a litmus test. With additional supply chain headwinds now present, SYNH is well positioned to absorb these, as the tail of returns on its asset base continues to lengthen, an effective hedge to thinning margins. As the cost of capital increases, this is imperative. It has a WACC of 7.25% and therefore keep CAPEX light and cash flows predictable to justify valuation.
Exhibit 4.
Compounding return on capital/asset base at ~5-7% on average annually
Data: HB Insights, SYNH SEC Filings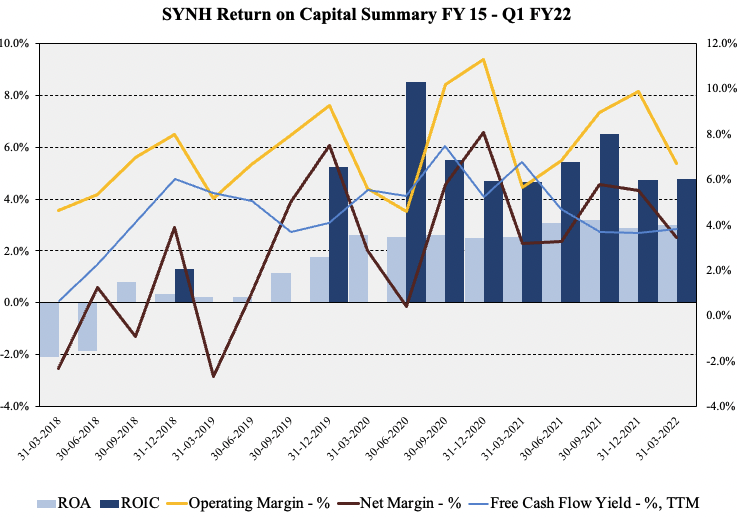
These are desirable characteristics that separate SYNH from other names within the space, this bastion of FCF conversion. It printed FCF at 7% of its current market cap in FY21 and this looks set to continue in FY22. We’ve forecast it to print ~$490 in FCF this year, before growing FCF substantially to $522 million in FY23 and $508 million in FY24.
Valuation
Shares are trading at ~13x FWD P/E, at ~1.8x book value and come in at ~1.2x forward sales. On average, shares trade at a -4.7% discount across key multiples, with other names in the sector looking overvalued relative to book value of equity. Trading at ~1.2x FWD sales implies it is fairly valued on sales estimates. However, we’re more concerned with bottom line growth, and SYNH looks well priced on a forward earnings basis, trading below the S&P 500’s long-term P/E of ~18.5x.
Exhibit 5. Multiples and Comps
Data: HB Insights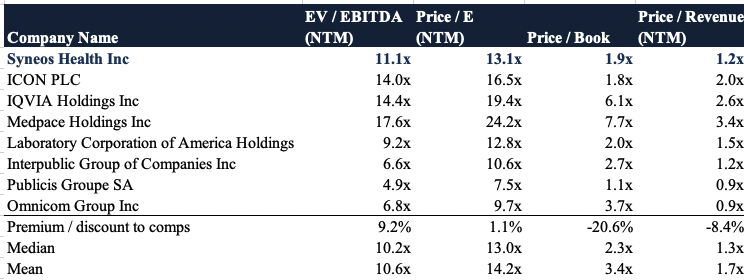
Tangible value has been realized to date for shareholders and these trends seek to continue looking ahead. Investors have realized more than $9.72 in FCF per share since Q3 FY19, with each quarter, bar one, exhibiting a sequential increase. As seen in Exhibit 6, growth trends in this domain have been generous and correlate to upward movement in the SYNH share price. Now that investors have shifted focus onto bottom-line fundamentals, this kind of FCF momentum coming into the new year is essential.
Exhibit 6.
Data: HB Insights, SYNH SEC Filings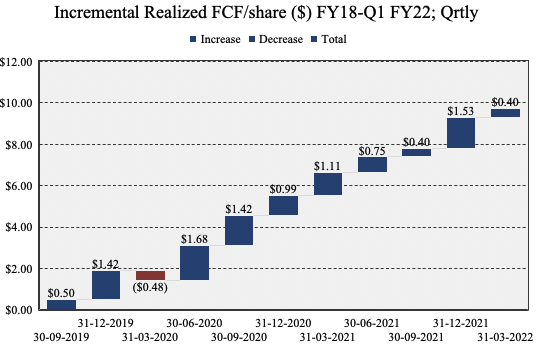
Investors are paying a premium for these characteristics in FY22, and evidence of this is seen in Exhibit 7, below. We can see that SYNH has gained in relative strength against the benchmark S&P 500 medical devices, equipment and supplies index. In our view, this is evidence of the stock separating from this universe and converging to the upside. Particularly, as seen below, the April uptick in relative strength to the sector wasn’t fully realized on the chart until June/July.
Exhibit 7.
SYNH showing relative strength to wider sector
Data: Updata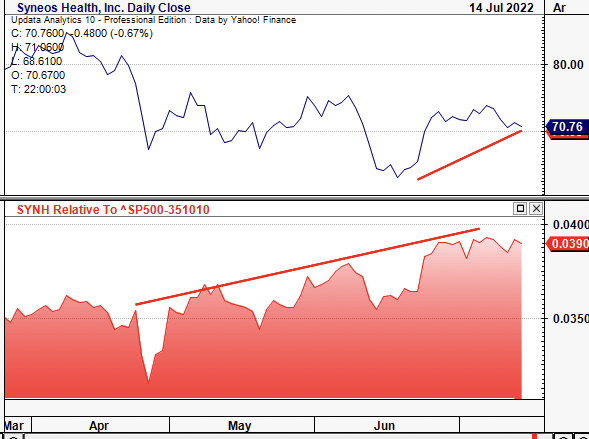
An unambiguous measure of price objectives is needed in this case also, considering the market’s volatility. Point and figure charting indicates upside potential to the $93.50 zone, with two downside targets yet to be validated at $66-$40.50. This is a wide spread and the upside target needs incredible support to break through the 5 inner resistance lines formed from the any downthrusts SYNH is exhibited in FY22. Nevertheless, there is potential at the $93.50 level if price action reverses and charges north. Taking the arithmetic mean of these three gives us $66.80.
Exhibit 8.
Multiple upside and downside targets, wide spread: $93.50-$40.50
Data: Updata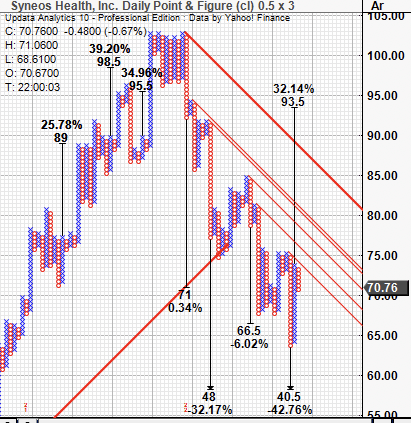
Blending all three together and using historical averages sees us price SYNH at $66.15. The historical to implied valuation analysis is shown on the table below.
Exhibit 9.
Normalized vs. implied valuation analysis
Data: HB Insights, Refinitiv Eikon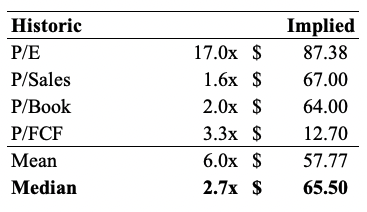
Technical studies
On the 6-month cloud chart, shares are testing the cloud having done that 2x in FY22 and being rejected each time. The lag line has yet to catch up and looks to test the cloud soon too. OBV is rangebound and in a flag alongside momentum. Neither have made any movements to the upside or downside which leaves us to believe these next moves are crucial for the SYNH share price.
Should it break through the cloud, we’d be looking at near-term support at ~$75 by estimation.
Exhibit 10. Testing cloud support once more after 2x rejection in FY22
Data: Updata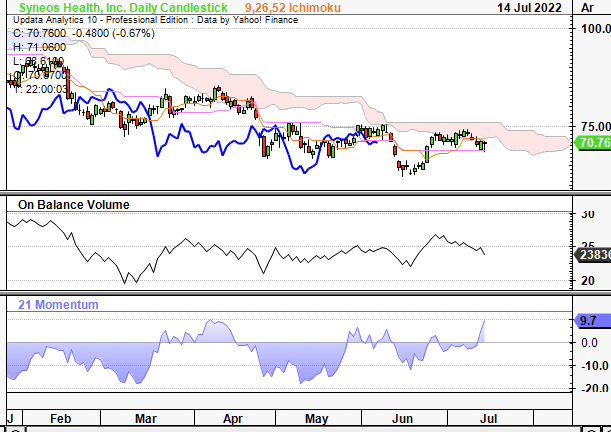
Retracing the fibs down from its previous high to the June low, we can see that shares have tested the 23% mark x 2 with rejection and are reverting to the downside. A pullback to $62 would therefore signal bearish momentum. However, if buyers enter at this resistance level, we’d be looking at $78 for the next technical upside target. This is dislocated from price objectives found in earlier analysis and will need further investigation when more data arrives.
Exhibit 11. Testing key levels on the fibs’
Data: Updata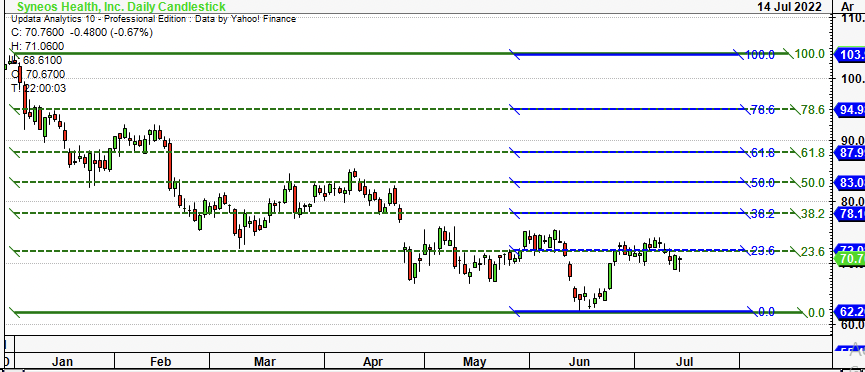
In short
SYNH presents with the fundamental characteristics that justify its inclusion as a defensible holding in an equity focused portfolio. Steady and consistent free cash conversion, respectable multiples and a new CEO all give it potential to re-rate. However, our findings show it may be richly valued at valuation of $66, ~$4 per share below the current market price.
As such, we’ve opted to wait for further confirmation on the charts to obtain a directional view on this name. There’s plenty of flesh to put on the skeleton, it’s just a question if investors will reward the stock instead of punishing it (and others) from wider systematic risks. Either sense, we’re trigger shy on this name right now. We rate shares neutral on a $66 PT.
Be the first to comment