

Pgiam/iStock via Getty Images
The primary focus of this article is Syndax Pharmaceuticals, Inc. (NASDAQ:SNDX).
Investment Thesis
21st Century paces of change in technology and rational behavior (not of emotional reactions) seriously disrupts the commonly accepted productive investment strategy of the 20th century.
One required change is the shortening of forecast horizons, with a shift from the multi-year passive approach of buy&hold to the active strategy of specific price-change target achievement or time-limit actions, with reinvestment set to new nearer-term targets.
That change avoids the irretrievable loss of invested time spent destructively by failure to recognize shifting evolution like the cases of IBM (IBM), Kodak, General Motors (GM), Xerox Holdings (XRX), General Electric (GE) and many earlier others.
It recognizes the progress in medical, communication and information technologies and enjoys their operational benefits already present in extended lifetimes, trade-commission-free investments, and coming benefits in transportation utilization and energy usage.
But it requires the ability to make valid direct comparisons of value between investment reward prospects and risk exposures in the uncertain future. Since uncertainty expands as the future dimension increases, shorter forecast horizons are a means of improving the reward-to-risk comparison.
That shortening is now best attended at the investment entry point by knowing Market-Maker expectations for coming prices. When reached, their updates are then reintroduced at the exit/reinvestment point and the term of expectations for the required coming comparisons are recognized as the decision entry point to move forward.
We employ arbitrage science to determine the MM community’s near-term price expectations limits as a continuing measure of the balance between market-price prospective risk and reward. Then we monitor prior subsequent actual market performance to choose between opportunities.
For investments guided by this article or by others, target sell prices will always be found here as the high price in the MM forecast range.
Description of Equity Subject Company
“Syndax Pharmaceuticals, Inc., a clinical-stage biopharmaceutical company, develops therapies for the treatment of cancer. Its lead product candidates are SNDX-5613, which is in phase 1/2 clinical trial targeting the binding interaction of Menin with the mixed lineage leukemia 1 protein for the treatment of MLL-rearranged (MLLr) and nucleophosmin 1 mutant acute myeloid leukemia (NPM1c AML); and SNDX-6352 or axatilimab, a monoclonal antibody that blocks the colony stimulating factor 1, or CSF-1 receptor for the treatment of patients with chronic graft versus host disease (cGVHD). The company is also developing Entinostat. It also has collaborative research and development agreement with National Cancer Institute; a clinical trial agreement with Eastern Cooperative Oncology Group; and a license agreement with Kyowa Hakko Kirin Co., Ltd. Syndax Pharmaceuticals, Inc. was incorporated in 2005 and is headquartered in Waltham, Massachusetts.”
Source: Yahoo Finance
Note: terminology descriptive detail included intentionally as provided by source to emphasize needed roles of specializing analysts.
Yahoo Finance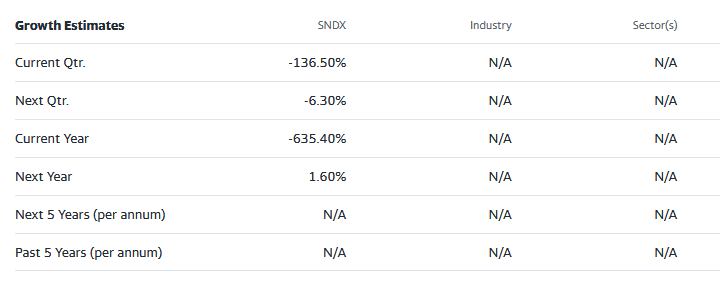
These growth estimates have been made by and are collected from Wall Street analysts to suggest what basic conventional methodology currently produces. The typical variations across forecast horizons of different time periods illustrate the difficulty of making value comparisons when the forecast horizon is not clearly defined.
Risk and Reward Balances Among Biotech Developer Competitors
Figure 1
blockdesk.com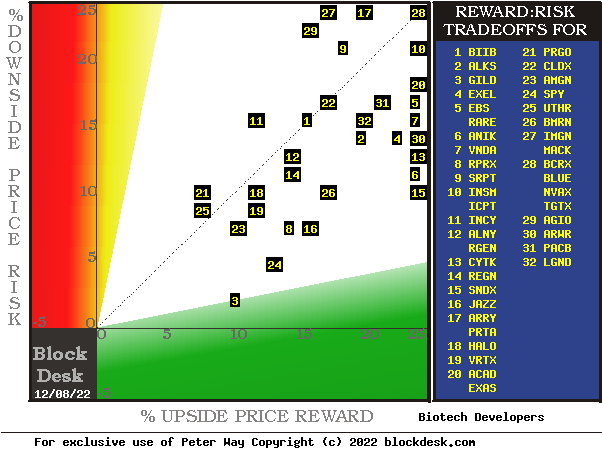
(Image used with permission)
The risk dimension is of actual price draw-downs at their most extreme point while being held in previous pursuit of upside rewards similar to the ones currently being seen. They are measured on the red vertical scale. Reward expectations are measured on the green horizontal scale.
Both scales are of percent change from zero to 25%. Any stock or Exchange Traded Fund [ETF] whose present risk exposure exceeds its reward prospect will be above the dotted diagonal line. Capital-gain-attractive to-buy issues are in the directions down and to the right.
Our principal interest is in SNDX at location [15], close above the right-hand edge of the green 5 to 1 reward~risk area. A “market index” norm of reward~risk tradeoffs is offered by SPY at [3]. Most appealing by this Figure 1 view for wealth-building investors appears to be SNDX.
Comparable features of Biotech Development Competitors
The Figure 1 map provides a good visual comparison of the two most important aspects of every equity investment in the short term. There are other aspects of comparison which this map sometimes does not communicate well, particularly when general market perspectives like those of SPY are involved. Where questions of “how likely’ are present other comparative tables, like Figure 2, may be useful.
Yellow highlighting of the table’s cells emphasize factors important to securities valuations and the security SNDX, most promising of near capital gain as ranked in column [R].
Figure 2
blockdesk.com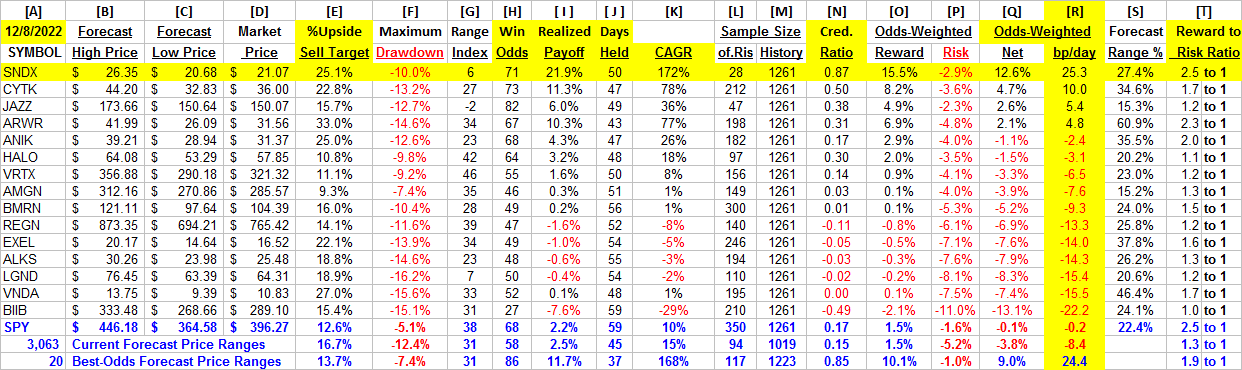
(Image used with permission)
Why do All This Math?
Figure 2’s purpose is to attempt universally comparable answers, stock by stock, of a) How BIG the prospective price gain payoff may be, b) how LIKELY the payoff will be a profitable experience, c) how SOON it may happen, and d) what price draw-down RISK may be encountered during its active holding period.
Readers familiar with our analysis methods after quick examination of Figure 2 may wish to skip to the next section viewing price range forecast trends for SNDX.
Column headers for Figure 2 define investment-choice preference elements for each row stock whose symbol appears at the left in column [A]. The elements are derived or calculated separately for each stock, based on the specifics of its situation and current-day MM price-range forecasts. Data in red numerals are negative, usually undesirable to “long” holding positions. Table cells with yellow fills are of data for the stocks of principal interest and of all issues at the ranking column, [R].
The price-range forecast limits of columns [B] and [C] get defined by MM hedging actions to protect firm capital required to be put at risk of price changes from volume trade orders placed by big-$ “institutional” clients.
[E] measures potential upside risks for MM short positions created to fill such orders, and reward potentials for the buy-side positions so created. Prior forecasts like the present provide a history of relevant price draw-down risks for buyers. The most severe ones actually encountered are in [F], during holding periods in effort to reach [E] gains. Those are where buyers are emotionally most likely to accept losses.
The Range Index [G] tells where today’s price lies relative to the MM community’s forecast of upper and lower limits of coming prices. Its numeric is the percentage proportion of the full low to high forecast occurring below the current market price.
[H] tells what proportion of the [L] sample of prior like-balance forecasts have earned gains by either having price reach its [B] target or be above its [D] entry cost at the end of a 3-month max-patience holding period limit. [ I ] gives the net gains-losses of those [L] experiences.
What makes SNDX most attractive in the group at this point in time is its ability to produce capital gains most consistently at its present operating balance between share price risk and reward at the Range Index [G]. At a RI of 6, today’s price is near the low of its forecast range, with price expectations to the upside several times those of the downside. These are not our expectations, but those of Market-Makers acting in support of Institutional Investment organization clients acting to build the values of their typical multi-billion-$ portfolios.
Further Reward~Risk tradeoffs involve using the [H] odds for gains with the 100 – H loss odds as weights for N-conditioned [E] and for [F], for a combined-return score [Q]. The typical position holding period [J] on [Q] provides a figure of merit [fom] ranking measure [R] useful in portfolio position preferencing. Figure 2 is row-ranked on [R] among alternative candidate securities, with SNDX in top rank.
Along with the candidate-specific stocks these selection considerations are provided for the averages of some 3,000 stocks for which MM price-range forecasts are available today, and 20 of the best-ranked (by fom) of those forecasts, as well as the forecast for S&P 500 Index ETF (SPY) as an equity-market proxy.
Current-market index SPY is only moderately competitive as an investment alternative. Its Range Index of 38 indicates under two-thirds of its forecast range is to the upside, while about two-thirds of previous SPY forecasts at this range index produced profitable outcomes.
As shown in column [T] of figure 2, the levels vary significantly between stocks. What matters is the net gain between investment gains and losses actually achieved following the forecasts, shown in column [I]. The Win Odds of [H] tells what proportion of the Sample RIs of each stock were profitable. Odds below 80% often have proven to lack reliability. All but 9 of SNDX’s 28 RIs at 6 in the past 5 years have been profitable under our standard risk-management discipline.
Recent Forecast Trends of the Primary Subject
Figure 3
blockdesk.com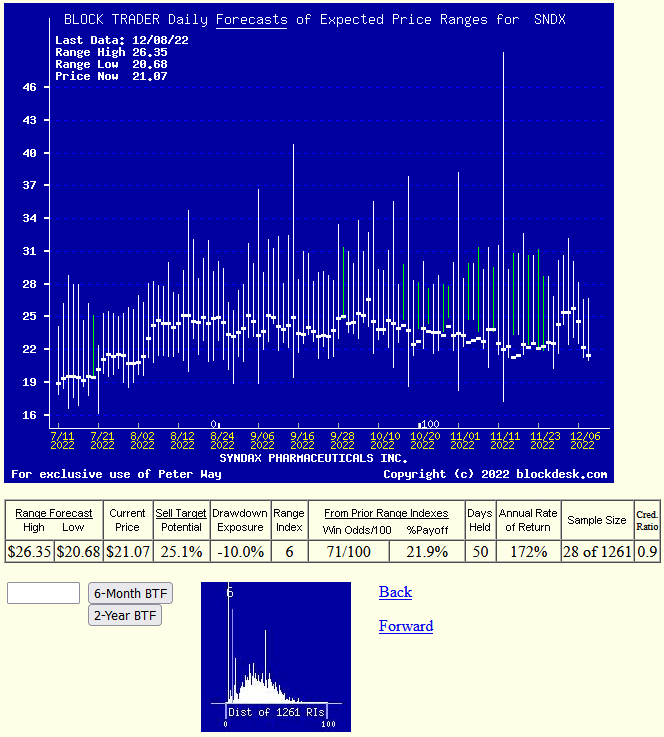
(Image used with permission)
Many investors confuse any time-repeating picture of stock prices with typical “technical analysis charts” of past stock price history. These are quite different in their content. Instead, here Figure 3’s vertical lines are a daily-updated visual record of price range forecast limits expected in the coming few weeks and months. The heavy dot in each vertical is the stock’s closing price on the day the forecast was made.
That market price point makes an explicit definition of the price reward and risk exposure, expectations which were held by market participants at the time. This is a visual display of their vertical balance between risk and reward.
The measure of that balance is the Range Index (RI).
With today’s RI of 6, SNDX has 25.1% upside price change in prospect. Of the prior 28 forecasts like today’s RI, most have been profitable. The market’s actions of prior forecasts became accomplishments of +21.9% gains in averages of 50 market days, or 10 weeks. So history’s advantage could be repeated five times or more in a 252 market-day year, which compounds into a CAGR of +172%.
Also please note the smaller low picture in Figure 3. It shows the past 5 year distribution of Range Indexes with the current level visually marked. For SNDX the largest proportion of recent past forecasts have been of higher prices and Range Indexes. The 71 of 100 profitable “Win” odds suggests a good probability that market prices are likely in the next two months to reach or exceed price-range high targets. While not an outstanding prospect, it reflects in competition with other choices the present nature of equity markets’ reactions to uncertainty.
Conclusion
Based on direct comparisons with SNDX and other Biotech Developer competitors, there are strong wealth-building reasons to prefer a capital-gain seeking buy in Syndax Pharmaceuticals, Inc. over other best-positioned (by capital-at-risk motivated professionals) examined alternatives.
Be the first to comment