

Dow Jones, S&P 500, Fiscal Stimulus, Federal Reserve, Earnings – Talking Points:
- Equity market drifted lower on light volumes during APAC trade.
- US benchmark indices may slide lower despite a relatively positive fundamental backdrop.
- Bearish RSI divergence suggests that the SP 500 and Dow Jones could be at risk of a short-term pullback.
Asia-Pacific Recap
Equity markets drifted lower during the Asia-Pacific session on light volumes, as Chinese New Year celebrations curbed trade. Australia’s ASX 200 slipped 0.63% as Victoria, the nation’s second-most populous state, entered a snap 5-day lockdown due to an outbreak of coronavirus cases. Japan’s Nikkei 225 drifted 0.28% lower.
In FX markets, the haven-associated US Dollar and Japanese Yen gained ground, while the cyclically-sensitive Canadian Dollar and Norwegian Krone largely underperformed. Gold and silver prices slid marginally lower as yields on US 10-year Treasuries held steady at 1.16%. Looking ahead, UK GDP figures headline the economic docket alongside consumer sentiment out of the US.
Fading Momentum Hints at Short-Term Pullback for US Equity Indices
US benchmark indices climbed to fresh record highs overnight, on the back of positive jobs data and the prospect of additional fiscal stimulus. However, price action suggests that a near-term pullback could be on the cards, as near all-time high price/earnings ratios suggest that valuations may be overstretched.
That being said, results for the latest earnings season have been relatively positive, with just over 74% of the 387 companies in the S&P 500 posting better-than-expected results. The impending delivery of a substantial fiscal support package may underpin stock prices, with House and Senate Democrats paving the way for President Biden to pass the majority of his proposed $1.9 trillion plan with a simple majority – in a process called reconciliation.
Federal Reserve Balance Sheet
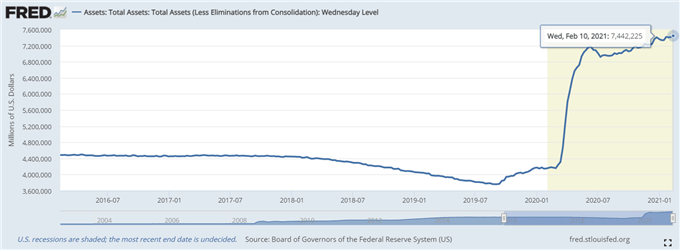
Moreover, the Federal Reserve’s commitment to continue purchasing at least $80 billion of Treasury securities and $40 billion of agency mortgage-backed securities a month “until substantial progress has been made toward the Committee’s maximum employment and price stability goals”, will likely bolster risk assets. Indeed, Federal Reserve Chairman reiterated that it is extremely unlikely that the central bank “even think about withdrawing policy support” in the foreseeable future.
Nevertheless, a short-term technical pullback seems in the offing and could provide traders with the opportunity to ‘buy the dip’, given the fundamental backdrop continues to hint at further upside for US stock market indices.
S&P 500 Futures Daily Chart – RSI Divergence Signals Uptrend Exhaustion
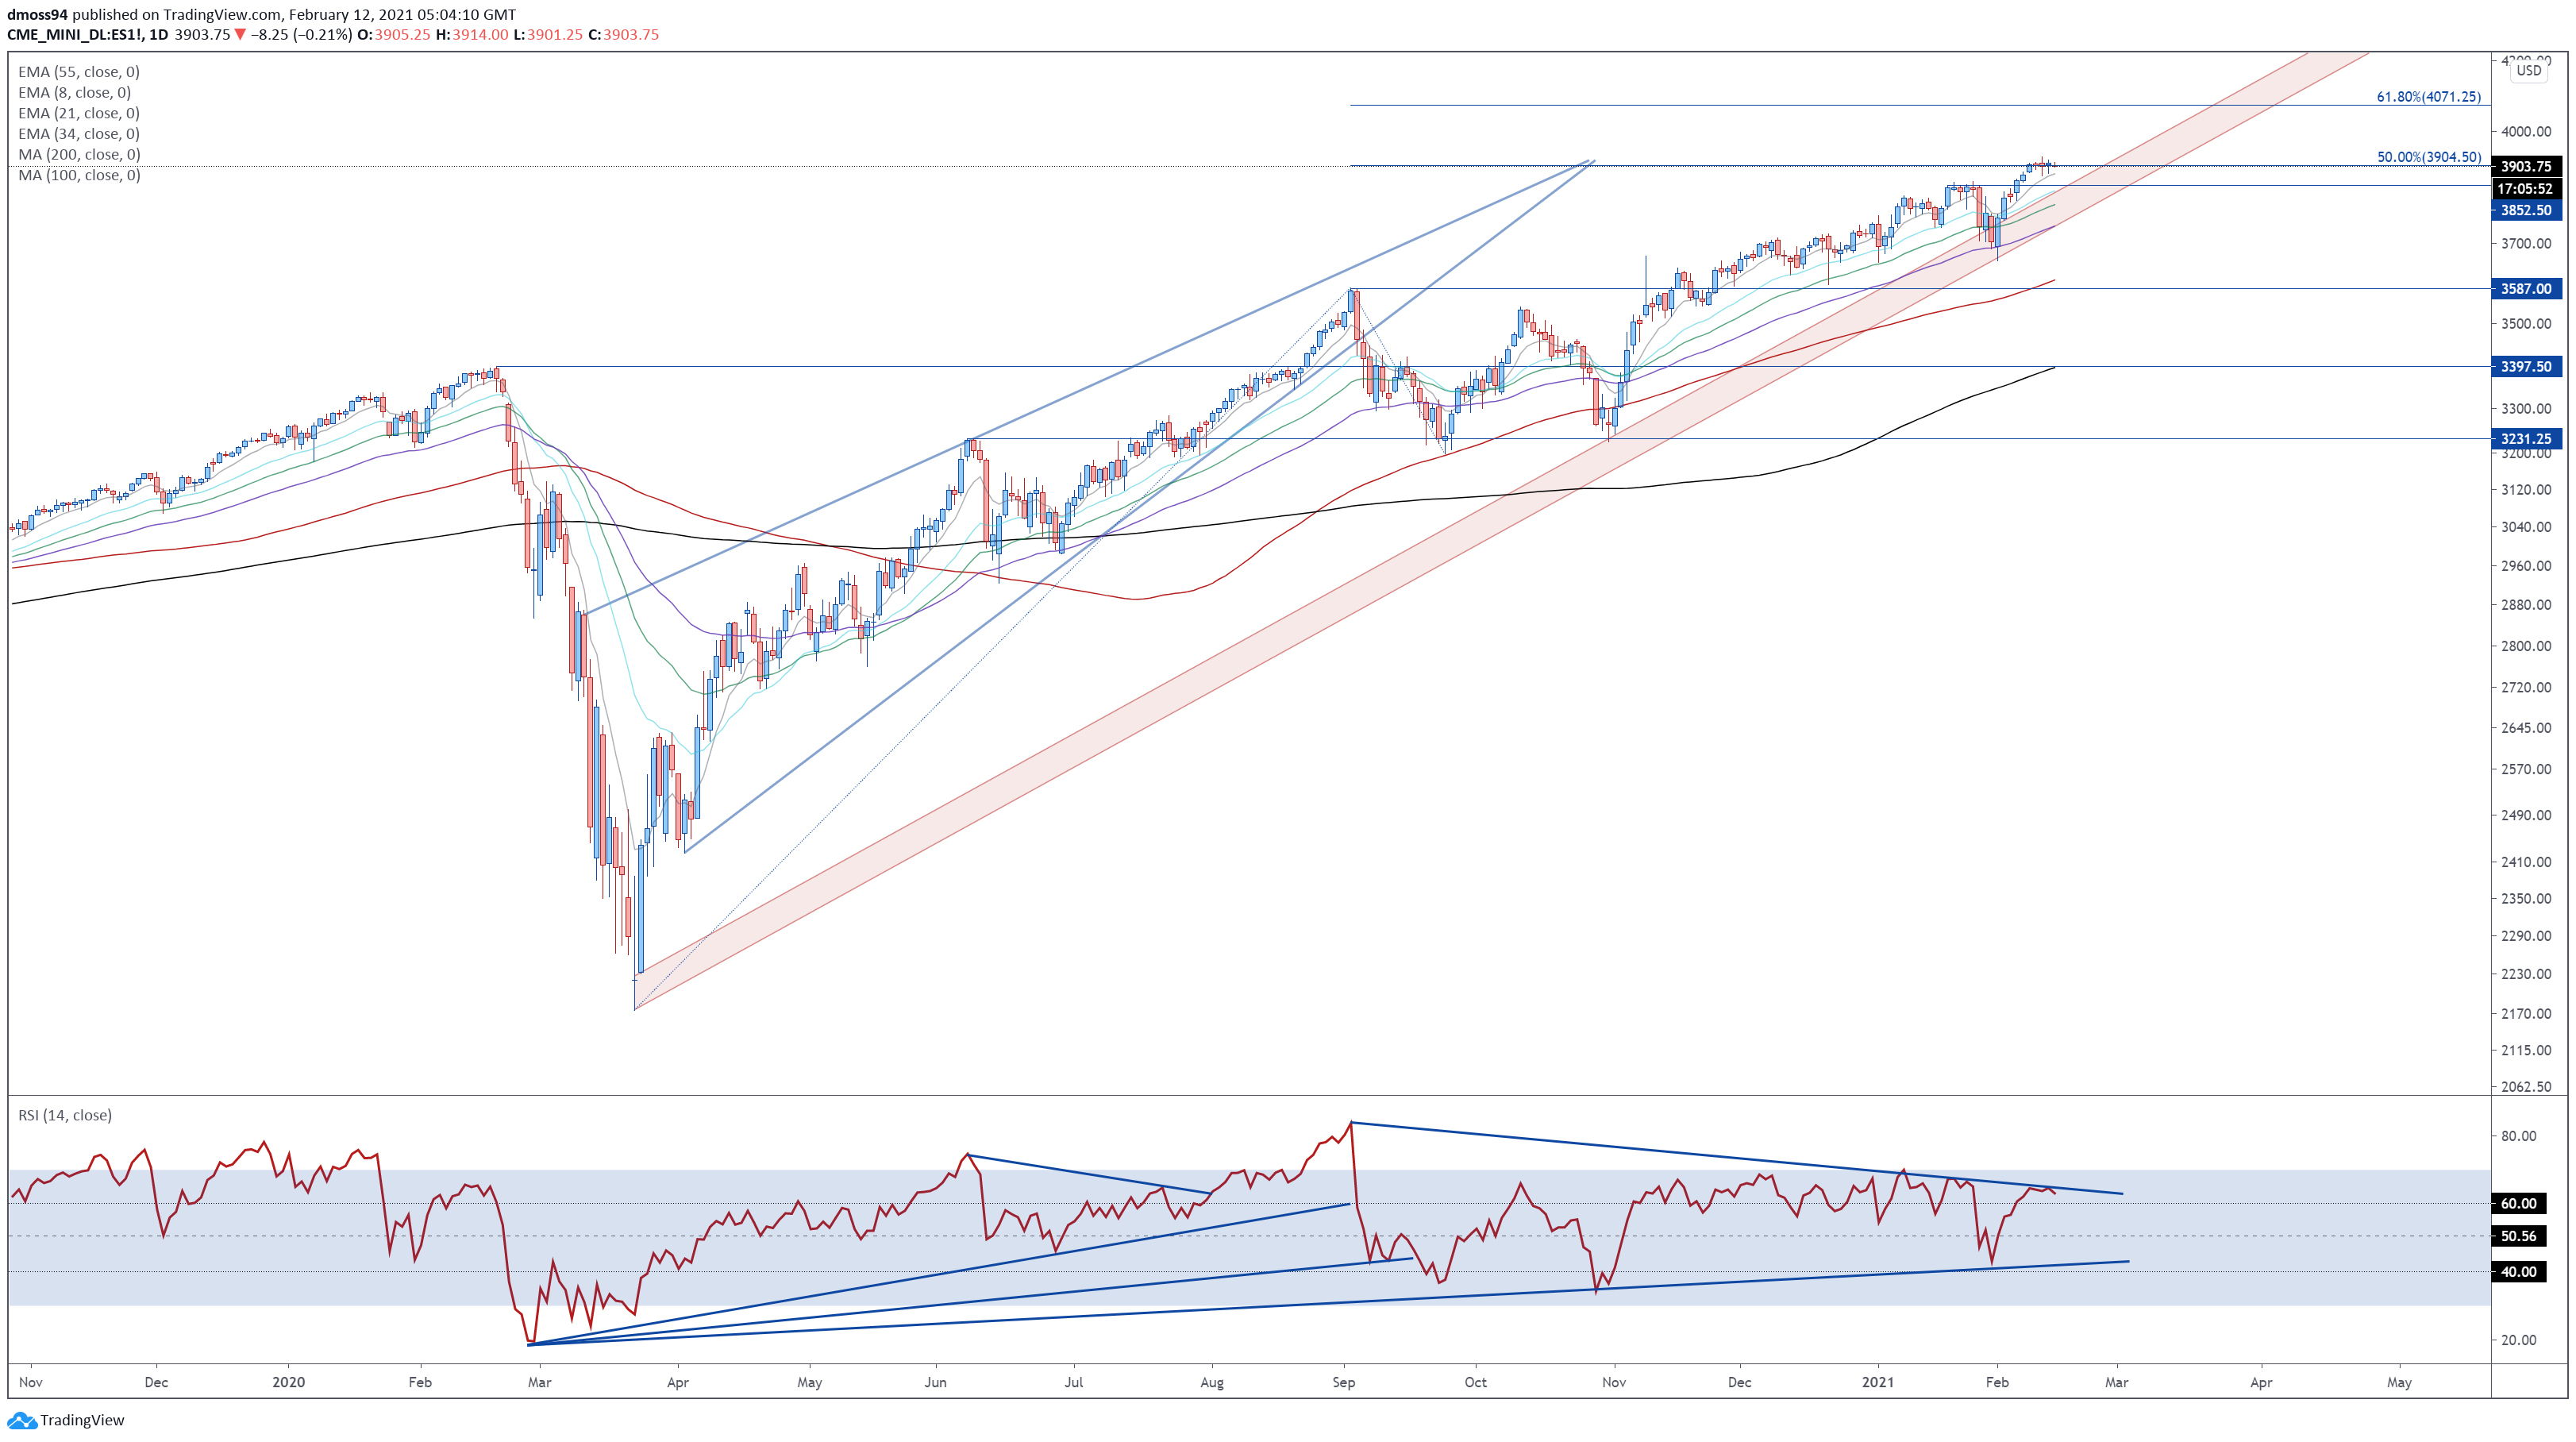
S&P 500 futures daily chart created using Tradingview
The formation of multiple Doji candles, alongside bearish RSI divergence, suggests that the S&P 500 may slip lower in the coming days.
A pullback to former support-turned-resistance at 3852, if sellers can successfully hurdle the 3900 mark and 8-day EMA (3883). Breaching that could open the door for price to challenge confluent support at the uptrend extending from the March 2020 nadir and 55-EMA (3745).
However, bullish MA stacking, in tandem with the RSI hovering above 60, implies that an extended reversal lower is relatively unlikely.
Ultimately, a daily close above 3930 is needed to signal the resumption of the primary uptrend and pave the way for the index to probe the psychologically imposing 4000 mark.
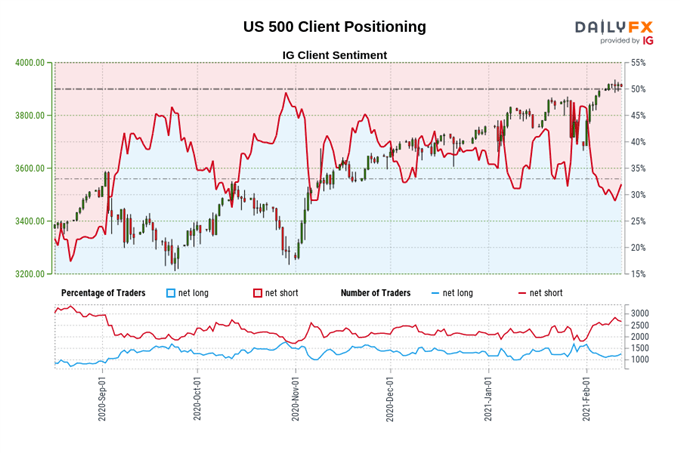
The IG Client Sentiment Report shows 31.17% of traders are net-long with the ratio of traders short to long at 2.21 to 1. The number of traders net-long is 5.46% higher than yesterday and 1.42% higher from last week, while the number of traders net-short is 0.74% lower than yesterday and 7.61% higher from last week.
We typically take a contrarian view to crowd sentiment, and the fact traders are net-short suggests S&P 500 prices may continue to rise.
Positioning is less net-short than yesterday but more net-short from last week. The combination of current sentiment and recent changes gives us a further mixed S&P 500 trading bias.
Dow Jones Futures Daily Chart – Struggling at Psychological Resistance

Dow Jones futures daily chart created using Tradingview
The Dow Jones also seems poised to slide lower in the near term, as prices fail to gain a firm foothold above the 31500 mark.
Bearish RSI divergence also suggests that the surge to fresh record highs may be running out of steam.
Slipping below former support-turned-resistance could trigger a pullback to confluent support at the 55-EMA (30329) and 11-month uptrend. Breaching that opens the door for price to probe range support at 29450 – 29600.
On the other hand, a daily close above the February high (31465) is required to signal the resumption of the primary uptrend and bring the 50% Fibonacci (32170) into the crosshairs.
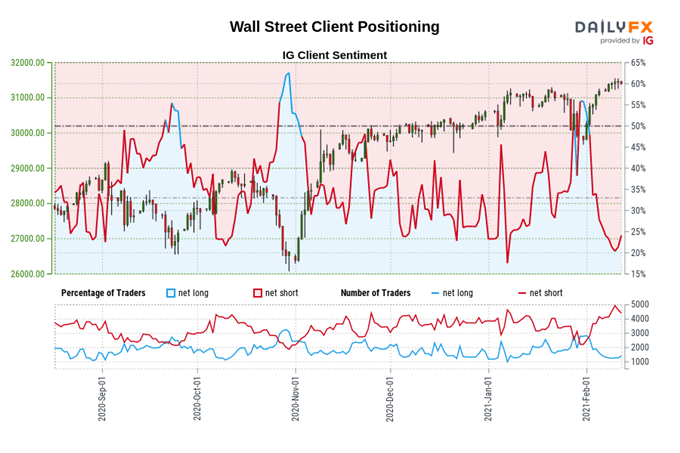
The IG Client Sentiment Report shows 23.22% of traders are net-long with the ratio of traders short to long at 3.31 to 1. The number of traders net-long is 10.26% higher than yesterday and 15.05% lower from last week, while the number of traders net-short is 2.74% lower than yesterday and 9.52% higher from last week.
We typically take a contrarian view to crowd sentiment, and the fact traders are net-short suggests Wall Street prices may continue to rise.
Positioning is less net-short than yesterday but more net-short from last week. The combination of current sentiment and recent changes gives us a further mixed Wall Street trading bias.
— Written by Daniel Moss, Analyst for DailyFX
Follow me on Twitter @DanielGMoss

Recommended by Daniel Moss
Top Trading Lessons
Be the first to comment