

aimintang
Earnings of Prosperity Bancshares, Inc. (NYSE:PB) will most probably continue on an uptrend this year on the back of moderate loan growth. Moreover, the recent improvement in the deposit mix will help the margin expand further in upcoming quarters as interest rates rise. Overall, I’m expecting Prosperity Bancshares to report earnings of $5.72 per share for 2022, up 2%, and $6.05 per share for 2023, up 6% year-over-year. Compared to my last report on the company, I’ve slightly increased my earnings estimate for 2022 mostly because I’ve raised my margin estimate. The December 2023 target price suggests a moderate upside from the current market price. Based on the total expected return, I’m maintaining a hold rating on Prosperity Bancshares.
Deposit Mix Improvement Bodes Well for the Margin
Prosperity Bancshares’ net interest margin grew by 14 basis points in the third quarter, following growth of nine basis points in the second quarter of 2022. The bank has steadily improved its deposit mix throughout the first nine months of the year. Non-interest-bearing deposits rose to 38.1% of total deposits by the end of September from 36.9% at the end of June and 34.9% at the end of December 2021. This improvement will ensure that the average deposit cost becomes stickier in upcoming quarters.
Unfortunately, Prosperity Bancshares has a very large securities portfolio, which will hold back the average earning-asset yield as most securities carry fixed rates. At the end of September 2022, securities made up a hefty 45% of total earning assets.
On the plus side, variable and floating-rate loans make up 57.9% of total loans, as mentioned in the earnings presentation. These loans will help the margin continue to expand in upcoming quarters. Considering these factors, I’m expecting the net interest margin to increase by five basis points in the last quarter of 2022 and ten basis points in 2023. Compared to my last report on Prosperity Bancshares, which was issued back in August 2022, I’ve revised upwards my margin estimates mostly because of the recent improvement in the deposit mix. Further, the fed funds rate hikes in the latter part of 2022 have beaten the previous expectations given in my last report on the company.
Loan Growth Likely to be Lackluster
After the second quarter’s strong performance, loan growth seemed to lose steam in the third quarter of 2022. The portfolio grew by barely 0.1% during the quarter, which missed my expectations.
The outlook is not too bright because of residential mortgages. One-to-four-family residential loans made up a massive 29.4% of total loans, while home equity lines of credit made up another 5.1% of total loans at the end of September 2022, as mentioned in the presentation. Residential loans are heavily dependent on borrowing costs as borrowers in this segment can wait for more feasible times. As shown below, the 15-year mortgage rate is currently at a decade high, which is bound to hurt the demand for residential loans.
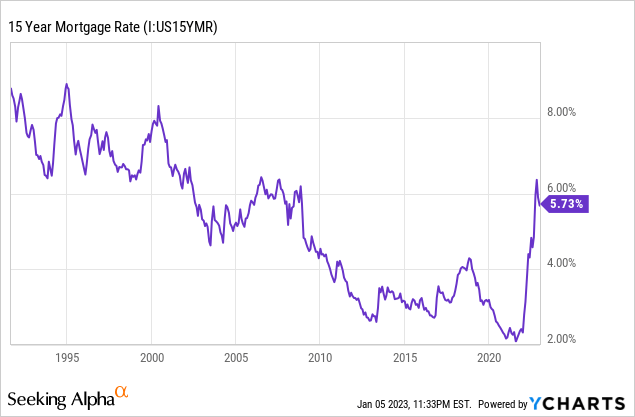
Additionally, the Mortgage Bankers Association expects mortgage purchase originations to dip by 8% year-over-year in 2023.
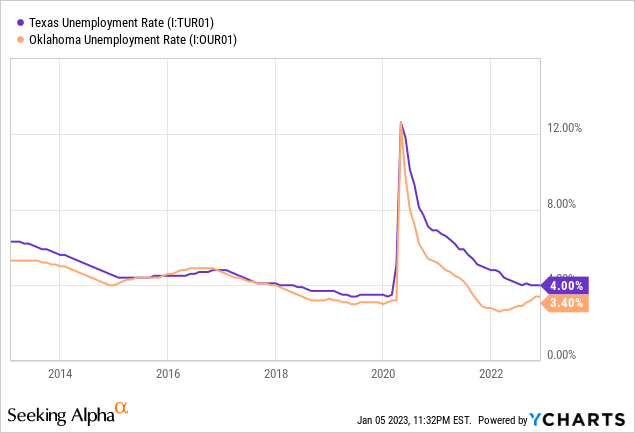
On the plus side, strong labor markets continue to bode well for commercial loan growth. Prosperity Bancshares operates in Texas and Oklahoma, both of which currently have strong job markets relative to their respective histories.
Considering these factors, I’m expecting the loan portfolio to have grown by 0.5% in the last quarter of 2022, taking full-year loan growth to negative 0.1%. For 2023, I’m expecting the loan portfolio to grow by 3%. Compared to my last report on Prosperity Bancshares, I’ve reduced my loan growth estimates for both the fourth quarter and the full year of 2023 due to the third quarter’s disappointing performance.
Meanwhile, I’m expecting deposits to grow in line with loans. However, the growth of equity will suffer due to the presence of a large securities balance. As interest rates rise, the market value of fixed-rate securities will fall, leading to unrealized mark-to-market losses. These losses will skip the income statement and erode the equity balance through other comprehensive income, as per relevant accounting standards. Therefore, the equity book value will face continued pressure in upcoming quarters due to the ongoing up-rate cycle. The following table shows my balance sheet estimates.
| Financial Position | FY18 | FY19 | FY20 | FY21 | FY22E | FY23E |
| Net Loans | 10,284 | 18,758 | 19,931 | 18,330 | 18,315 | 18,871 |
| Growth of Net Loans | 3.5% | 82.4% | 6.3% | (8.0)% | (0.1)% | 3.0% |
| Other Earning Assets | 9,439 | 8,571 | 8,590 | 12,826 | 14,884 | 15,488 |
| Deposits | 17,257 | 24,200 | 27,360 | 30,772 | 29,447 | 30,340 |
| Borrowings and Sub-Debt | 1,316 | 1,807 | 390 | 449 | 1,627 | 1,660 |
| Common equity | 4,053 | 5,971 | 6,131 | 6,427 | 6,546 | 6,746 |
| Book Value Per Share ($) | 58.1 | 81.2 | 65.9 | 69.7 | 71.8 | 74.0 |
| Tangible BVPS ($) | 30.4 | 36.2 | 30.4 | 34.0 | 35.8 | 37.9 |
| Source: SEC Filings, Author’s Estimates(In USD million unless otherwise specified) | ||||||
Provision Normalization to Restrict Earnings Growth
Prosperity Bancshares surprised me by reporting zero net provision expense for the third quarter yet again. The company has now reported nil provisioning for the last eight consecutive quarters. As I mentioned in my last report, I think this trend cannot be maintained for long because borrowers are under stress. The stressors include the possibility of a recession as well as the high inflation environment. As a result, I’m expecting provisioning to return to a normal level in the fourth quarter of 2022 and the full year of 2023. I’m expecting the net provision expense to make up around 0.09% of total loans in 2023, which is the same as the average for the last five years.
The anticipated loan growth and margin expansion will undermine the effect of provisioning normalization. Overall, I’m expecting Prosperity Bancshares to report earnings of $5.72 per share for 2022, up 2% year-over-year. For 2023, I’m expecting earnings to grow by 6% to $6.05 per share. The following table shows my income statement estimates.
| Income Statement | FY18 | FY19 | FY20 | FY21 | FY22E | FY23E |
| Net interest income | 630 | 696 | 1,031 | 993 | 1,014 | 1,081 |
| Provision for loan losses | 16 | 4 | 20 | – | 4 | 17 |
| Non-interest income | 116 | 124 | 132 | 140 | 142 | 141 |
| Non-interest expense | 326 | 397 | 497 | 474 | 488 | 497 |
| Net income – Common Sh. | 322 | 333 | 529 | 519 | 521 | 552 |
| EPS – Diluted ($) | 4.61 | 4.52 | 5.68 | 5.60 | 5.72 | 6.05 |
| Source: SEC Filings, Author’s Estimates(In USD million unless otherwise specified) | ||||||
In my last report on Prosperity Bancshares, I estimated earnings of $5.64 per share for 2022. I’ve increased my earnings estimate mostly because I’ve raised my margin estimate.
My estimates are based on certain macroeconomic assumptions that may not come to fruition. Therefore, actual earnings can differ materially from my estimates.
Maintaining a Hold Rating
Prosperity Bancshares has a long-standing tradition of increasing its dividend in the last quarter of the year. Given the earnings outlook, it’s likely that the company will maintain the dividend trend this year. Therefore, I’m expecting the company to increase its dividend by $0.02 per share to $0.57 per share in the last quarter of 2023. The earnings and dividend estimates suggest a payout ratio of 37% for 2023, which is in line with the five-year average of 35%. Based on my dividend estimate, Prosperity Bancshares is offering a forward dividend yield of 3.1%.
I’m using the historical price-to-tangible book (“P/TB”) and price-to-earnings (“P/E”) multiples to value Prosperity Bancshares. The stock has traded at an average P/TB ratio of 2.11 in the past, as shown below.
| FY19 | FY20 | FY21 | Average | |||
| T. Book Value per Share ($) | 31.1 | 30.4 | 34.0 | |||
| Average Market Price ($) | 69.6 | 59.7 | 72.7 | |||
| Historical P/TB | 2.24x | 1.96x | 2.14x | 2.11x | ||
| Source: Company Financials, Yahoo Finance, Author’s Estimates | ||||||
Multiplying the average P/TB multiple with the forecast tangible book value per share of $37.9 gives a target price of $80.2 for the end of 2023. This price target implies a 10.7% upside from the January 5 closing price. The following table shows the sensitivity of the target price to the P/TB ratio.
| P/TB Multiple | 1.91x | 2.01x | 2.11x | 2.21x | 2.31x |
| TBVPS – Dec 2023 ($) | 37.9 | 37.9 | 37.9 | 37.9 | 37.9 |
| Target Price ($) | 72.6 | 76.4 | 80.2 | 84.0 | 87.8 |
| Market Price ($) | 72.4 | 72.4 | 72.4 | 72.4 | 72.4 |
| Upside/(Downside) | 0.2% | 5.5% | 10.7% | 15.9% | 21.2% |
| Source: Author’s Estimates |
The stock has traded at an average P/E ratio of around 13.0x in the past, as shown below.
| FY19 | FY20 | FY21 | Average | |||
| Earnings per Share ($) | 4.52 | 5.68 | 5.60 | |||
| Average Market Price ($) | 69.6 | 59.7 | 72.7 | |||
| Historical P/E | 15.4x | 10.5x | 13.0x | 13.0x | ||
| Source: Company Financials, Yahoo Finance, Author’s Estimates | ||||||
Multiplying the average P/E multiple with the forecast earnings per share of $6.05 gives a target price of $78.4 for the end of 2023. This price target implies an 8.2% upside from the January 5 closing price. The following table shows the sensitivity of the target price to the P/E ratio.
| P/E Multiple | 11.0x | 12.0x | 13.0x | 14.0x | 15.0x |
| EPS 2023 ($) | 6.05 | 6.05 | 6.05 | 6.05 | 6.05 |
| Target Price ($) | 66.3 | 72.3 | 78.4 | 84.4 | 90.5 |
| Market Price ($) | 72.4 | 72.4 | 72.4 | 72.4 | 72.4 |
| Upside/(Downside) | (8.5)% | (0.1)% | 8.2% | 16.6% | 24.9% |
| Source: Author’s Estimates |
Equally weighting the target prices from the two valuation methods gives a combined target price of $79.3, which implies a 9.5% upside from the current market price. Adding the forward dividend yield gives a total expected return of 12.5%. This expected return isn’t high enough for me; therefore, I’m maintaining a hold rating on Prosperity Bancshares.
Be the first to comment