

AMR Image/E+ via Getty Images
Investment Thesis
Sunrun Inc (NASDAQ:RUN) had previously announced an interesting partnership with Ford (F) in May 2021, for the latter’s newly launched F-150 Lightning electric truck. Through the strategic partnership, Ford encourages its drivers to install RUN’s solar panels with Ford Intelligent Backup Power, including its Ford Charge Station Pro and home integration system. The integrated system would be able to charge the EV while also offering another home backup energy source through the vehicle’s battery.
Interestingly, Ford is among the first few automakers to introduce an EV that offers a bi-directional charging option. Tesla (TSLA) has previously been shown to be against it and voided the vehicle battery’s warranty if the owner was found to be using their vehicle “as a stationary power source.” With multiple automakers reporting robust consumer demand and massive backorders for their EVs despite the rising inflation, we are of the opinion that the brilliant combination of EVs, solar panels, energy storage systems, and bi-directional charging capabilities are the future.
The global EV market is expected to grow tremendously from $246.7B in 2020 to $1.31T by 2028, at a CAGR of 24.3%, with the US market accounting for 10.56% of total demand then. Combined with the massive boost from Biden’s recently lifted solar tariffs and California’s delay in solar subsidy reform, we expect to see RUN record elevated growth for the next two years. This is naturally on top of the frequency and severity of natural disasters in the US in 2021, significantly aided by the elevated electrical bills for the coming winter.
RUN Will Continue To Benefit From The Green Initiatives – Profitability Remains Elusive
S&P Capital IQ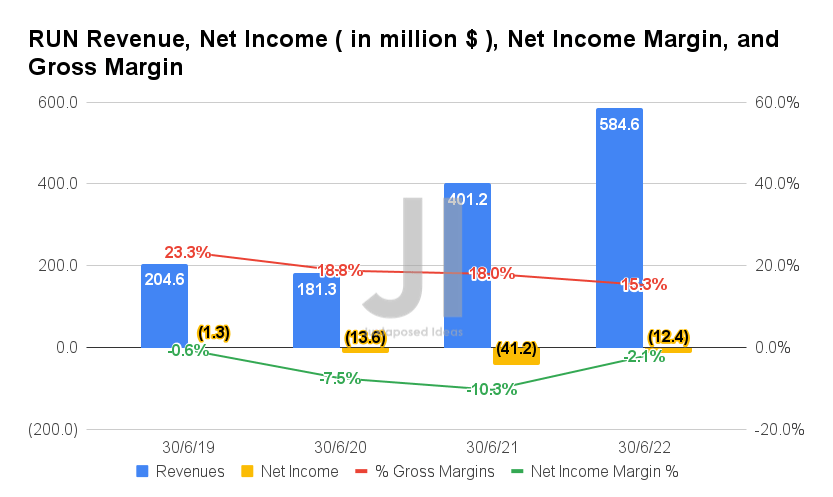
In FQ2’22, RUN reported revenues of $584.6M and gross margins of 15.3%, representing an increase of 45.71% though a decline of -2.7 percentage points YoY, respectively. In contrast, the company reported slight improvements in profitability in the latest quarter, with net incomes of -$12.4M and net income margins of -2.1% in the latest margins, indicating YoY growth of 69.9% and 8.2 percentage points, respectively.
S&P Capital IQ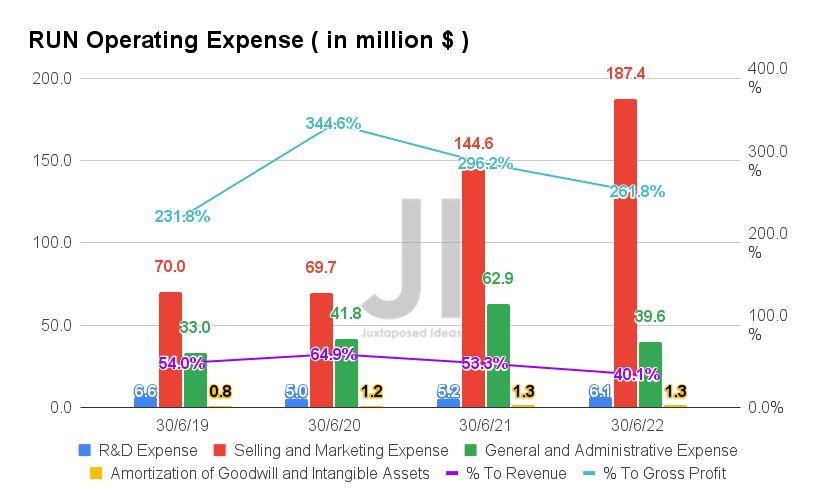
The main reason for RUN’s lack of profitability is its elevated operating expenses of $234.4M in FQ2’22, representing an increase of 9.53% YoY or 213.21% from FQ2’19 levels. Given the narrow gross profit margins, the company reported an unsustainable ratio of 40.1% in expenses to its growing revenue and 261.8% to its gross profits in the latest quarter.
S&P Capital IQ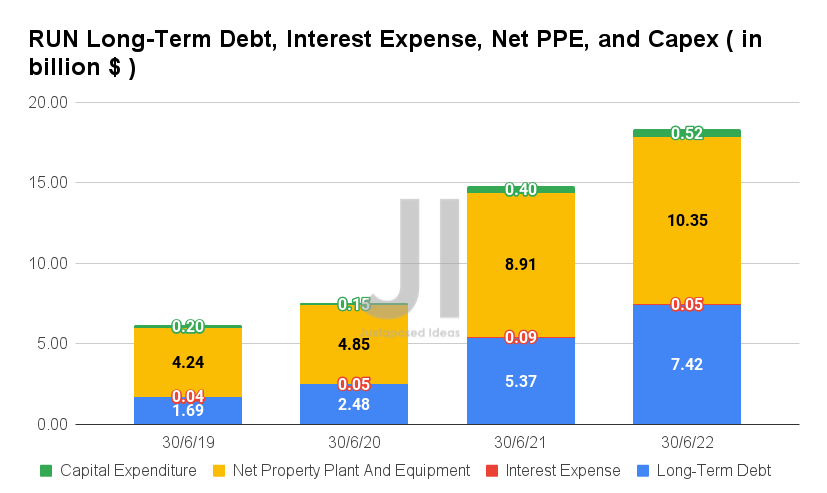
In FQ2’22, RUN also reported elevated long-term debts of $7.42B and interest expenses of $48.67M, representing YoY growth of 38.17% though a moderation of -44.34%, respectively. These have directly coincided with the growth of its net PPE assets to $10.35B and capital expenditure to $0.52B in the latest quarter, indicating an increase of 16.16% and 30% YoY, respectively. Combined with its elevated inventory levels of $547.42M, these investments would eventually be top-line accretive, due to the massive global shift towards renewable energy due to the record-high oil/gas prices and electricity bills.
Investors also need not worry about RUN’s liquidity over the next few quarters, since only $927M of its debts will be maturing by 2024 and $550M by 2025. However, it is rather likely that more debt leveraging is necessary for refinancing then.
S&P Capital IQ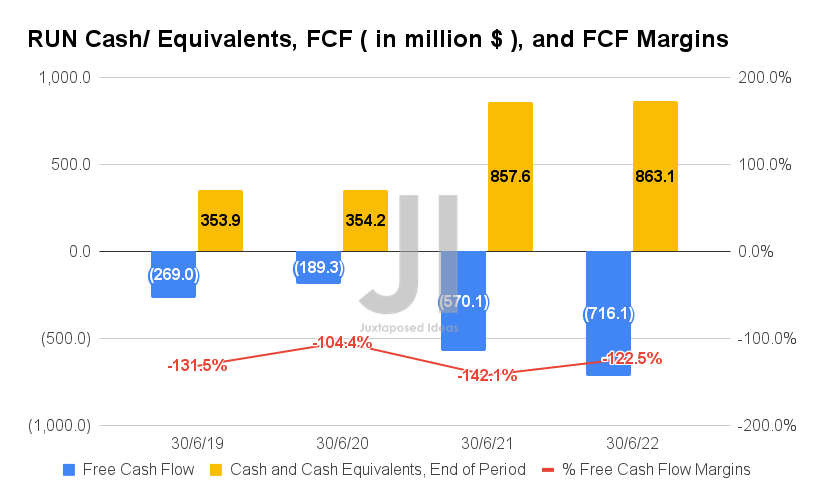
Nonetheless, given its worsening profitability and aggressive Capex, RUN reported a lower Free Cash Flow ((or FCF)) generation of -$716.1M and an FCF margin of -122.5% in FQ2’22. It represented a decline of -25.6% though a moderation of 19.6 percentage points YoY, respectively. In the meantime, the company appears to be well poised for the worsening macroeconomics, with decent cash and equivalents of $863.1M in the latest quarter.
S&P Capital IQ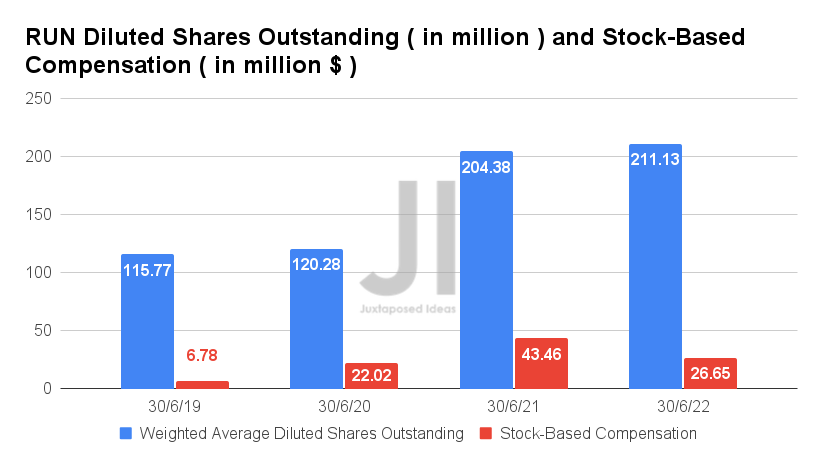
As a result, RUN continues to rely on Stock-Based Compensation (SBC) with $26.65M reported in FQ2’22. Though this may seem like a decline of -38.67% YoY, investors must note that the company reported an eye-watering sum in SBC expenses of $418.13M in the past eight quarters, with deepening net losses of -$311.5M at the same time. Combined with its $3.2B all-stock acquisition of Vivint in July 2022, long-term RUN investors have been easily diluted by 82.37% since FQ2’19. Otherwise, 207.94% since its IPO in 2015.
For now, these numbers still look relatively controlled for a growing company. However, since RUN is not expected to report profitability through FY2024, we will likely see moderate growth in its share count ahead. Investors, take note.
S&P Capital IQ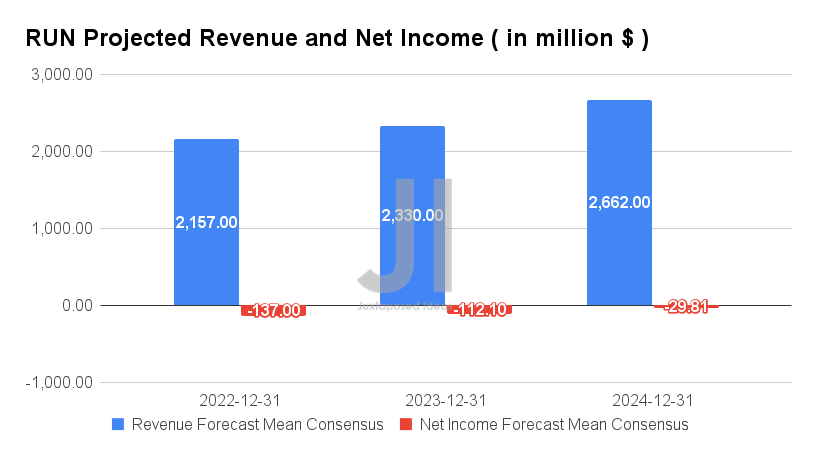
Over the next three years, RUN is expected to report decent revenue growth at a CAGR of 18.27%, while remaining unprofitable with net incomes of -$29.81M by FY2024. A persistent cash burn is evident for the company, given its worsening net income margins from 3.1% in FY2019, to -4.9% in FY2021, and finally to a projected -11.98% by FY2024.
For FY2022, RUN is expected to report revenues of $2.15B and net incomes of -$137M, representing an increase of 33.97% though a decline of -72.5% YoY, respectively. Despite its position as a leading solar company in the US, it is unfortunate that RUN continues to be plagued by narrow profit margins and elevated operating expenses over the next three years.
So, Is RUN Stock A Buy, Sell, or Hold?
RUN 5Y EV/Revenue and P/E Valuations
S&P Capital IQ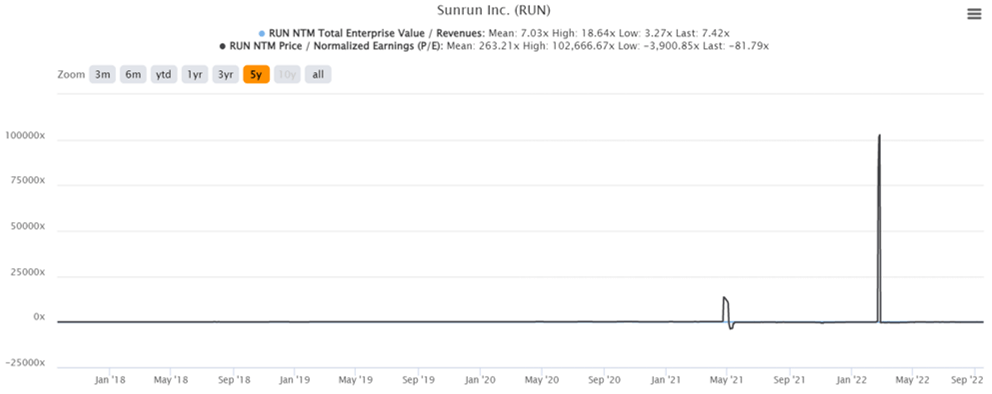
RUN is currently trading at an EV/NTM Revenue of 7.42x and NTM P/E of -81.79x, lower than its 5Y mean of 8.75x and 428.06x, respectively. The stock is also trading at $37.05, down -38.86% from its 52 weeks high of $60.60, though at a premium of 220.53% from its 52 weeks low of $16.80. Consensus estimates remain bullish about RUN’s prospects, given their price target of $47.10 and a 27.13% upside from current prices.
RUN 5Y Stock Price
Seeking Alpha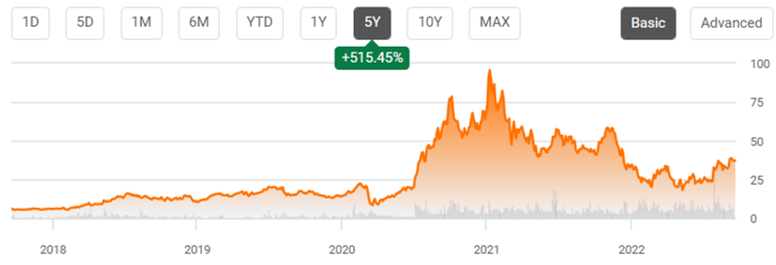
Given the multitude of factors discussed above, we surmise that there are better and more profitable green energy plays out there, such as Enphase (ENPH). Otherwise, a more speculative play based in China, such as Daqo New Energy (NYSE:DQ), if one is up for some geopolitical volatility.
In the meantime, the bulls may continue holding the stock, since the recent rally may hold over the next few weeks before thoroughly digested along with the worsening macroeconomics through H1’23. Investors keen on trimming their positions may potentially do so at current levels as well, since we expect to see a moderate retracement once the Fed hikes interest rates on 21 September and November 2022.
Be the first to comment