

BalkansCat
Big energy names have been consolidating gains since the economic shock of Russia’s war against Ukraine put Europe in a bind for supplies. The initial upside oil/gas price reaction (based in fear) has been trying to rebalance supply/demand since April. In my personal trading, during September, I have moved from a bearish stance on a majority of petroleum production names into a more neutral outlook.
I would not categorize the current investment environment as entirely safe for many oil/gas outfits, but some sort of exposure to the sector seems to be warranted. Unlike the 2020 crude oil bust situation was an undeniably great time to purchase energy assets, I would categorize today’s marketplace for fossil fuel stocks as extended in the cycle, but with possibly a few more innings to go (months or years).
When I review the raw numbers for earnings, cash flow, and dividends in 2022 and forecast into 2023 by Wall Street analysts, one name with superior diversification characteristics stands out as the cheapest long-term buy idea presently. Suncor (NYSE:SU), the largest Canadian energy company (by total assets), may be best positioned for rising oil/gas prices next year, if that is our future. It is the most intriguing buy proposition in the North American integrated oil space and matches up well for a valuation against exploration & production-only firms. If you leave past investment success, trading emotions, and favoritism at the door, I suggest the company as a solid core holding, risk-adjusted for its sizable and politically-safe reserve profile, running a breadth of upstream to downstream assets.
Background
I have talked about Suncor in the past on Seeking Alpha, initially many years ago in 2014 as a bullish investment idea in the important oil/gas sector. Total returns, including dividends and price appreciation, since this suggestion have been minimal, under +5% annualized. I also mentioned Suncor as a strong Canadian energy asset buy in May 2020 here, with much better gains achieved, above +100% for a total return over the last 28 months (almost +40% annualized).
However, I have been relatively bearish on big energy names since the Russian invasion of Ukraine. I even wrote articles on selling Occidental Petroleum (OXY) here and Chevron (CVX) here into summertime. Warren Buffett’s Berkshire Hathaway (BRK.A) (BRK.B) purchase spree in the two names effectively pushed them into an overvaluation zone vs. peers.
Well, crude oil prices have weakened off the $130 a barrel spike high in the spring and are now back into a more normal range of $80-85. Today, I find it hard to predict whether a global demand recession will pull price markedly lower, or further supply shocks this winter from Russia will keep balance tilted toward shortages. I suggested in early September here the use of United States Oil ETF (USO) units as a hedge in portfolio construction, with backwardation in the futures market helping support its price for the time being. In my research and analysis, the odds of sub-$70 crude and much lower natural gas pricing are about the same as another spike above $100 a barrel with $8+ per MMBtu natural gas sticking around through the winter months.
StockCharts – Light Crude Oil Nearest Futures, 18 Months of Daily Trading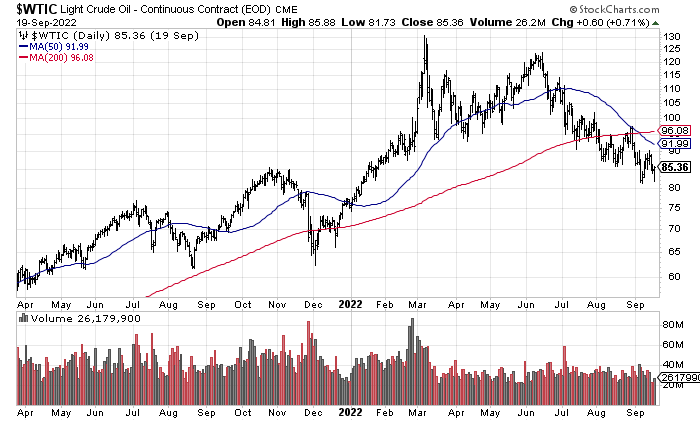
StockCharts – Natural Gas Nearest Futures, 18 Months of Daily Trading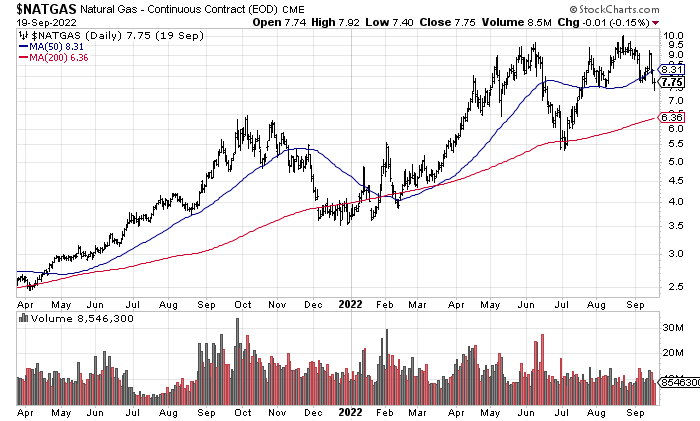
Superb Valuation Setup
Again, the main Suncor draw for me is raw cash generation vs. peers. There are a number of big oil names you can compare/contrast, and potentially acquire as a new shareholder. My argument is commodity businesses should be owned as a function of cash generation, longevity of assets (reserves), and safety considerations. This investment scores highly on all three.
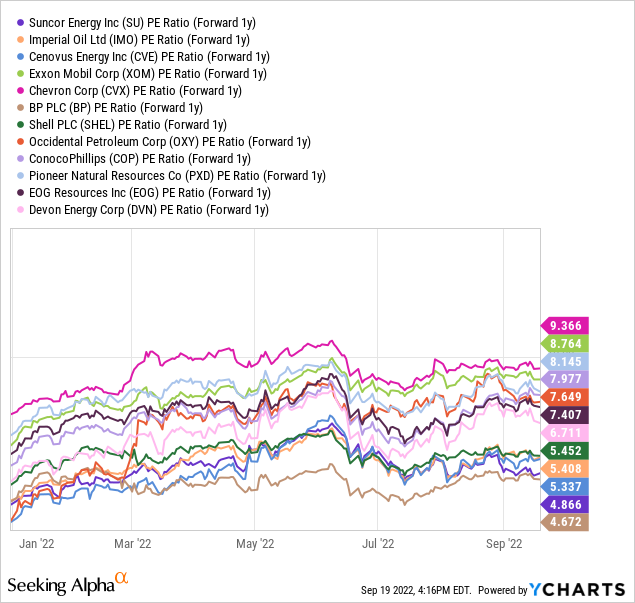
Below is a graph of the basic price to trailing 12-month earnings ratio. Suncor is near the bottom of the list at 6x vs. its closest North American peers and competitors Imperial Oil (IMO), Cenovus Energy (CVE), Exxon Mobil (XOM), Chevron, BP p.l.c. (BP), Shell plc (SHEL), Occidental Petroleum, ConocoPhillips (COP), Pioneer Natural Resources (PXD), EOG Resources (EOG), and Devon Energy (DVN). Its forward 1-year outlook and valuation of 4.9x from Wall Street analysts is next to the cheapest.
YCharts, Big Energy P/Es – Past Year YCharts, Big Energy Forward Projected P/Es – YTD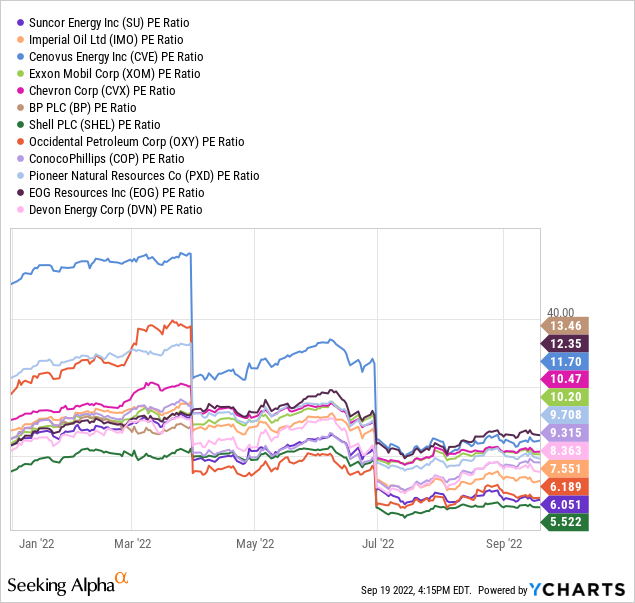
But that’s only half the earnings story. What I like most is this low earnings valuation is also a function of the highest net profit margin (nearly 18%) of the largest “integrated” oil concerns, namely Chevron, Exxon, Imperial, Cenovus, Shell, and BP.
YCharts, Big Energy Trailing 12-Month Profit Margins – 1 Year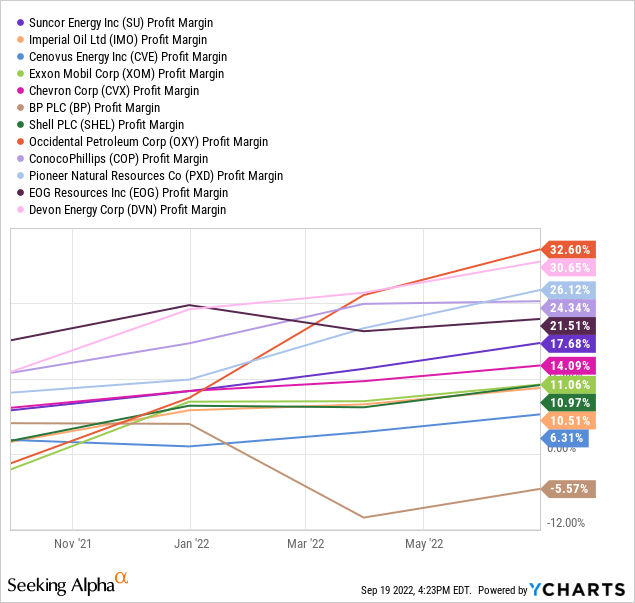
In addition, the Canadian giants of Suncor, Cenovus, and Imperial are witnessing the strongest earnings growth in 2022, with projections of cash generation remaining higher longer than other investment options in the oil/gas sector.
YCharts, Big Energy Projected EPS Growth – 2022-24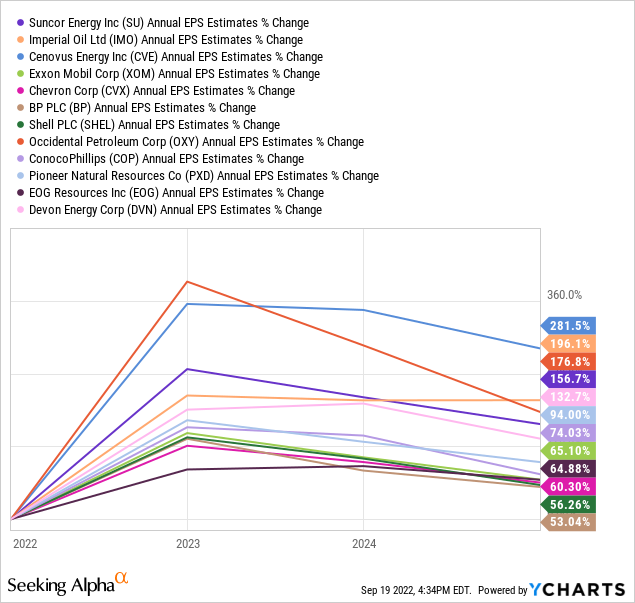
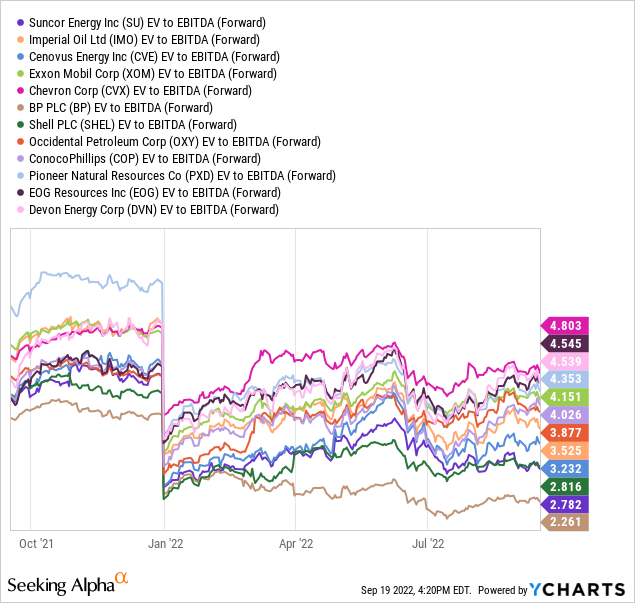
When you make balance sheet adjustments to the equity quote, from cash and debt held, Suncor looks even less expensive vs. the group. Enterprise value to EBITDA (earnings before interest, taxes, depreciation and amortization) is approaching the lowest number of the big oil names, both on a trailing (3.4x) and forward (2.8x) basis.
YCharts, Big Energy EV to Trailing EBITDA – 1 Year YCharts, Big Energy EV to Forward EBITDA – 1 Year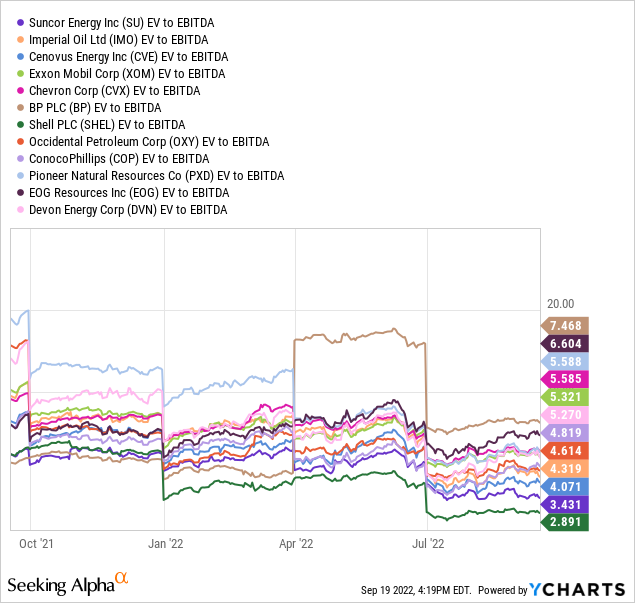
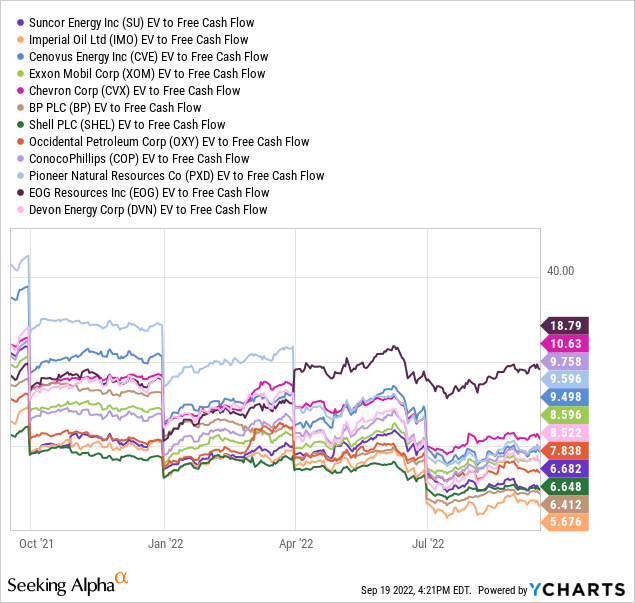
Price and EV comparisons to free cash flow generation are also in the bottom quarter for a valuation (5.8x on price, 6.7x on EV). Everyone in the oil business is focused on “free” cash flow right now, and Suncor appears to be a terrific pick using this data point.
YCharts, Big Energy Price to Trailing Free Cash Flow – 1 Year YCharts, Big Energy EV to Trailing Free Cash Flow – 1 Year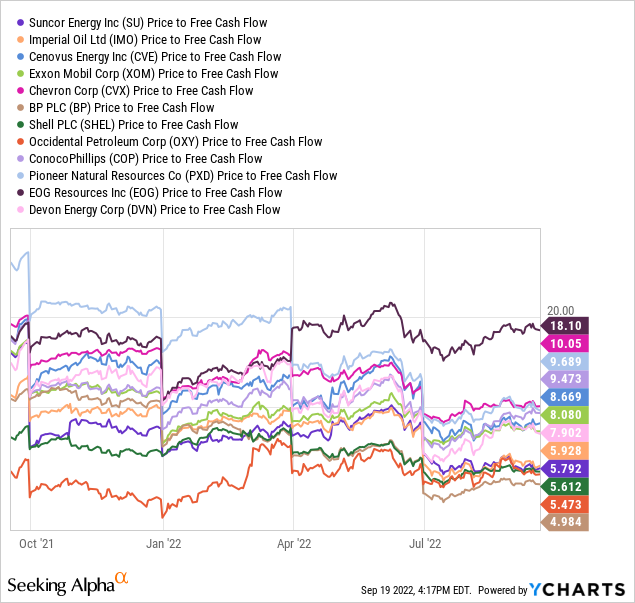
For long-term investors, the future stock price is important, but getting a cash dividend from oil investments has been a traditional reason to own them. In this respect, Suncor now sports the top trailing dividend yield at 4.45% of the major integrated giants. Devon and Pioneer have paid out more over the last 12 months as a percentage of today’s equity quote level, but they are less diversified and far more cyclical for earnings and distribution yields historically.
YCharts, Big Energy Trailing 12-Month Dividend Yields – 1 Year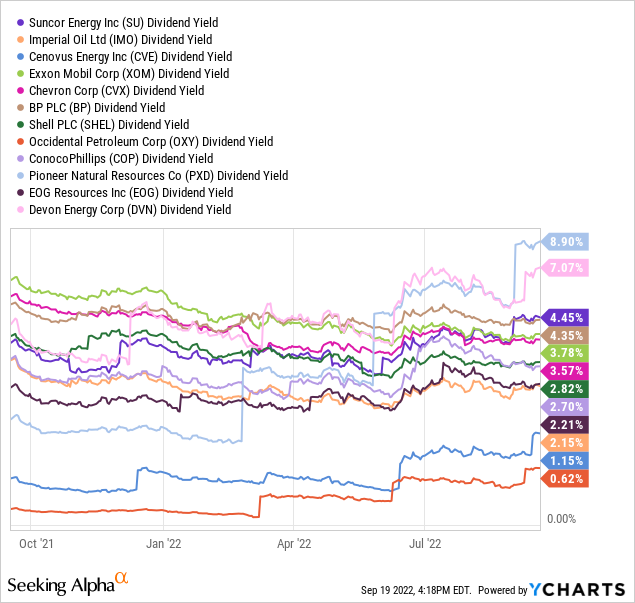
Finally, for the value-conscious investor, price to tangible book value for Suncor is nearly the best on the list. If you want to own hard assets backing up your investment, this Canadian oil investment has you covered better (close to par) than other major oil names outside of EOG, given a sector downturn.
YCharts, Big Energy Price to Tangible Book Value – 1 Year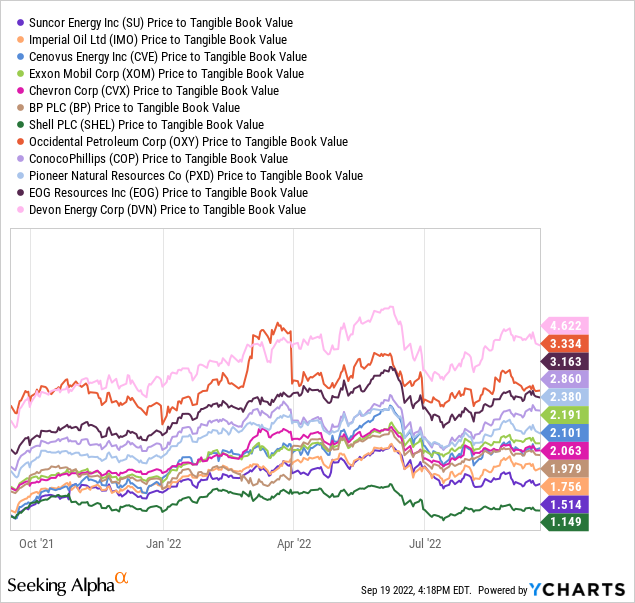
Final Thoughts
For a summary of my buy thesis, Suncor is the bargain choice of the major integrated energy giants, especially after considering higher profit margins on sales and dividend payouts for a cash yield. Its assets are all located in super-safe North America, unlike many of its diversified rivals in the retail gas station, midstream processing/transportation, and E&P operating world.
If you are searching for a single investment with strong current profit/cash returns on investment and significant upside leverage to rising oil/gas commodity prices, I nominate Suncor as the leading choice for energy industry buying in September 2022.
The trading chart below shows concrete upside momentum in many of the indicators I track, and price support around $30 a share should hold (near the 200-day moving average), outside of a monster stock market decline in coming weeks.
StockCharts – SU, 18 Months of Daily Trading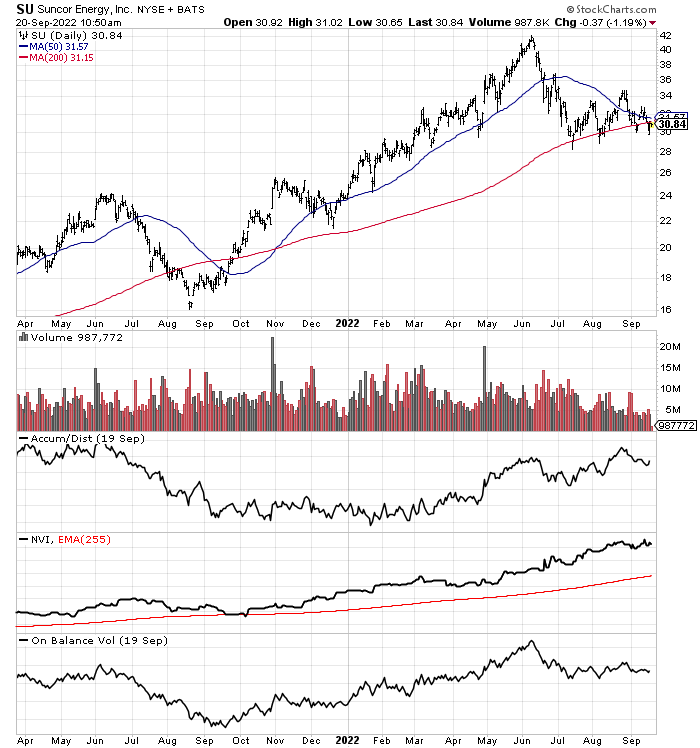
I rate the stock a Buy, with Strong Buy territory closer to $26 given a deep recession and/or U.S. equity market wipeout into October-November. If you don’t already own Suncor and are wanting to increase your oil/gas exposure, my research suggests this investment could be a top choice for buyers today.
Thanks for reading. Please consider this article a first step in your due diligence process. Consulting with a registered and experienced investment advisor is recommended before making any trade.
Be the first to comment