

dan_prat
In the third quarter of 2023, Suncor Energy Inc. (NYSE:SU) reported an adjusted funds from operations (“FFO”) of $4473 million, compared with $2641 million in 3Q 2021 and $5345 million in 2Q 2022. Due to the hiked oil prices in 2022, SU was able to increase its dividend from $0.21 per share in 3Q 2021 to $0.47 per share in 3Q 2022. As the EU embargo on Russian Oil starts in December and OPEC+ decreased its production, oil prices are supported and SU will continue benefiting from the market condition. However, it is not wise to expect the company to report 4Q 2022 and 1Q 2023 quarterly results that are as strong as in 2Q 2022 and 3Q 2022. The stock is a buy.
Quarterly results
According to its 3Q 2022 financial results, Suncor Energy’s free funds flow increased from $1420 million in 3Q 2021 to $3094 million in 3Q 2022. SU reported a total production volume of 724 mboe/d in 3Q 2022, compared with 699 mboe/d in 3Q 2022. In the oil sands segment, SU’s operating revenues (net of royalties) increased from $4473 million in 3Q 2021 to $6706 million in 3Q 2022.
Also, in the oil sands segment, Suncor’s adjusted operating earnings increased from $635 million in 3Q 2021 to $2195 million in 3Q 2022, driven by hiked oil prices and higher sales volumes, partially offset by increased royalties and operating & transportation expenses. Suncor Energy reported a 3Q 2022 net loss of $609 million, compared with 3Q 2021 net earnings of $877 million, as a result of a non-cash impairment charge of $3397 million against the company’s share of the Fort Hills assets.
In the exploration and production segment, SU’s operating revenues (net of royalties) increased from $590 million in 3Q 2021 to $637 million in 3Q 2022. Also, the company’s adjusted operating earnings increased from $369 million in 3Q 2021 to $555 million in 3Q 2022, driven by higher sales volumes, and increased realized prices, partially offset by higher royalties and operating & transportation expenses:
“As we drive the focus of the company on operational execution, we delivered $4.5 billion in adjusted funds from operations in the third quarter, the second highest in the company’s history, driven by strong refinery throughput in the downstream, delivery of solid upstream production as we executed planned maintenance, consistent with what we have previously communicated, and a solid business environment,”
interim CEO Kris Smith said.
“We returned approximately $1.7 billion of value to shareholders during the third quarter, and the recently completed debt tender of approximately $3.6 billion represents structural long-term debt reduction,”
he continued.
The market outlook
As a result of the embargo on Russian crude oil imports that comes into effect in December 2022, and the OPEC+ production cut by 2mb/d, I expect European countries’ oil imports from the United States and Canada to increase in the following months. Figure 1 shows that Brent crude oil price increased from $81 per barrel on 26 September to $97 per barrel on 7 November.
Furthermore, the Energy Information Administration (EIA) expects world petroleum and other liquids production and consumption to increase in 2023 (see Figure 2). Total world petroleum and other liquids production and consumption in all of the quarters of 2023 are expected to exceed 100 million barrels per day. Canada’s petroleum and other liquids production was 5.65 mb/d in 3Q 2022. It is expected to increase to 5.90 mb/d in 4Q 2022 and 5.95 in 1Q 2023. Canada’s petroleum and other liquids production will increase to 6.10mb/d in the fourth quarter of 2023. On the other hand, Canada’s petroleum and other liquids consumption is expected to decrease from 2.31 mb/d in 2022 to 2.34 mb/d in 2023.
Figure 1 – Brent crude oil prices
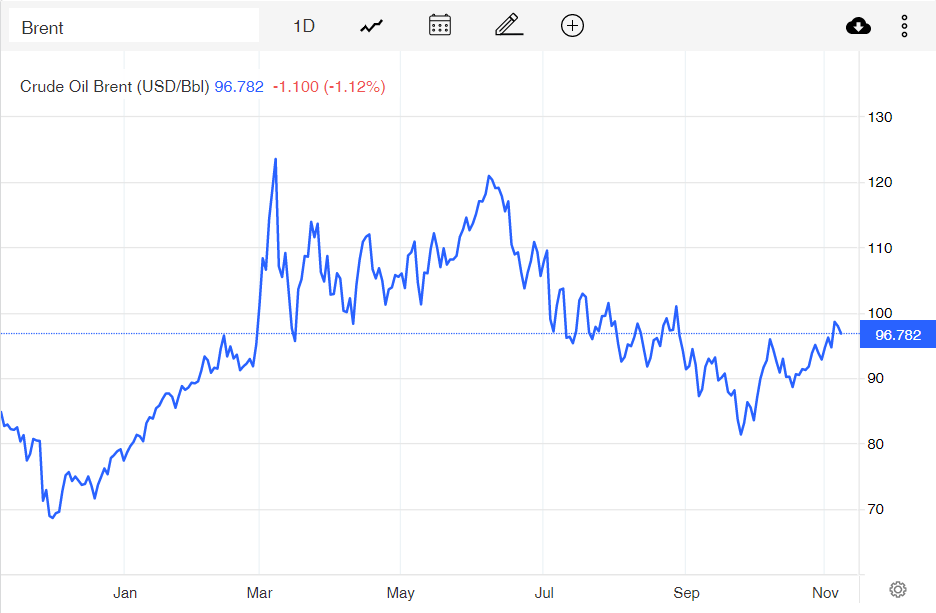
tradingeconomics.com
Figure 2 – International petroleum and other liquids production and consumption
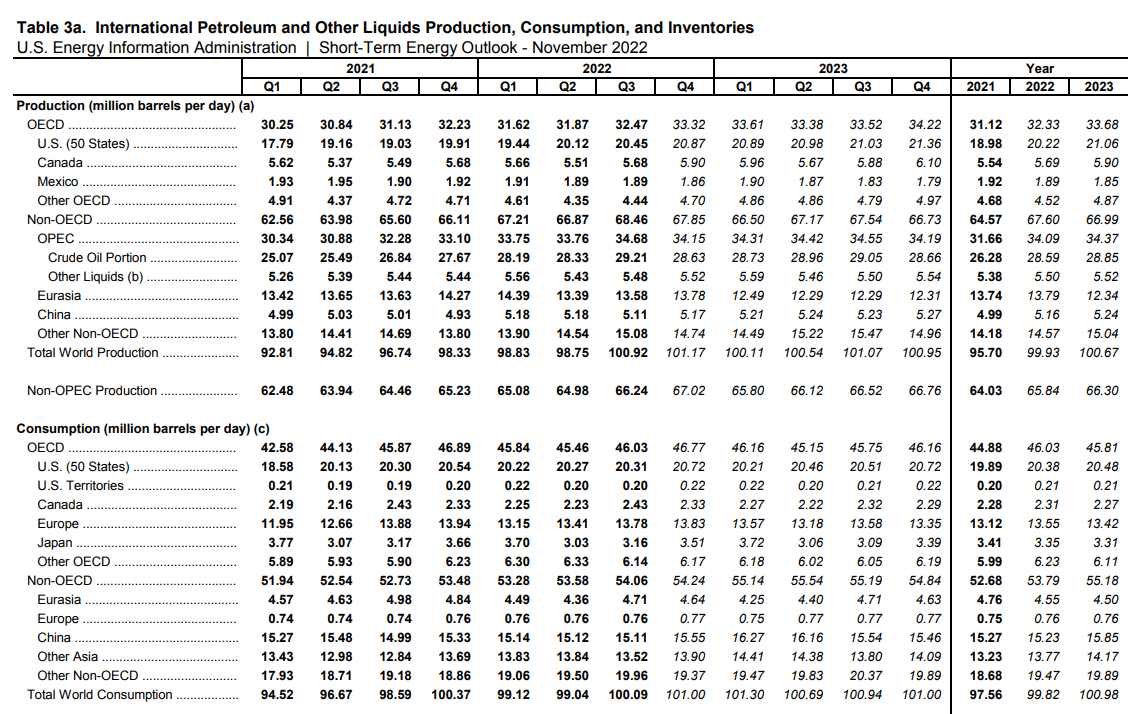
eia
Figure 3 shows that Brent crude oil price in the fourth quarter of 2022 will be lower than in 3Q 2022. However, EIA expects Brent crude oil price to increase and reach $97.65 per barrel in 4Q 2023. Also, WTI crude oil price will decrease from $93.07 per barrel in 3Q 2022 to $85.67 per barrel in 4Q 2022. In the first quarter of 2023, WRI crude oil price will be $87.67 per barrel and is expected to increase to $91.65 in the fourth quarter of 2023. Furthermore, retail heating oil and diesel prices are expected to be more than $5 per gallon for the rest of 4Q22. Due to the EU’s ban on seaborne imports of petroleum products from Russia, fuel oil and diesel prices will remain high in 2023.
According to the production levels and prices of crude oil, the global demand for North American oil as a result of the EU import ban on Russian oil and the energy crisis in Europe, and the increasing consumer expenditures for heating fuels during the winter season in the United States and Canada, SU’s 4Q 2022 results will be stronger than in 4Q 2021. However, the company’s financial results will not be as strong as in 2Q 2022 and 3Q 2022.
Figure 3 – Crude oil prices outlook
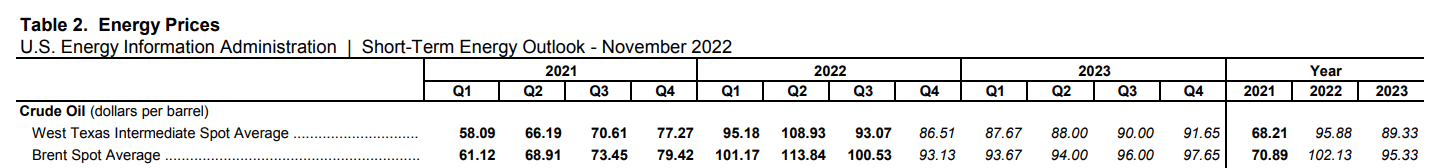
eia
Performance outlook
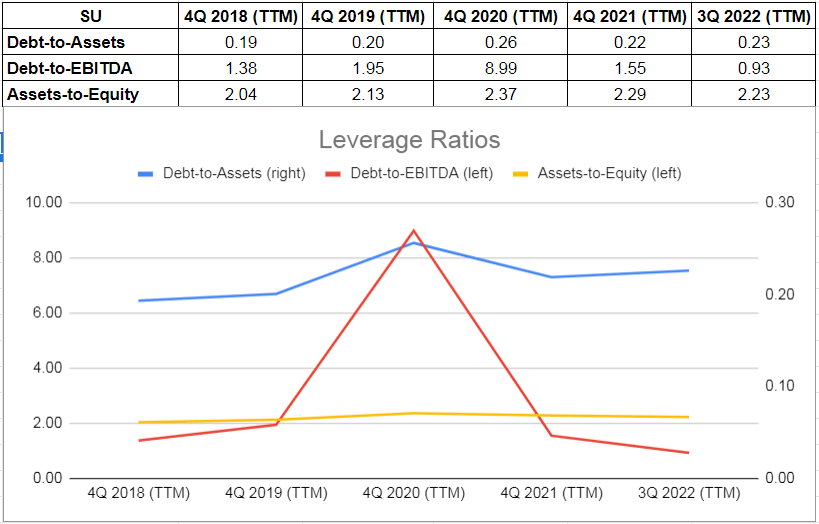
The debt-to-assets ratio is one of the significant calculations that measure the company’s debt capacity. This ratio indicates the proportion of assets that are being financed with debt. The higher the ratio, the greater the degree of leverage and financial risks. The company’s debt-to-asset ratio increased from 0.19 in 2018 to 0.20 in 2019 and jumped to 0.26 at the end of 2020. However, as oil prices increased and oil demand hiked, SU’s debt-to-asset ratio decreased.
The company’s debt-to-asset ratio was 0.22 at the end of 2021 and 0.23 on 30 September 2022. Moreover, SU’s debt-to-EBITDA ratio, which determines the probability of defaulting on debt, decreased from 8.99 at the end of 2020 to 1.55 at the end of 2021 and to 0.93 on 30 September 2022. The company’s debt-to-EBITDA as of 30 September 2022 is lower than its pre-pandemic levels. Finally, SU’s asset-to-equity ratio increased from 2.04 at the end of 2018 to 2.37 at the end of 2020.
Due to better performance as a result of increased energy demand, SU’s asset-to-equity ratio decreased to 2.29 at the end of 2021 and 2.23 on 30 September 2022. The decreasing assets-to-equity ratio during the past years indicates that the company has been using lower debt to finance its assets. “In support of its debt reduction and annual capital allocation targets, the company reduced net debt by approximately $1.8 billion in the third quarter of 2022,” the company announced. As a result, the leverage ratios of Suncor Energy show it can meet its current and future obligations (see Figure 5).
Figure 5 – SU’s leverage ratios
Author (based on SA data)
Summary
In terms of the market condition, due to hiked oil prices, SU will continue selling its SCO & products at significant premiums. The company’s adjusted funds flow from operations and adjusted operating earnings this winter (October 2022 to March 2023) will be better than last winter. I am bullish on the stock. However, keep in mind that with current oil prices and the energy market outlook, Suncor Energy Inc.’s upcoming results will not be as strong as in the two previous quarters.
Be the first to comment