

Euro Dollar (EUR/USD) Talking points
- Euro Dollar stagnates as the US celebrates President’s Day
- EUR/USD breaches trendline resistance around 1.069. Can bulls retest 1.070 psychological level?
- Risk events for the week include sentiment and inflation data for Europe and FOMC minutes
Recommended by Tammy Da Costa
How to Trade EUR/USD
EUR/USD has managed to find temporary support above 1.066, pushing prices into another tight range around 1.069. With the major currency pair currently vulnerable to political and fundamental headwinds, a public holiday in the US (Presidents Day) has contributed to today’s lackluster momentum.
As market participants continue to focus on central bank policy and recession risks, the economic docket could contribute to driving volatility for the remainder of the week.
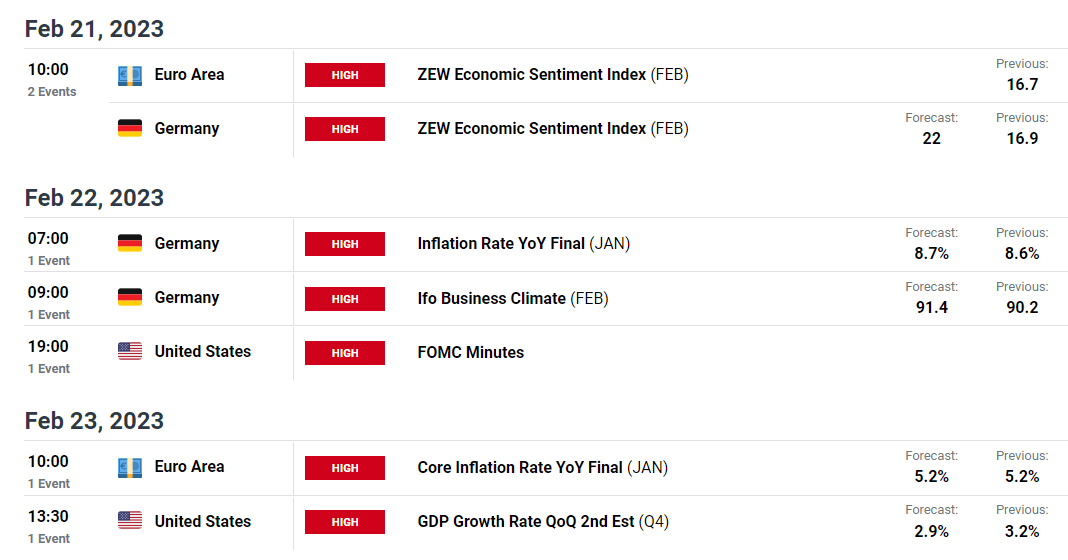
DailyFX Economic Calendar
Although expectations of higher rates have already been priced in, diminishing growth prospects have raised question on when central banks may pivot.
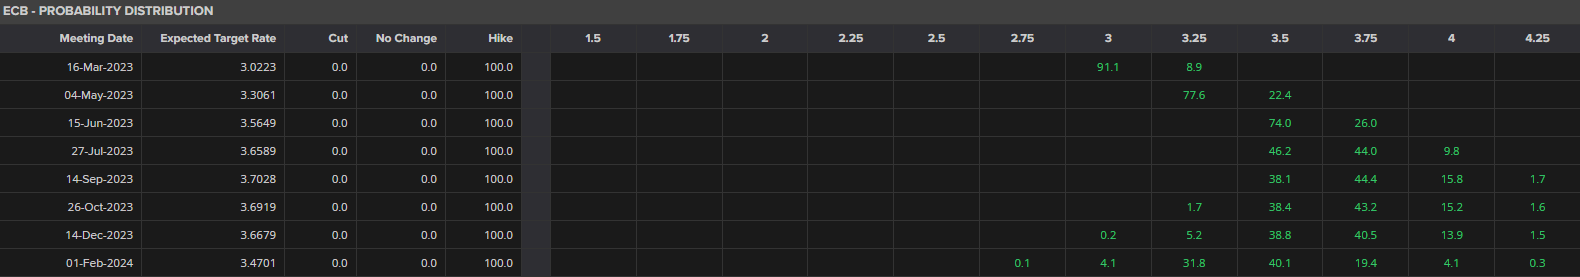
Keep track of interest rate decisions by visiting our Central Bank Calendar
In anticipation of Wednesday’s FOMC minutes, rate expectations will likely remain at the forefront of risk sentiment. While the Federal Reserve and the ECB (European Central Bank) have reconfirmed their commitment to taming inflation through additional rate hikes, higher rates and persistent price pressures continue to weigh on consumers.
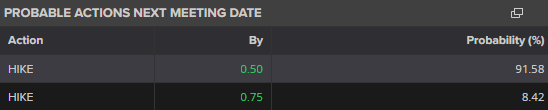
Meanwhile, for Europe, ZEW sentiment data for the Euro and Germany will help provide insight into how analysts expect the economy to perform over the next six months. While inflation data could help set the stage for the ECB who are expected to raise rates by an additional 50-basis points (0.5%) in March.
Source: Refinitiv
EUR/USD Technical Analysis
After the formation of a hammer candle on Friday, a bounce off Fibonacci support at 1.061 (the 38.2% Fibonacci of the 2021 move), drove prices to the trendline resistance (from the Feb high) around 1.069.
As the ATR (average true range) on the daily chart continues to decline (indicating low volatility), the combination of economic sentiment, inflation and rate expectations may assist in helping EUR/USD break the current range if the data delivers any surprises that could force investors to reprice changes in the fundamental backdrop.
Visit DailyFX Education to discover how to use ATR (average true range) to measure volatility in financial markets
With the 1.070 psychological level just above, the 50-day MA (moving average) has formed an additional barrier of resistance around 1.073.
EUR/USD Daily Chart
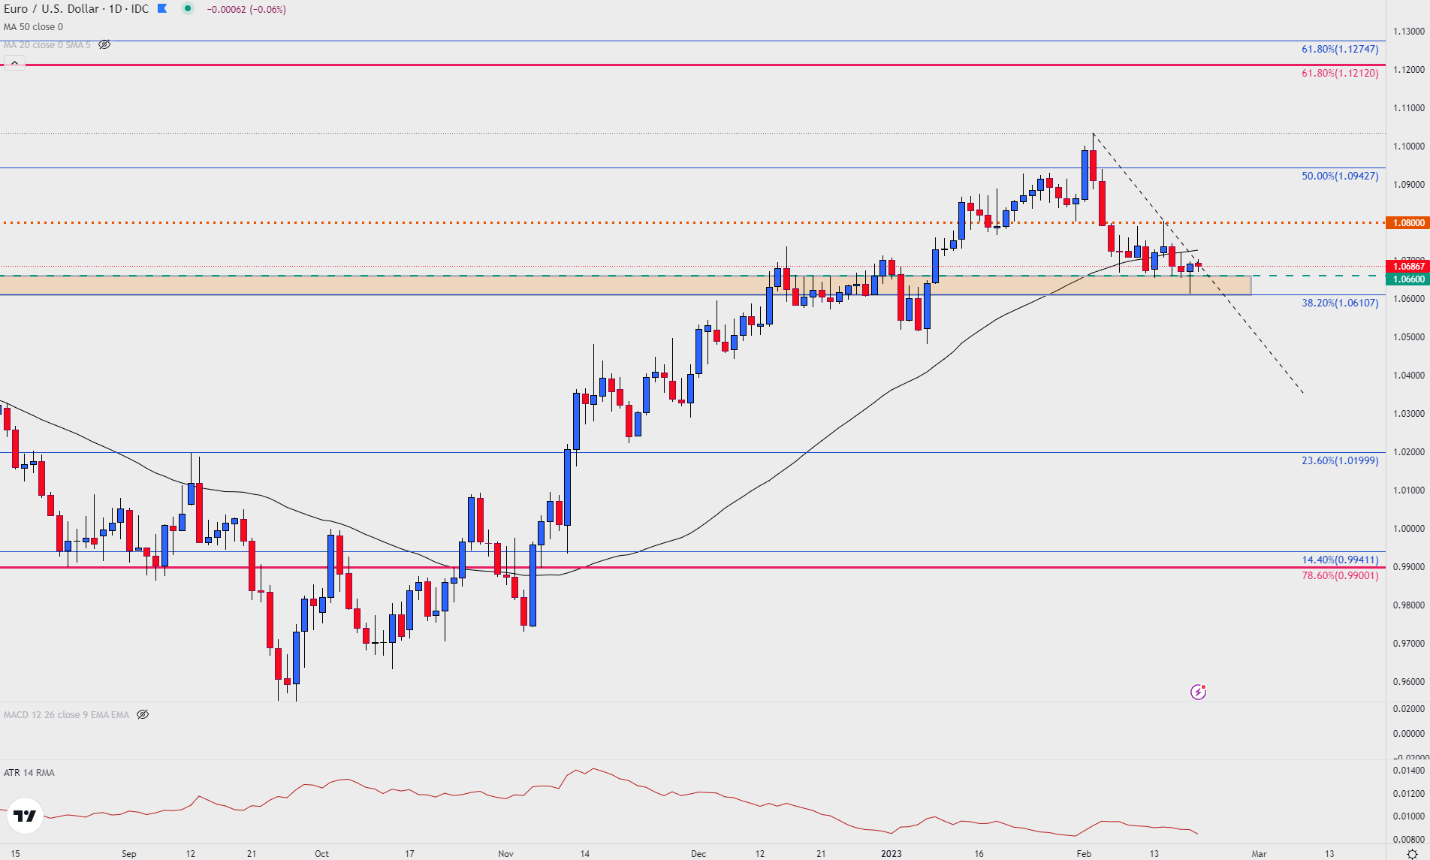
Chart prepared by Tammy Da Costa using TradingView
| Change in | Longs | Shorts | OI |
| Daily | 17% | 10% | 14% |
| Weekly | -2% | 9% | 3% |
— Written by Tammy Da Costa, Analyst for DailyFX.com
Contact and follow Tammy on Twitter: @Tams707
Be the first to comment