

Andrey Zhuravlev/iStock via Getty Images
Q3 recap and investment thesis
Suncor Energy (NYSE:SU) recently reported its Q3 earnings report (“ER”). It was another superb quarter for the company. If you recall, its profits in Q2 already more than tripled on a 78% revenue advance YoY. Its robust profitability continued into Q3 with all the profit drivers firing at full power: higher crude oil and gas prices, production ramp-up, high gasoline retail prices, and high refinery and refinery utilization. To wit, its Q3 Non-GAAP EPS came in at $1.88, beating consensus estimates by $0.43 (translating to almost a 30% beat in relative terms). Adjusted cash from operations (“CFO”) rose to $4.47B (or $3.28 per share), almost 70% above the level during the same period a year ago ($2.64B or $1.79 per common share).
in terms of its stock prices, it attempted, but failed, to break out its $42.5 record price back in May 2022 as you can see from the following chart. The stock is on its way to stage another attempt at the $42.5 level, which is only about 18.1% above its current price ($36 as of this writing). My thesis here is that it will have a much better chance of breaking out this time given the catalysts reported in Q3 (as to be elaborated next). Furthermore, if it does, the stock could easily run to $60 per share in the near term, representing a 70%+ upside from here.
Source: author based on Yahoo! Finance data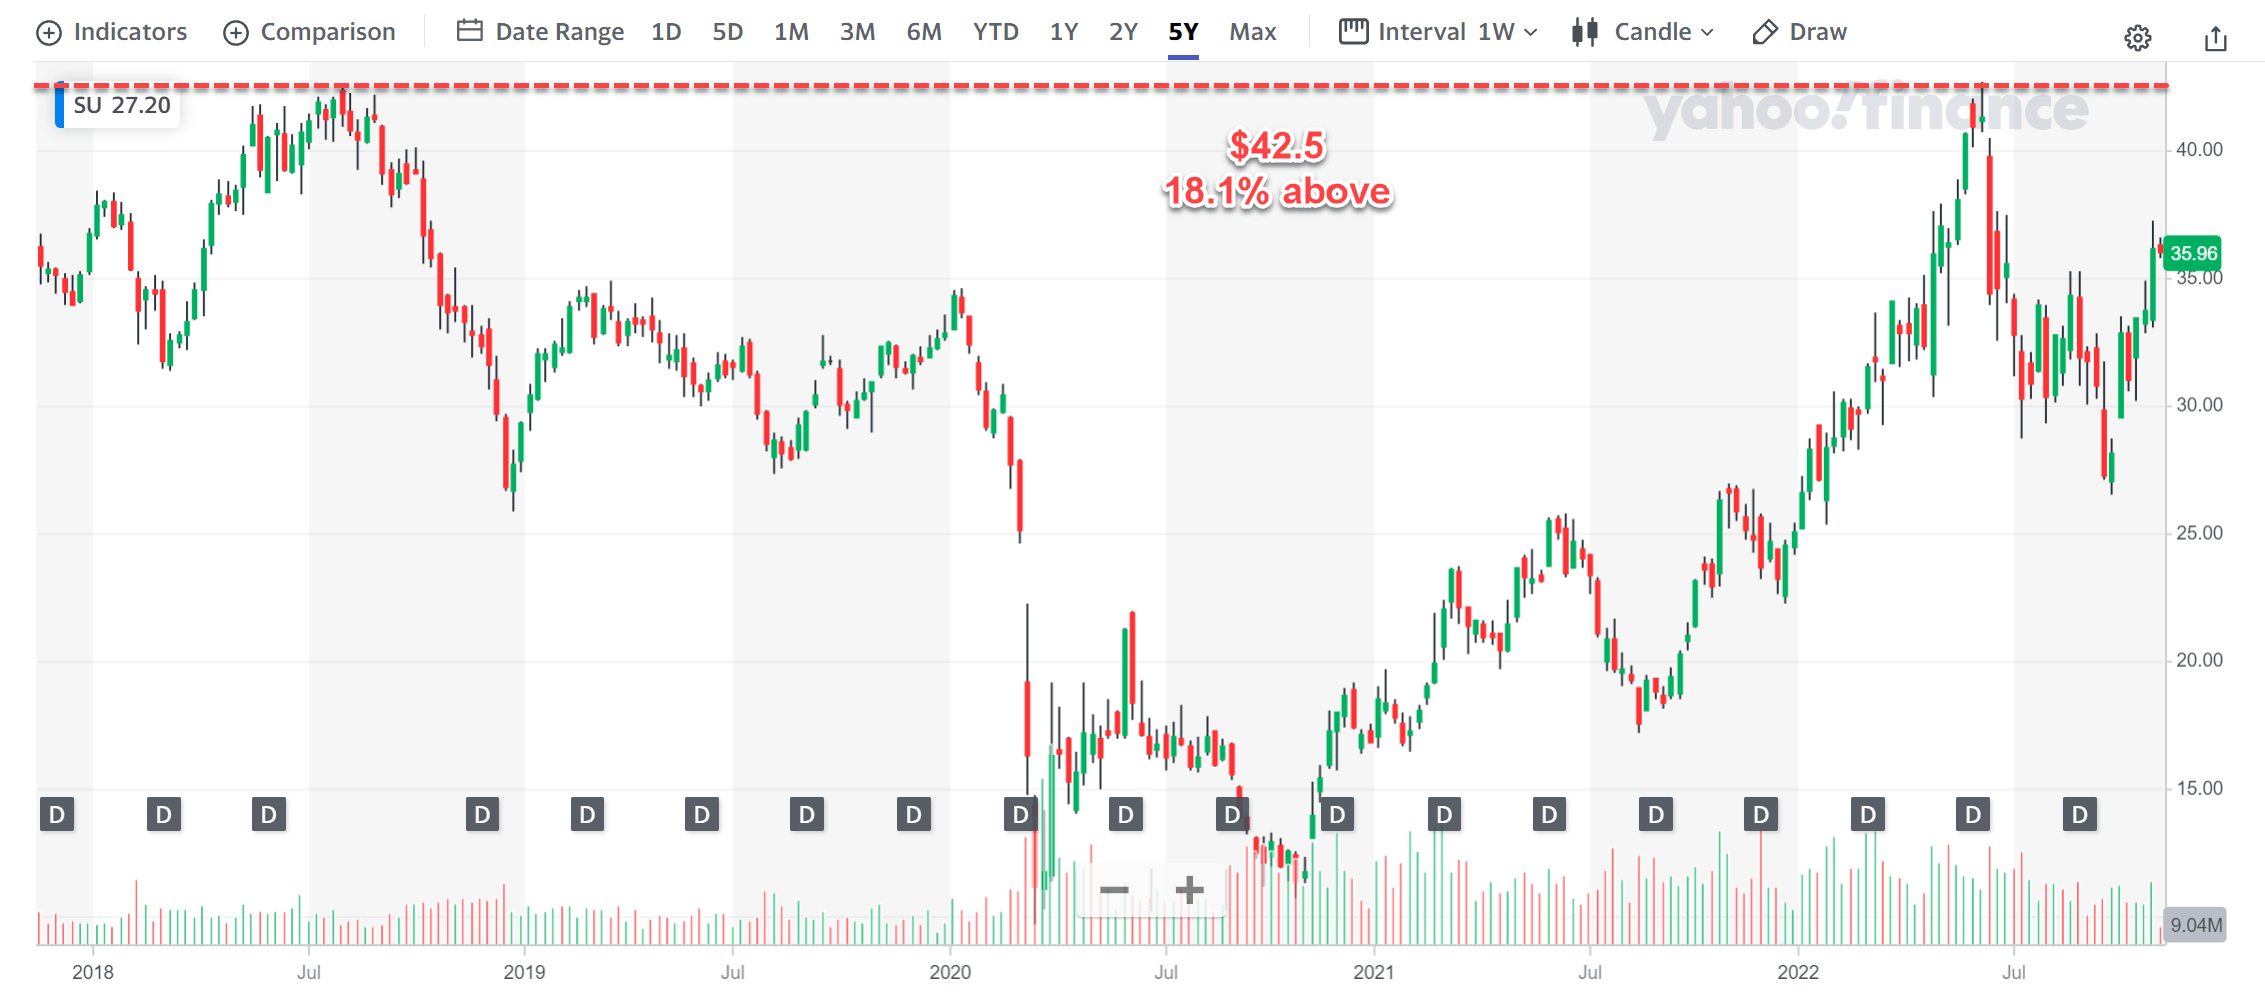
Well poised for long-term growth
First, let’s take a broader view and look beyond the immediate Q3 results. As you can see from the chart below, the company has been constrained in its capital allocation flexibilities in the past. In the past ten years since 2012, the company has suffered systematic underinvestment in itself. To be more specific, its total depreciation and amortization (DA, on average $5.58B per year) consistently exceeded its capital expenditures in the same period (on average $4.93B per year). However, thanks to the recent profitability boosts, the business now enjoys excellent capital allocation flexibility and resumed investing aggressively toward growth starting in 2021 as seen. To wit, its total DA currently hovers around $4.15B and its total CAPEX is around $3.73B.
Source: Seeking Alpha data.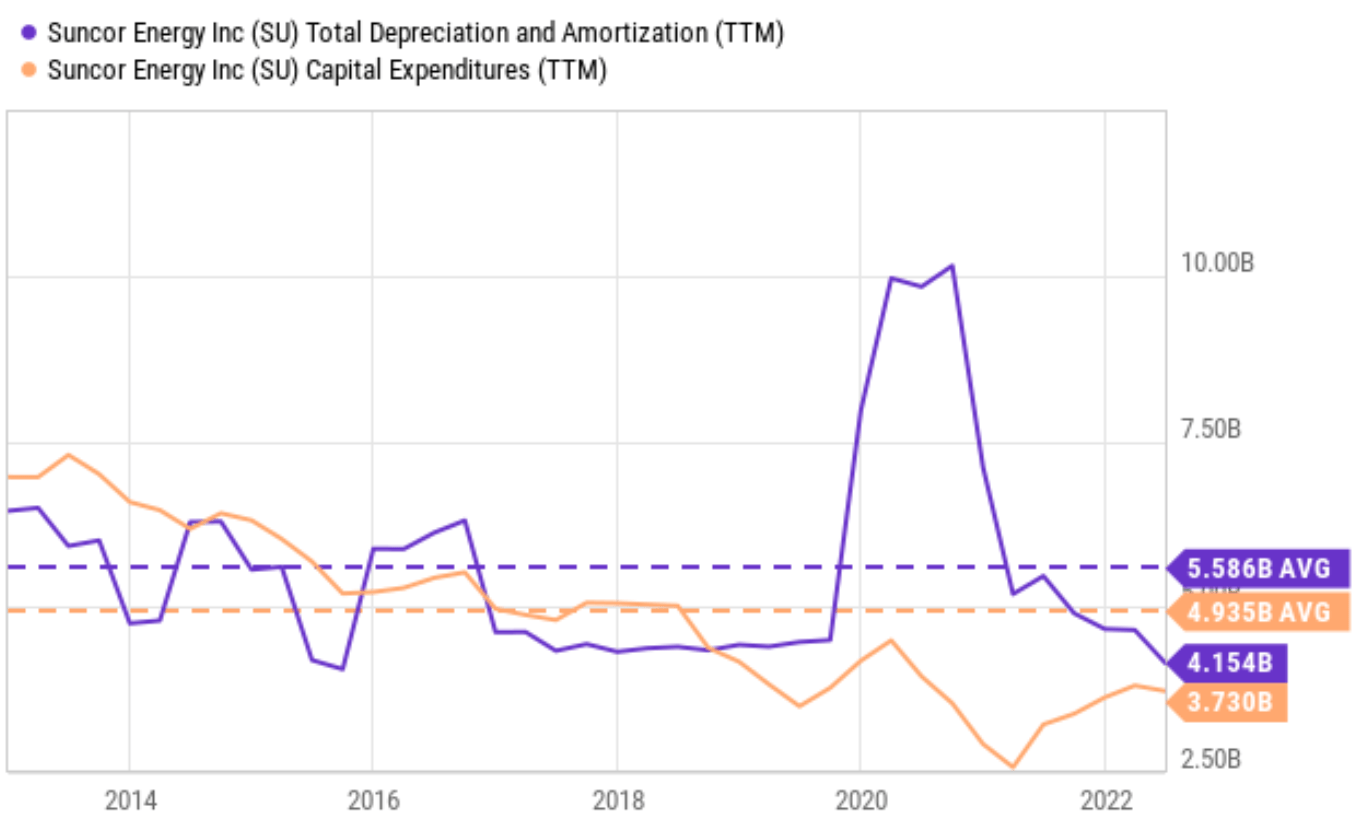
Now back to its Q3 results, the company now enjoys robust profitability to aggressively invest in future growth and at the same time reward shareholders generously. As a sign of strength, it increased its dividends payout by a 100% increase to $1.68/share (annualized) in 2021 and again by another 12% increase to $1.88/ share (annualized) in 2022. At the same time, it has launched the largest buyback programs in its history. It repurchased 6% of its shares in 2021 and is targeting another 10% share repurchase in 2022. And finally, its capital investment guidance is in the range of $4.9 to $5.2 billion in 2022. And if you recall from the chart above, its TTM DA is about $4.15B. So, for the first time in years, its capital investment would start exceeding its total DA by a good margin of up to a billion dollars.
Source: SU Q3 ER presentation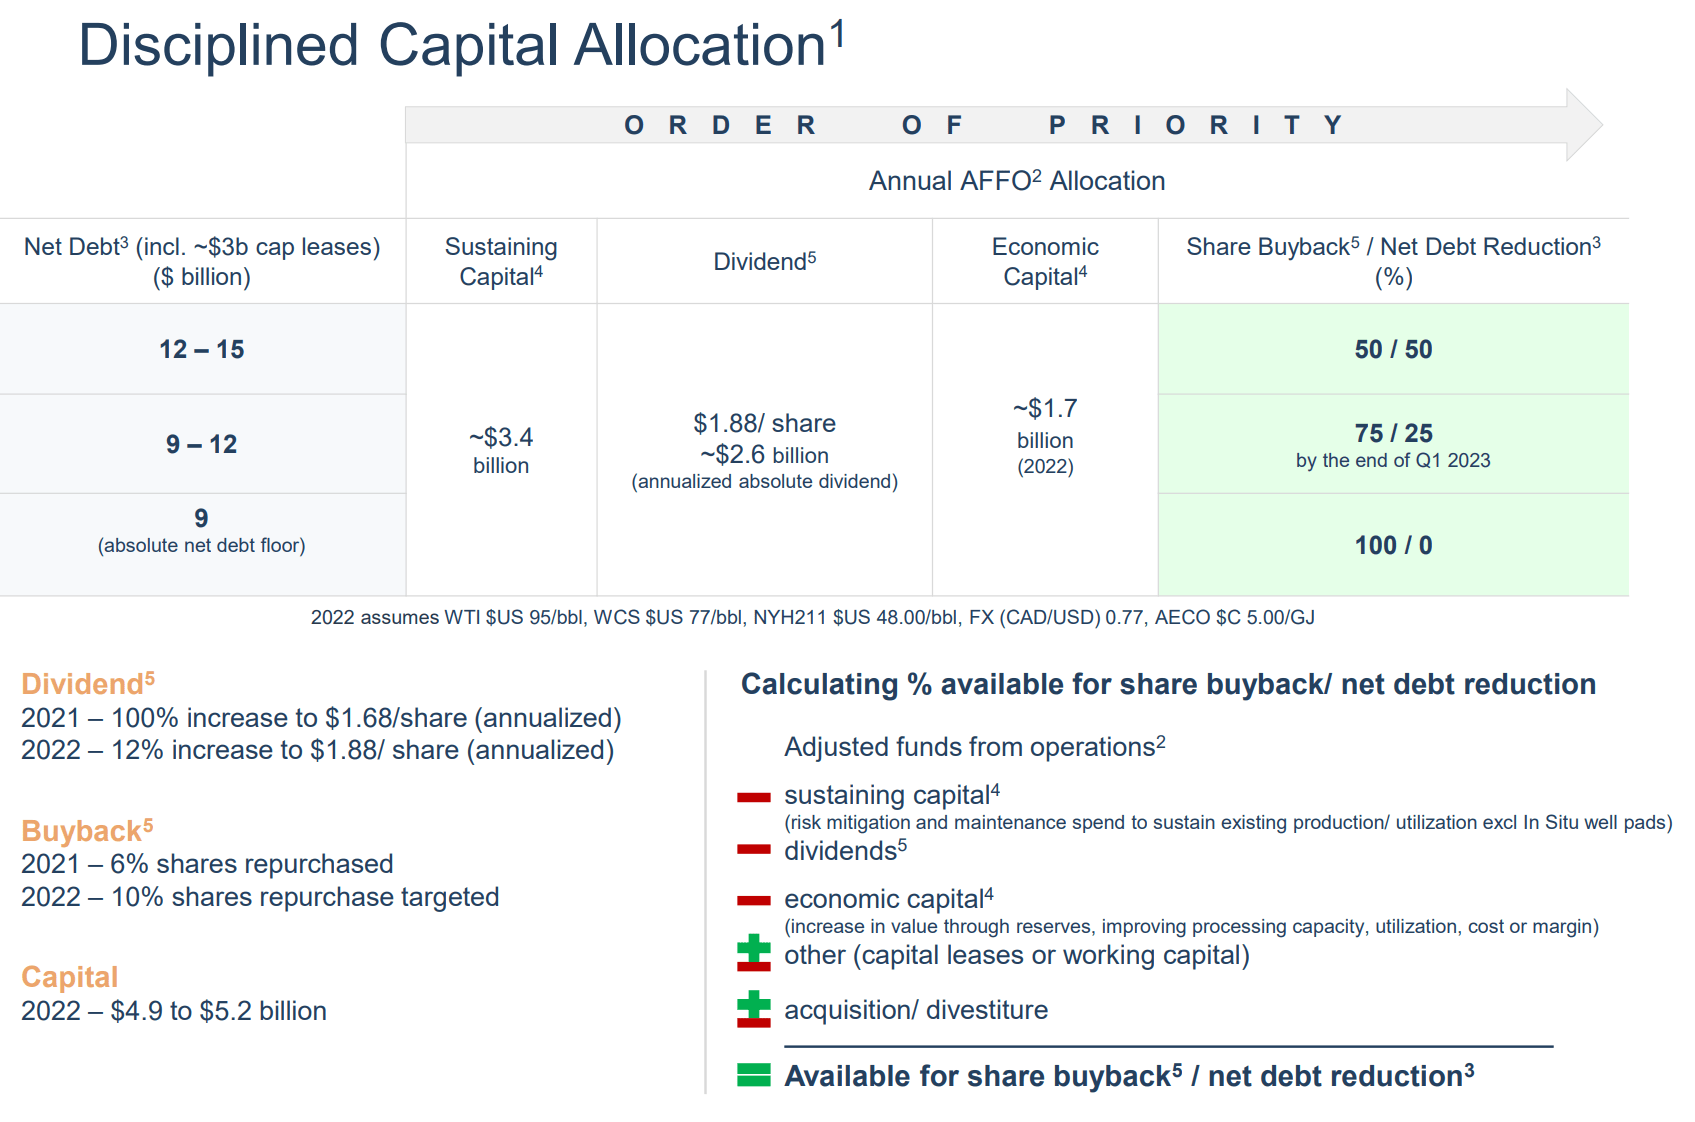
Well poised for breaking out
Thus, in the long term, I see the company well poised for organic growth thanks to its recovered profitability and reinvestment rates. And the large-scale share repurchases at their currently compressed valuation would be highly accreditive for long-term shareholders. In the near term, I see a few catalysts for it to stage another attempt at its record price level near $42.5.
First, its valuation is still compressed despite its recent rallies. To wit, it is currently valued at around 4.97x FW PE as seen in the chart below. Even based on the pessimistic view of the consensus estimates (which predicts a declining EPS), its PE would be only on average in the 5x to 7x range. And as you can tell, I fundamentally disagree with such pessimism. I do not see how its EPS would decline given the robust profitability and reinvestment rate, the many macro forces (inflation, war, et al) supporting oil and natural gas prices, and also the aggressive share buybacks at such compressed valuations.
Source: Seeking Alpha data.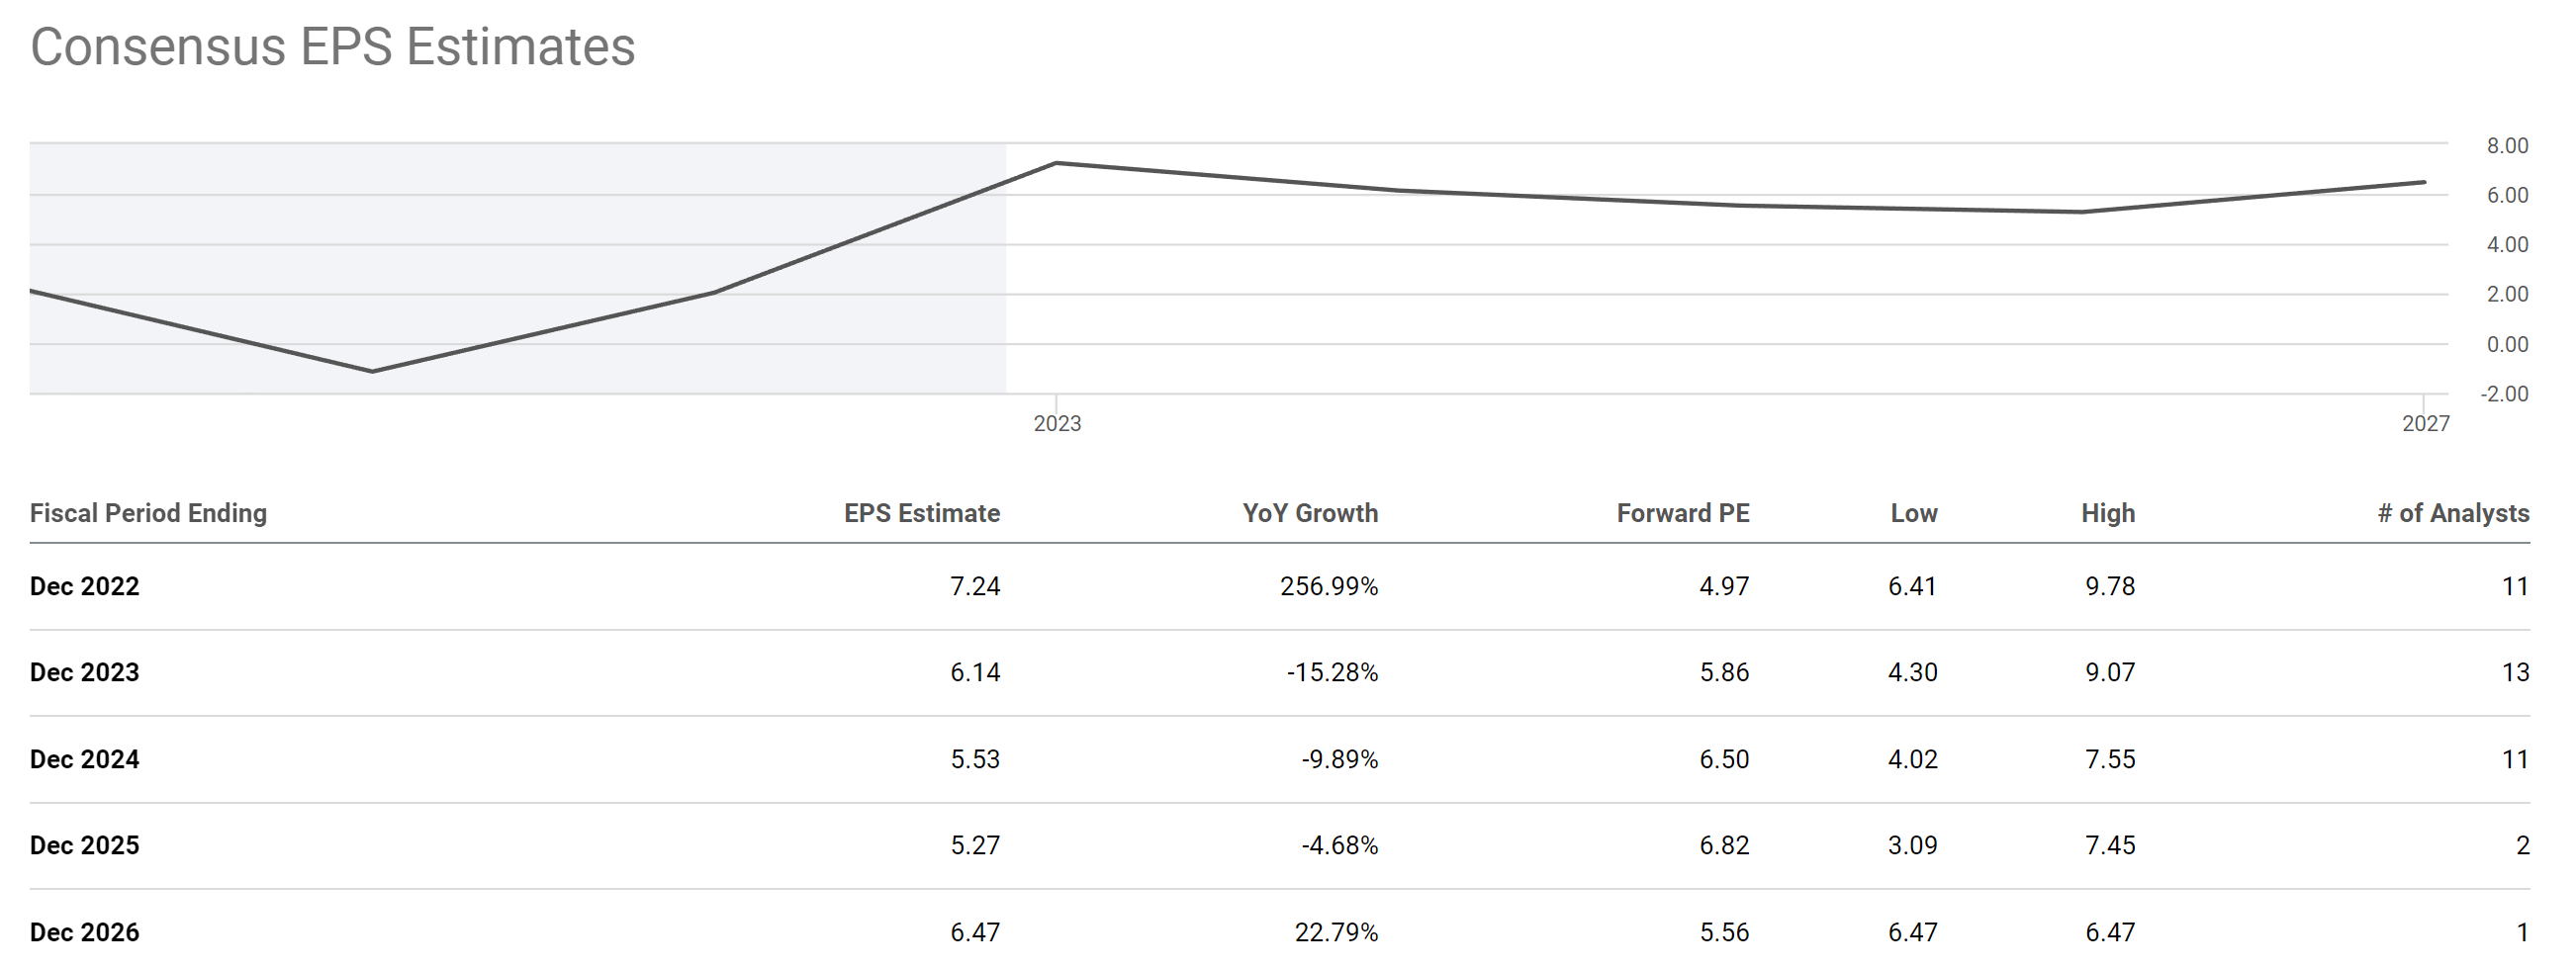
Second, its CAPEX spending would not only support base business & regular maintenance for long-term benefits but also support capital projects with quick payout. As detailed in its ER, it has identified many top-quartile IRR projects to improve efficiency, flexibility, and resilience in the near term too. As a few notable examples, it upgraded its bitumen production to 240.9 kbbls/day in Q3, a sizeable ramp-up vs. the 199.6 kbbls/day output a year ago when commodity prices are highly favorable. The boost was mainly due to a production upgrade from its Fort Hills complex. Looking ahead, it started to execute its mine improvement plan at Fort Hills, paving the ground for more gains further down the road.
And finally, even at the breakout price of $42.5 or even my near-term target price of $60, the stock would still be undervalued, especially when you adjust its valuation by its target leverage. Its historical valuations adjusted for leverage are shown in the first chart below, and my projected valuations are shown in the second chart below. As seen, currently, the EV/sales ratio for SU is about 1.41x currently. It has fluctuated in the past between 0.9x and 3.4x with an average of 1.99x. Therefore, its current 1.41x is at a large discount of almost 30% relative to its historical average. In terms of EV/EBITDA, the picture is similar. Its current EV/EBITDA ratio is about 3.9x. It has fluctuated in the past between 2.4x and 16.4x with an average of 7.01x. Therefore, its current multiple of 3.9x is only about ½ (55% to be exact) of its historical average.
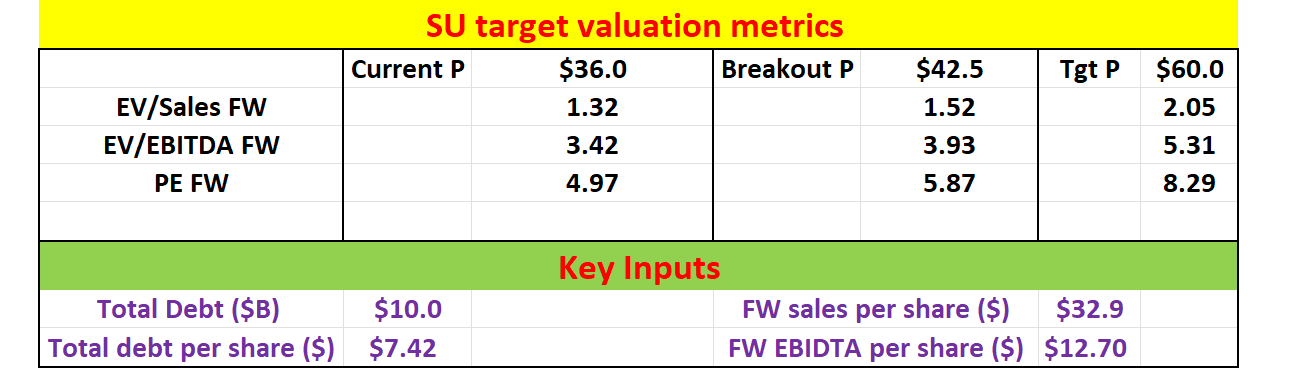
Looking ahead, the company aims to reduce its leverage with its robust cash flow. And I am projecting a total debt of around $10B in the near future. Under this assumption, a $42.5 price would correspond to 1.52x FW EV/sales ratio and 3.93x EV/EBITDA, still at large discounts from its historical averages. Assuming a valuation reversion to its average EV/sales ratio of 2.0x, these estimates show that a target price of $60 can be supported if the stock can break out the $42.5 level this time. And note that at this price, its EV/EBITDA would only be 5.31x (still below the historical average of 7x by a good margin).
Source: Seeking Alpha data. Source: Author Based On Seeking Alpha data.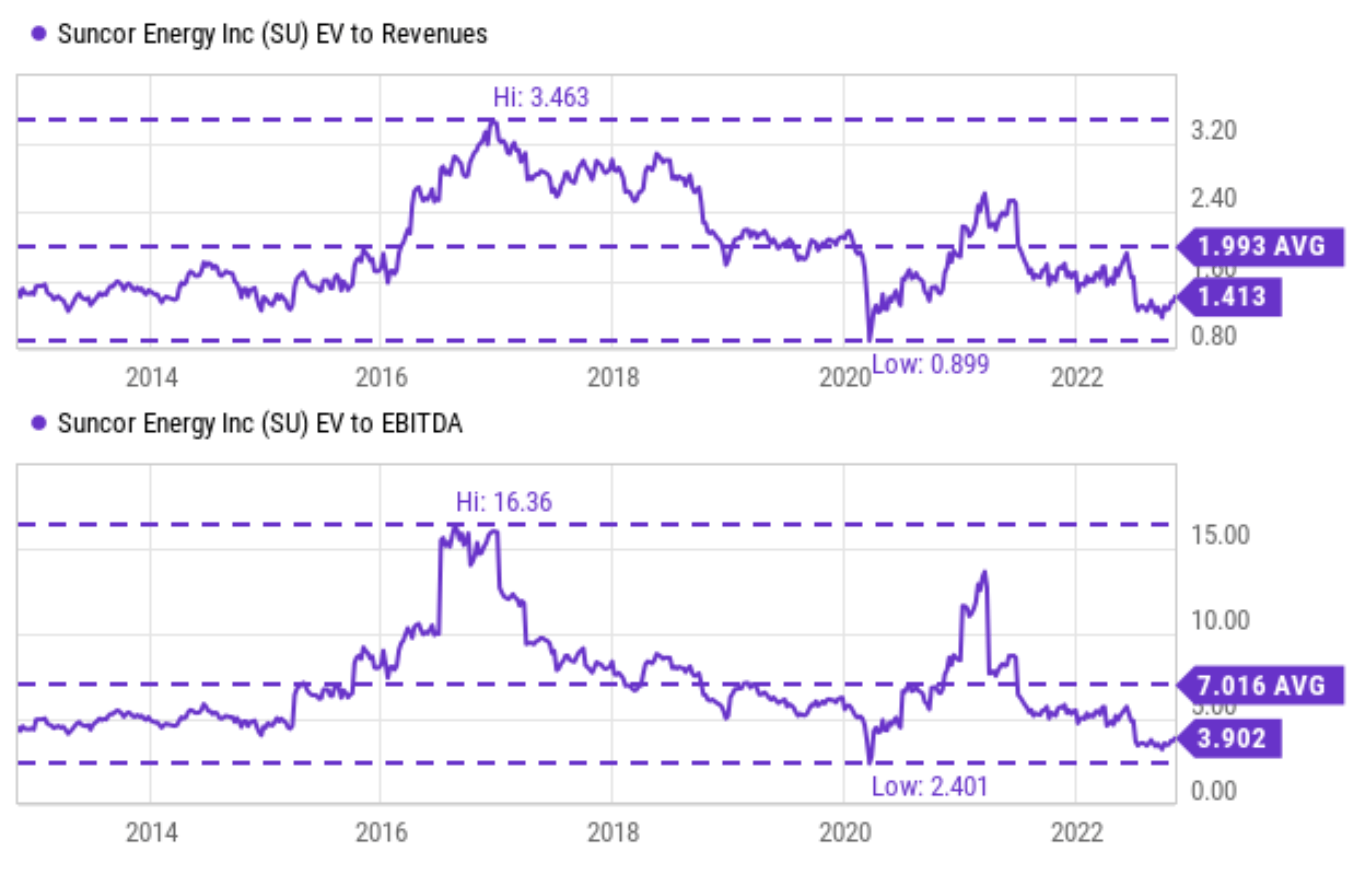
Risks and final thoughts
Investment in SU entails certain risks too. It is dealing with cost increase issues, partly due to the macroscopic inflationary pressures and rising operating costs. Its recent upgrades mentioned above also add onto the cost issues. Moreover, it also needs to improve the safety and reliability of its operations. A good portion of its capital budget is likely to be earmarked for this purpose. In the long haul, our societal pressure to lower carbon emissions may require it to spend more on other greener initiatives.
To conclude, SU is on its way to stage another attempt at the $42.5 record price level, which is ~18% above its current $36 price. The thesis of this article is that its chance of breaking out this time is much better than its last failed attempt back in May given the catalysts reported in Q3. These catalysts included capital allocation flexibility, a robust pricing environment, and large-scale share buybacks at cheap valuations. Moreover, if it does break out this time, I see the stock could easily run to $60 and still be reasonably valued at that point.
Be the first to comment