

Igor Kutyaev
This article was coproduced with Dividend Sensei.
(Scroll down to the bottom of the article to get Brad’s takeaway)
Insurance is a glorious business, both for companies and for income investors.
Why?
Because it’s perfectly aligned with how our world and Wall Street work.
Risk can’t be avoided, only quantified and managed. Insurance companies take in premiums from millions or tens of millions of customers, invest the float (unpaid future claims), and earn a yield and investment returns on those policies.
The results can be magic if an insurance company is managed well, with disciplined underwriting and strong risk management. That’s because these world-class insurance blue-chips earn profits on their policies AND get to invest free money into diversified and prudently risk-managed portfolios.
Just ask Berkshire Hathaway’s (BRK.B) very happy investors what kind of life-changing riches these companies can generate.
Berkshire doesn’t pay a dividend, but plenty of world-class insurance companies do. Today I wanted to highlight Sun Life Financial (NYSE:SLF), one of the world’s finest insurance companies, that you probably haven’t heard of.
But let me show you the four reasons SLF deserves to be on your radar and quite possibly in your portfolio.
Reason One: Sun Life Is The Complete Safe High-Yield Dividend Growth Package
Here’s the bottom-line up front on Sun Life.
-
Canadian Company: foreign diversification
-
15% tax withholding (not in retirement accounts) – tax credit available to recoup withheld dividend
Reasons To Potentially Buy Sun Life Financial Today
|
Metric |
Sun Life Financial |
|
Quality |
82% 11/13 Super SWAN |
|
Risk Rating |
Very Low |
|
DK Master List Quality Ranking (Out Of 500 Companies) |
232 |
|
Quality Percentile |
54% |
|
Dividend Growth Streak (Years) |
7 (21 Years Without A Dividend Cut) |
|
Dividend Yield |
4.5% |
|
Dividend Safety Score |
85% |
|
Average Recession Dividend Cut Risk |
0.5% |
|
Severe Recession Dividend Cut Risk |
1.80% |
|
S&P Credit Rating |
A+ Stable |
|
30-Year Bankruptcy Risk |
0.60% |
|
Consensus LT Risk-Management Industry Percentile |
85% Very Good Risk-Management |
|
Fair Value |
$57.77 |
|
Current Price |
$47.93 |
|
Discount To Fair Value |
16% |
|
DK Rating |
Potentially Good Buy |
|
PE |
9.9 |
|
Historical PE Range |
11.7 to 12.1 |
|
LT Growth Consensus/Management Guidance |
9% |
|
PEG Ratio |
1.1 |
|
5-year consensus total return potential: |
13% to 17% CAGR |
|
Base Case 5-year consensus return potential |
14% CAGR (2.5X S&P 500 consensus) |
|
Consensus 12-month total return forecast |
15% |
|
Fundamentally Justified 12-Month Return Potential |
27% |
|
LT Consensus Total Return Potential |
13.5% |
|
Inflation-Adjusted Consensus LT Return Potential |
11.28% |
|
Consensus 10-Year Inflation-Adjusted Total Return Potential (Ignoring Valuation) |
2.91 |
|
LT Risk-Adjusted Expected Return |
7.85% |
|
LT Risk-And Inflation-Adjusted Return Potential |
5.63% |
|
Conservative Years To Double |
12.79 |
(Source: DK Zen Research Terminal)
SLF 2024 Consensus Total Return Potential
FAST Graphs FAST Graphs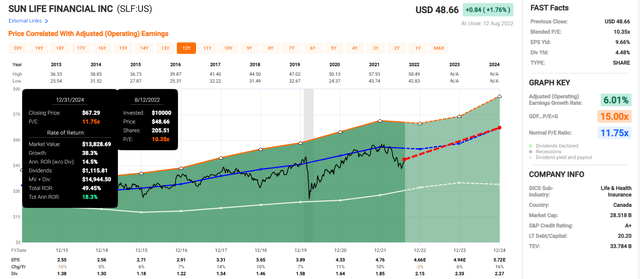
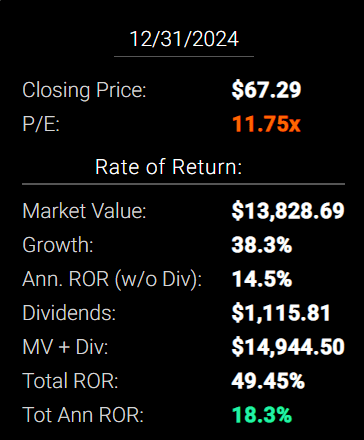
If SLF grows as analysts expect through 2024 and returns to historical fair value, it could deliver 49% total returns or 18% annually.
SLF 2027 Consensus Total Return Potential
Fast Graphs FAST Graphs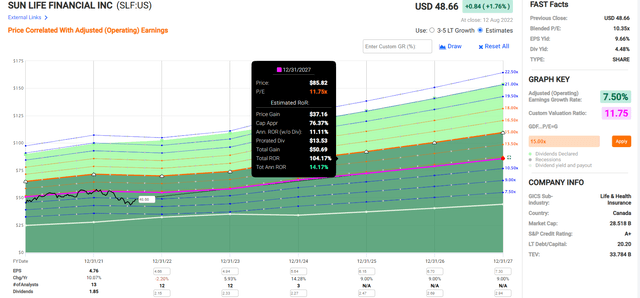
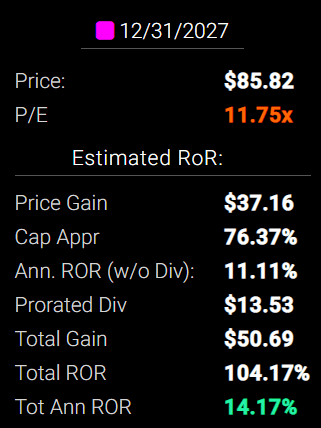
By 2027, if SLF grows as expected and returns to historical mid-range historical fair value, it could deliver 104% or 14% annual returns.
-
about 2.5X more than the S&P 500 consensus
Now compare that to the S&P 500.
S&P 2024 Consensus Total Return Potential
Fast Graphs (na) FAST Graphs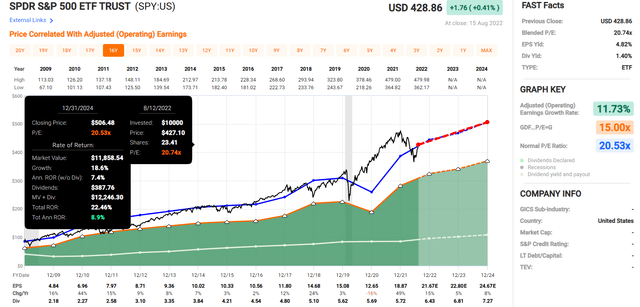
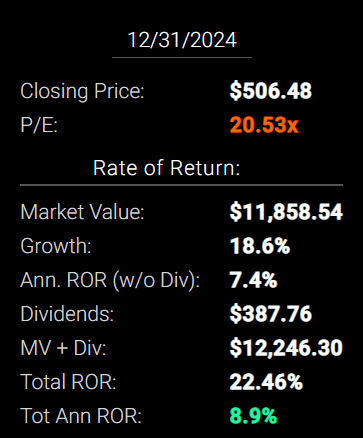
Analysts expect about 22% or 9% annual returns from the S&P 500 over the next 2.5 years.
S&P 500 2027 Consensus Return Potential
|
Year |
Upside Potential By End of That Year |
Consensus CAGR Return Potential By End of That Year |
Probability-Weighted Return (Annualized) |
Inflation And Risk-Adjusted Expected Returns |
|
2027 |
40.78% |
7.08% |
5.31% |
3.03% |
(Source: DK S&P 500 Valuation And Total Return Tool)
Over the next five years, analysts expect about 41% total returns from the S&P 500 or 7% annually.
SLF Long-Term Consensus Total Return Potential
|
Investment Strategy |
Yield |
LT Consensus Growth |
LT Consensus Total Return Potential |
Long-Term Risk-Adjusted Expected Return |
Long-Term Inflation And Risk-Adjusted Expected Returns |
Years To Double Your Inflation & Risk-Adjusted Wealth |
10-Year Inflation And Risk-Adjusted Expected Return |
|
Sun Life Financial (Analyst Consensus) |
4.5% |
11.0% |
15.5% |
10.9% |
8.6% |
8.3 |
2.29 |
|
Sun Life Financial (Management Guidance) |
4.5% |
9.0% |
13.5% |
9.5% |
7.2% |
10.0 |
2.01 |
|
Nasdaq |
0.9% |
12.6% |
13.4% |
9.4% |
7.2% |
10.0 |
2.00 |
|
Dividend Aristocrats |
2.4% |
8.6% |
11.0% |
7.7% |
5.5% |
13.2 |
1.70 |
|
S&P 500 |
1.6% |
8.5% |
10.1% |
7.1% |
4.9% |
14.8 |
1.61 |
(Sources: Morningstar, FactSet, Ycharts) – ignores valuation, which cancels out over 30+ years
Analysts think SLF could deliver 15.5% long-term returns, and management is guiding for 13.5%. Both are higher than the S&P 500, aristocrat, and even the Nasdaq’s long-term consensus return potential.
SLF Total Returns Since April 2000
SLF’s 10.6% annular returns over the last 22 years have been extremely impressive given the three recessions, three market crashes, and 5 bear markets we’ve been through.
-
Financial Sector: 4.7% CAGR
-
S&P 500: 6.7% CAGR
-
Nasdaq 5.8% CAGR (11 years underwater in the tech crash)
And SLF has outperformed its peers, the market, and even the Nasdaq, just as analysts and management expect will continue in the future.
Inflation-adjusted annual returns since April 2000:
-
Financial sector: 2.3% CAGR (thanks to the Great Financial Crisis)
-
Nasdaq: 3.3% CAGR (thanks to the tech crash)
-
S&P 500: 4.2% CAGR (thanks to five bear markets)
-
Sun Life: 8.1% CAGR (2.2X more than the market despite the Financial crisis)
Sun Life Financial Rolling Returns Since April 2000
SLF’s average 12-month return for the last 22 years is 12.1% CAGR, similar to what management says investors can expect in the future.
-
Financial Sector: 7.7% CAGR
-
S&P 500: 8.9% CAGR
-
Nasdaq: 11.5% CAGR
A Dividend Growth Blue-Chip You Can Trust
How dependable are SLF’s dividends? Just take a look.
SLF Cumulative Dividend Since 2001: $1,000 Initial Investment
|
Metric |
S&P 500 |
SPDR Financial Sector ETF |
Nasdaq |
Sun Life Financial |
|
Total Dividends |
$679 |
$630 |
$165 |
$3,819 |
|
Annualized Income Growth Rate |
8.73% |
5.27% |
19.38% |
11.22% |
|
Total Income/Initial Investment |
0.68 |
0.63 |
0.17 |
3.82 |
|
Inflation-Adjusted Income/Initial Investment |
0.39 |
0.36 |
0.09 |
2.17 |
|
More Inflation-Adjusted Income Than The S&P 500/ETF |
5.62 |
6.06 |
23.15 |
(Source: Portfolio Visualizer Premium)
SLF has delivered 11% annual income growth and 3.8X an investor’s initial investment in inflation-adjusted dividends over the last 21 years.
-
a 42% yield on cost means that number is rising very quickly now
SLF has recouped investors’ initial investments by 2.2X since 2001, adjusted for inflation.
-
5.6X more inflation-adjusted income than the S&P 500
-
6.1X more than the financial sector
-
23X more than the Nasdaq
SLF Consensus Future Income Growth Potential
|
Analyst Consensus Income Growth Forecast |
Risk-Adjusted Expected Income Growth |
Risk And Tax-Adjusted Expected Income Growth |
Risk, Inflation, And Tax Adjusted Income Growth Consensus |
|
12.5% |
8.8% |
7.5% |
5.2% |
(Source: DK Research Terminal, FactSet)
Analysts think SLF could deliver similar 12.5% annual income growth in the future, which, adjusted for the risk of the company not growing as expected, inflation, and taxes, is 5.2% real expected income growth.
Now compare that to what they expect from the S&P 500.
|
Time Frame |
S&P Inflation-Adjusted Dividend Growth |
S&P Inflation-Adjusted Earnings Growth |
|
1871-2021 |
1.6% |
2.1% |
|
1945-2021 |
2.4% |
3.5% |
|
1981-2021 (Modern Falling Rate Era) |
2.8% |
3.8% |
|
2008-2021 (Modern Low Rate Era) |
3.5% |
6.2% |
|
FactSet Future Consensus |
2.0% |
5.2% |
(Sources: S&P, FactSet, Multipl.com)
-
1.7% post-tax inflation-adjusted income growth from the S&P 500
-
S&P 500’s historical post-tax inflation-adjusted income growth rate (current tax code) is 5.8% CAGR
S&P is now dominated by companies favoring buybacks over dividends, potentially explaining the slower income growth in the future.
What about a 60/40 retirement portfolio?
-
0.5% consensus inflation, risk, and tax-adjusted income growth.
In other words, SLF could generate about 3X faster real income growth than the S&P 500 and 10X faster income growth than a 60/40.
-
And a 3X higher and safer yield on day one
What inflation-adjusted returns do analysts expect in the future?
Inflation-Adjusted Consensus Return Potential: $1,000 Initial Investment
|
Time Frame (Years) |
7.9% CAGR Inflation And Risk-Adjusted S&P Consensus |
8.9% Inflation-Adjusted Aristocrat Consensus |
11.3% CAGR Inflation-Adjusted SLF Consensus |
Difference Between Inflation-Adjusted SLF And S&P Consensus |
|
5 |
$1,461.18 |
$1,530.17 |
$1,706.42 |
$245.24 |
|
10 |
$2,135.06 |
$2,341.43 |
$2,911.86 |
$776.81 |
|
15 |
$3,119.71 |
$3,582.79 |
$4,968.86 |
$1,849.15 |
|
20 |
$4,558.47 |
$5,482.29 |
$8,478.96 |
$3,920.49 |
|
25 |
$6,660.75 |
$8,388.86 |
$14,468.65 |
$7,807.89 |
|
30 |
$9,732.58 |
$12,836.40 |
$24,689.57 |
$14,956.99 |
(Source: DK Research Terminal, FactSet) – ignoring starting valuation, which cancels out over 30+ years
Management and analysts think SLF could potentially deliver 25X returns in the coming decades.
|
Time Frame (Years) |
Ratio Aristocrats/S&P Consensus |
Ratio Inflation-Adjusted SLF vs. S&P consensus |
|
5 |
1.05 |
1.17 |
|
10 |
1.10 |
1.36 |
|
15 |
1.15 |
1.59 |
|
20 |
1.20 |
1.86 |
|
25 |
1.26 |
2.17 |
|
30 |
1.32 |
2.54 |
(Source: DK Research Terminal, FactSet)
That’s potentially 2.5X more than the S&P 500 and 90% more than the dividend aristocrats.
SLF Investment Decision Score
Dividend Kings Dividend Kings
For anyone comfortable with its risk profile, SLF is one of Wall Street’s most reasonable and prudent fast-growing high-yield blue-chip investment options.
-
16% discount vs. 9% market premium = 25% better valuation
-
4.5% yield vs. 1.6% yield (3X higher and much safer)
-
35% better consensus long-term return potential
-
2X better risk-adjusted expected returns over the next five years
-
3X higher consensus dividends over the next five years
Reason Two: One Of The Most Highest Quality Insurance Companies On Earth
There are many ways to measure safety and quality, and I factor in pretty much all of them.
The Dividend Kings’ overall quality scores are based on a 269-point model that includes:
-
Dividend safety
-
Balance sheet strength
-
Credit ratings
-
Credit default swap medium-term bankruptcy risk data
-
Short and long-term bankruptcy risk
-
Accounting and corporate fraud risk
-
Profitability and business model
-
Growth consensus estimates
-
Management growth guidance
-
Historical earnings growth rates
-
Historical cash flow growth rates
-
Historical dividend growth rates
-
Historical sales growth rates
-
Cost of capital
-
GF Scores
-
Morningstar business model uncertainty score
-
Long-term risk-management scores from MSCI, Morningstar, FactSet, S&P, Reuters’/Refinitiv, and Just Capital
-
Management quality
-
Dividend-friendly corporate culture/income dependability
-
Long-term total returns (a Ben Graham sign of quality)
-
Analyst consensus long-term return potential
It includes over 1,000 fundamental metrics, including the 12 rating agencies we use to assess fundamental risk.
-
credit and risk management ratings make up 41% of the DK safety, and quality model
-
dividend/balance sheet/risk ratings make up 82% of the DK safety and quality model
How do we know that our safety and quality model works well?
During the two worst recessions in 75 years, our safety model 87% of blue-chip dividend cuts, the ultimate baptism by fire for any dividend safety model.
How does SLF score on our comprehensive safety and quality models?
SLF Dividend Safety
|
Rating |
Dividend Kings Safety Score (186 Point Safety Model) |
Approximate Dividend Cut Risk (Average Recession) |
Approximate Dividend Cut Risk In Pandemic Level Recession |
|
1 – unsafe |
0% to 20% |
over 4% |
16+% |
|
2- below average |
21% to 40% |
over 2% |
8% to 16% |
|
3 – average |
41% to 60% |
2% |
4% to 8% |
|
4 – safe |
61% to 80% |
1% |
2% to 4% |
|
5- very safe |
81% to 100% |
0.5% |
1% to 2% |
|
SLF |
85% |
0.5% |
1.80% |
|
Risk Rating |
Very Low-Risk (85th industry percentile risk-management consensus) |
A+ stable outlook credit rating 0.6% 30-year bankruptcy risk |
10% OR LESS Max Risk Cap Recommendation |
Long-Term Dependability
|
Company |
DK Long-Term Dependability Score |
Interpretation |
Points |
|
Non-Dependable Companies |
21% or below |
Poor Dependability |
1 |
|
Low Dependability Companies |
22% to 60% |
Below-Average Dependability |
2 |
|
S&P 500/Industry Average |
61% (61% to 70% range) |
Average Dependability |
3 |
|
Above-Average |
71% to 80% |
Very Dependable |
4 |
|
Very Good |
81% or higher |
Exceptional Dependability |
5 |
|
SLF |
79% |
Very Dependable |
4 |
Overall Quality
|
SLF |
Final Score |
Rating |
|
Safety |
85% |
5/5 very safe |
|
Business Model |
70% |
2/3 narrow and stable moat |
|
Dependability |
79% |
4/5 very dependable |
|
Total |
82% |
11/13 SWAN |
|
Risk Rating |
4/5 Low-Risk |
|
|
10% OR LESS Max Risk Cap Rec |
15% Margin of Safety For A Potentially Good Buy |
SLF is the 232nd highest quality company on the DK 500 Masterlist.
How significant is this? The DK 500 Master List is one of the world’s best watchlists, including
-
every dividend aristocrat (S&P companies with 25+ year dividend growth streaks)
-
every dividend champion (every company, including foreign, with 25+ year dividend growth streaks)
-
every dividend king (every company with 50+ year dividend growth streaks)
-
every foreign aristocrat (every company with 20+ year dividend growth streaks)
-
every Ultra SWAN (wide moat aristocrats, as close to perfect quality companies as exist)
-
40 of the world’s best growth stocks
In other words, even among the world’s best companies, SLF is higher quality than 54% of them, similar in quality to such aristocrats and blue-chips as:
-
Roper Technologies (ROP): dividend aristocrat
-
General Dynamics (GD) – dividend aristocrat
-
Federal Realty Investment Trust (FRT): Ultra SWAN dividend king
-
Essex Property Trust (ESS): dividend aristocrat
-
MunichRe (OTCPK:MURGY)
-
Legal And General (OTCPK:LGGNY)
-
American Tower (ATM)
-
Amgen (AMGN)
-
Union Pacific (UNP)
Why I Trust Sun Life And So Can You
Sun Life traces its roots back to 1865, founded in Toronto. Over the last 157 years, it’s survived and thrived through
-
two World Wars
-
a global pandemic that killed 5% of humanity
-
the Great Depression
-
the Cold War
-
two major oil shocks
-
the Great Financial Crisis
-
dozens of bear markets
-
over 100 corrections and pullbacks
-
inflation as high as 22%
-
interest rates as high as 20%
-
long-term bond yields as high as 16%
In other words, Sun Life is built to last and will likely outlive us all.
Sun Life gets 53% of its revenue from Canada and 32% from the US, with the rest being international, primarily from Asia.
It’s one of Canada’s big three insurance companies, which collectively command 80% market share. SLF’s market share is approximately 18%.
The company has 50,000 employees operating in 27 countries and works with 118,400 advisors in its wealth management arm.
Sun Life is one of the best-run insurance companies in the world in terms of safe payout ratios, strong profitability, and solid 9% growth guidance.
While North America is a cash cow, Asia presents the best long-term growth opportunities, and that’s the core of why analysts think SLF can grow at double-digits over time. It’s getting into Fintech as well through digital insurance products.
For example, 93% of applications in Canada are digital, and 96% of claims are submitted electronically. In Asia, it’s 71%.
In 2019, it acquired real estate investment firm BentallGreenOak and in 2020 announced a majority stake in Crescent Capital and Infrared Capital Partners, both of which are alternative asset managers.
While a large acquisition in the asset-management industry is possible, Sun Life would have to carefully weigh the capital required and the potential for disruption to its existing operations. In the insurance space, Sun Life swung big with its $2.5 billion acquisition of DentaQuest, which was completed in June 2022. – Morningstar
Acquisitions, including investment firms specializing in real estate and alternative assets, are part of SLF’s diversification and growth strategy to move beyond just North American insurance.
SLF has a US-focused asset management business with over $1.1 trillion in AUM though it’s expected to suffer $34 billion in net outflows in 2022 and 2023 due to the bear market.
In 2021’s bull market, AUM grew 15%.
51% of net income comes from asset and wealth management, with the rest from insurance businesses.
-
38% of net income from asset management
-
32% from Canadian insurance
-
16% Asian insurance
-
14% US insurance
In the coming years, SLF expects to achieve about 9% EPS growth and returns on equity of 18%. For context, the median ROE in the insurance industry is 8%.
From 2016 to 2021, SLF delivered 6% annual sales growth in its insurance business and 11% growth in wealth management.
-
EPS grew 10%
-
and dividend 7% CAGR
SLF had a $143 billion insurance float portfolio at the end of 2021.
-
47% bonds
-
29% mortgages and loans
-
6% cash
-
5% stocks
-
5% real estate
-
4% alternatives
-
1% derivatives (mostly for hedging)
SLF’s bond portfolio is 36% government debt.
54% of its bond portfolio is corporate bonds, well diversified across every sector, with the largest (financials) representing 14%.
The final 10% are asset-backed bonds.
78% of its bonds are issued by the US or Canada, another 11% by Europe, 7% in Asia, and 4% by other countries.
73% of its bonds are A-rated or higher, with 20% AAA, 15% AA, 38% A, and 26% investment grade BBB.
-
99% overall investment grade bond portfolio
SLF’s stock portfolio is 37% Canadian companies, 37% US, 5% Europe, and 21% Asian.
95% of its mortgage-backed loans are in the US, Canada, and Europe.
You can trust this highly conservative float portfolio with your hard-earned savings.
SLF with comprehensive and proven risk managment at its core, which is why it was one of the few big insurance companies not to cut its dividend in the Great Recession.
Quantitative Analysis: The Math Backing Up The Investment Thesis
Ben Graham recommended combining qualitative (the story) analysis with quantitative analysis looking at the past, present, and likely future.
Sun Life Credit Ratings
|
Rating Agency |
Credit Rating |
30-Year Default/Bankruptcy Risk |
Chance of Losing 100% Of Your Investment 1 In |
|
S&P |
A+ Stable Outlook |
0.60% |
166.7 |
|
Fitch |
A+ Stable Outlook |
0.60% |
166.7 |
|
DBRS |
A+ Stable Outlook |
0.60% |
166.7 |
|
AMBest |
A Stable Outlook |
0.67% |
149.3 |
|
Consensus |
A+ Stable Outlook |
0.62% |
161.9 |
(Source: S&P, Fitch, Moody’s)
Four rating agencies estimate SLF’s long-term bankruptcy risk at 0.62% or a 1 in 162 chance of losing all your money investing in this company.
Sun Life Profitability: Wall Street’s Favorite Quality Proxy
SLF’s profitability is historically in the top 30% of its peers
-
a relatively narrow moat insurance company
SLF Trailing 12-Month Profitability Vs. Peers
|
Metric |
TTM |
Industry Percentile |
Major Insurance Companies providers More Profitable Than SLF (Out Of 506) |
|
Net Margin |
16.70% |
80.52 |
99 |
|
Return On Equity |
14.39% |
77.4 |
114 |
|
Return On Assets |
1.21% |
47.83 |
264 |
|
Returns On Invested Capital |
1.35% |
44.19 |
282 |
|
Average |
8.41% |
62.49 |
190 |
(Source: GuruFocus Premium)
In the last year, SLF’s profitability was hurt by ongoing Pandemic related expenses.
SLF’s profitability has been relatively stable for the last quarter century, confirming the stability of its business and moat.
Reason Three: Industry Leading Growth Prospects
I have no interest in recommending high-yield companies with slow to negative growth prospects. But just take a look at what analysts expect from SLF.
SLF Medium-Term Growth Consensus Forecast
|
Metric |
2021 Growth |
2022 Growth Consensus |
2023 Growth Consensus |
2024 Growth Consensus |
|
Sales |
11% |
-30% |
21% |
4% |
|
Dividend |
5% |
19% |
8% (22 years without a dividend cut) |
-1% (Artifact) |
|
Operating Earnings |
10% |
-2% |
6% |
16% |
|
Book Value |
8% |
3% |
2% |
13% |
(Source: FactSet Research Terminal)
SLF’s sales can be highly volatile, as with many insurance companies. But its earnings, dividends, and book value are expected to grow at a steady rate in the future.
-
the 2024 dividend cut forecast is almost certainly a data artifact created by how many analysts are making 2024 forecasts
SLF Dividend Growth Consensus Forecast
|
Year |
Dividend Consensus |
EPS/Share Consensus |
EPS Payout Ratio |
Retained (Post-Dividend) Earnings |
Buyback Potential |
|
2022 |
$2.13 |
$4.64 |
45.9% |
$1,471 |
5.24% |
|
2023 |
$2.30 |
$4.97 |
46.3% |
$1,565 |
5.57% |
|
2024 |
$2.28 |
$5.64 |
40.4% |
$1,969 |
7.01% |
|
Total 2022 Through 2024 |
$6.71 |
$15.25 |
44.0% |
$5,004.44 |
17.82% |
|
Annualized Rate |
3.5% |
10.3% |
-6.2% |
15.7% |
15.7% |
(Source: FactSet Research Terminal)
According to rating agencies, 50% is the safe payout ratio for insurance companies.
-
40% to 50% payout ratio is management’s official policy target
Analysts expect modest 3.5% dividend growth in the coming years and impressive double-digit EPS growth, with a payout ratio at the end of 2024 of 40%, the low end of management’s target range.
That would allow SLF to potentially retain $5 billion in post-dividend earnings, enough to potentially repurchase up to 18% of shares at current valuations.
SLF has bought back up to 10% of its shares and, in recent years, about 5%. However, it will occasionally use its stock to fund opportunistic M&A Deals.
CA Financials are not known for their heavy use of buybacks. Their priorities tend to be safe and steadily growing dividends.
SLF Long-Term Growth Outlook
-
the growth consensus range from four sources is 8% to 11% CAGR
-
management’s guidance is for 8% to 10% growth
-
the median from all 16 analysts is 11.0% CAGR
How accurate are analyst forecasts for SLF (including based on management guidance)?
-
since 2017, after the effects of the Great Recession, SLF has always beaten expectations (a five-year beat streak)
-
Smoothing for outliers, historical analyst margins-of-error are 10% to the downside and 5% to the upside
-
margin-of-error adjusted consensus growth range: 7% to 12% CAGR
-
70% statistical probability that SLF grows 7% to 12% over time
Management growth guidance and the analyst consensus range are consistent with SLF’s historical growth rates since the GFC of 5% to 14% CAGR.
Managment expects growth to be similar to the last seven years and analysts the last six years.
Reason Four: A Wonderful Company At A Wonderful Price
Since the Financial Crisis, millions of income investors, have consistently paid 11.7X to 12.1X earnings for SLF. SFL’s historical dividend yield is also a rock-steady 3.7%.
|
Metric |
Historical Fair Value Multiples (12-Years) |
2021 |
2022 |
2023 |
2024 |
12-Month Forward Fair Value |
|
5-Year Average Yield |
3.67% |
$49.86 |
$58.31 |
$58.31 |
$62.13 |
|
|
13-Year Median Yield |
3.68% |
$49.73 |
$58.15 |
$58.40 |
$61.96 |
|
|
PE |
11.75 |
$55.93 |
$54.52 |
$54.52 |
$66.27 |
|
|
Average |
$51.69 |
$56.94 |
$57.02 |
$63.39 |
$56.99 |
|
|
Current Price |
$47.93 |
|||||
|
Discount To Fair Value |
7.27% |
15.82% |
15.94% |
24.39% |
15.89% |
|
|
Upside To Fair Value (NOT Including Dividends) |
7.84% |
18.80% |
18.96% |
32.25% |
18.90% (23% including dividend) |
|
|
2022 EPS |
2023 EPS |
2022 Weighted OCF |
2023 Weighted OCF |
12-Month Forward PE |
12-Month Average Fair Value Forward PE |
Current Forward PE |
|
$4.64 |
$4.97 |
$1.78 |
$3.06 |
$4.84 |
11.77 |
9.90 |
I estimate SLF’s historical fair value at 11.8X earnings, and today it trades at 9.9X.
|
Analyst Median 12-Month Price Target |
Morningstar Fair Value Estimate |
|
$52.90 (10.9 PE) |
$52.00 (10.7 PE) |
|
Discount To Price Target (Not A Fair Value Estimate) |
Discount To Fair Value |
|
9.40% |
7.83% |
|
Upside To Price Target (Not Including Dividend) |
Upside To Fair Value (Not Including Dividend) |
|
10.37% |
8.49% |
|
12-Month Median Total Return Price (Including Dividend) |
Fair Value + 12-Month Dividend |
|
$55.04 |
$54.14 |
|
Discount To Total Price Target (Not A Fair Value Estimate) |
Discount To Fair Value + 12-Month Dividend |
|
12.92% |
11.47% |
|
Upside To Price Target ( Including Dividend) |
Upside To Fair Value + Dividend |
|
14.83% |
12.96% |
Morningstar’s fair value estimate says SLF is worth 10.7X earnings, which is historically very conservative.
Analysts expect 11X earnings within a year and 15% total returns.
I don’t recommend companies based on 12-month forecasts but on the margin of safety and whether or not it sufficiently compensates you for a company’s risk profile.
Margin Of Safety Not 12-Month Price Targets Are How I Make Investment Decisions
|
Rating |
Margin Of Safety For Very Low-Risk 11/13 Quality SWANs |
2022 Fair Value Price |
2023 Fair Value Price |
12-Month Forward Fair Value |
|
Potentially Reasonable Buy |
0% |
$56.94 |
$57.02 |
$56.99 |
|
Potentially Good Buy |
15% |
$48.40 |
$48.46 |
$48.44 |
|
Potentially Strong Buy |
25% |
$42.70 |
$42.76 |
$42.74 |
|
Potentially Very Strong Buy |
35% |
$31.46 |
$37.06 |
$37.04 |
|
Potentially Ultra-Value Buy |
45% |
$31.32 |
$31.36 |
$31.34 |
|
Currently |
$47.93 |
15.82% |
15.94% |
15.89% |
|
Upside To Fair Value (Not Including Dividends) |
18.80% |
18.96% |
18.90% |
For anyone comfortable with its risk profile, SLF is a potentially good buy.
Risk Profile: Why Sun Life Isn’t Right For Everyone
There are no risk-free companies, and no company is right for everyone. You have to be comfortable with the fundamental risk profile.
What Could Cause SLF’s Investment Thesis To Break
-
safety falls to 40% or less
-
balance sheet collapses (approximately 0.62% or less probability according to rating agencies)
-
a major botched acquisition
-
growth outlook falls to less than 5.5% for five years
-
SLF’s role in my portfolio is to deliver long-term 10+% returns with minimal fundamental risk
-
8+% total return requirement for defensive sectors (including midstream)
-
10+% for non-defensive (cyclical) sectors (including financials)
How long it takes for a company’s investment thesis to break depends on the quality of the company.
|
Quality |
Years For The Thesis To Break Entirely |
|
Below-Average |
1 |
|
Average |
2 |
|
Above-Average |
3 |
|
Blue-Chip |
4 |
|
SWAN |
5 |
|
Super SWAN |
6 |
|
Ultra SWAN |
7 |
|
100% Quality Companies (MSFT, LOW, and MA) |
8 |
These are my rule of thumb for when to sell a stock if the investment thesis has broken. SLF is highly unlikely to suffer such catastrophic declines in fundamentals.
SLF’s Risk Profile Summary
Of Sun Life’s CAD 185 billion in invested assets on its balance sheet, as of Dec. 31, 2021, 48% is invested in debt securities, 28% in mortgages and loans, 5% equities, and the rest in other investments, including real estate and derivatives.
In terms of credit quality, less than 2% of its debt securities are below investment-grade, with 73% invested in A to AAA rated securities. Compared with peer Manulife, Sun Life has a lower percentage of assets in equities but a higher percentage in BBB (lower-rated investment-grade) securities. Because of its balance sheet, Sun Life is sensitive to changes in interest rates and equity markets.
Sun Life discloses that a 50-basis-point decrease in interest rates would reduce net income by about $50 million, excluding changes to fair value. In addition, Sun Life’s business is sensitive to changes in equity markets and estimates that a 10% decline would reduce net income by $150 million. The company does implement hedges, which can decrease earnings sensitivity, but hedging can be costly and can add risks.
Overall, we assign a Morningstar Uncertainty rating of Medium on Sun Life’s shares. – Morningstar
SLF’s Risk Profile Includes:
-
Economic cyclicality risk
-
interest rate cyclicality risk: 1.5% net income changes per 1% shift in long-term yields
-
M&A execution risk: bolt-one acquisitions
-
regulatory risk: capital requirements were recently raised in Canada globally many different regulatory regimes
-
talent retention risk in the tightest job market in 50 years
-
cyber-security risk: hackers and ransomware
-
currency risk: including the dividend, growing over time as the Asian business expands
How do we quantify, monitor, and track such a complex risk profile? By doing what big institutions do.
Long-Term Risk Analysis: How Large Institutions Measure Total Risk
-
see the risk section of this video to get an in-depth view (and link to two reports) of how DK and big institutions measure long-term risk management by companies
SLF Long-Term Risk-Management Consensus
|
Rating Agency |
Industry Percentile |
Rating Agency Classification |
|
MSCI 37 Metric Model |
100.0% |
AAA Industry Leader, Positive Trend |
|
Morningstar/Sustainalytics 20 Metric Model |
95.8% |
14.9/100 Low Risk |
|
Reuters’/Refinitiv 500+ Metric Model |
90.6% |
Excellent, Stable Trend |
|
S&P 1,000+ Metric Model |
66.0% |
Above-Average, Stable Trend |
|
FactSet |
70.0% |
Above-Average, Positive Trend |
|
Morningstar Global Percentile (All 15,000 Rated Companies) |
90.9% |
Exceptional |
|
Consensus |
86% |
Very Low Risk, Very Good Risk-Management, Stable Trend |
(Sources: Morningstar, FactSet, S&P, Reuters, MSCI)
SLF’s Long-Term Risk Management Is The 16th Best In The Master List (97th Percentile)
|
Classification |
Average Consensus LT Risk-Management Industry Percentile |
Risk-Management Rating |
|
S&P Global (SPGI) #1 Risk Management In The Master List |
94 |
Exceptional |
|
Sun Life Financial |
86 |
Very Good |
|
Strong ESG Stocks |
78 |
Good – Bordering On Very Good |
|
Foreign Dividend Stocks |
75 |
Good |
|
Ultra SWANs |
71 |
Good |
|
Low Volatility Stocks |
68 |
Above-Average |
|
Dividend Aristocrats |
67 |
Above-Average |
|
Dividend Kings |
63 |
Above-Average |
|
Master List average |
62 |
Above-Average |
|
Hyper-Growth stocks |
61 |
Above-Average |
|
Monthly Dividend Stocks |
60 |
Above-Average |
|
Dividend Champions |
57 |
Average bordering on above-average |
(Source: DK Research Terminal)
SLF’s risk-management consensus is in the top 3% of the world’s highest quality companies and similar to that of such other blue-chips as
-
Colgate-Palmolive (CL): Ultra SWAN dividend king
-
Microsoft (MSFT): Ultra SWAN
-
Lockheed Martin (LMT): Ultra SWAN
-
Blackrock (BLK): Ultra SWAN
-
Adobe (ADBE): Ultra SWAN
The bottom line is that all companies have risks, and SLF is very good at managing theirs.
How We Monitor SLF’s Risk Profile
-
16 analysts
-
4 credit rating agencies
-
8 total risk rating agencies
-
24 experts who collectively know this business better than anyone other than management
“When the facts change, I change my mind. What do you do, sir?” – John Maynard Keynes
There are no sacred cows at iREIT or Dividend Kings. Wherever the fundamentals lead, we always follow. That’s the essence of disciplined financial science, the math behind retiring rich and staying rich in retirement.
Bottom Line: This Is One Of The Best Insurance Companies You’ve Never Heard Of
Insurance is all about quantifying, pricing, and managing risk, which is why so insurance is a wonderful industry. And for the best insurance stocks on earth these can be life-changing high-yield investments if you choose the right risk management team.
Sun Life’s risk management is the stuff of legend, which is why this company has prospered and thrived for 152 years.
Risk management isn’t just great for an insurance company; it’s in the top 3% of the world’s best blue-chips.
And that’s not just my opinion; it’s the consensus from eight credit and risk rating agencies.
That’s why this A+ rated insurance giant could keep its dividend safe during the Great Recession when regulators and central banks forced most of its peers to slash or even eliminate their payouts.
SLF has delivered double-digit returns over decades, running circles around not just other financials but even the S&P 500 and Nasdaq.
And thanks to this incredible ability to price and manage risk prudently and invest its insurance float wisely, analysts and management are confident that SLF can continue delivering very safe, generous, and steadily growing returns. Along with market and aristocrat beating double-digit returns that could potentially deliver 25X inflation-adjusted compounding in the coming decades.
If you’re tired of worrying about the economy, interest rates, or the stock market, maybe it’s time to entrust your savings to some of the world’s best risk managers.
If you’re seeking to sleep well at night while bathing in safe and growing dividends, then Sun Life might be right for you.
This is one of the world’s greatest insurance companies and one of the best high-yield blue-chips you can safely buy today. No matter what happens with the economy in the coming years or decades.
Brad’s Takeaway
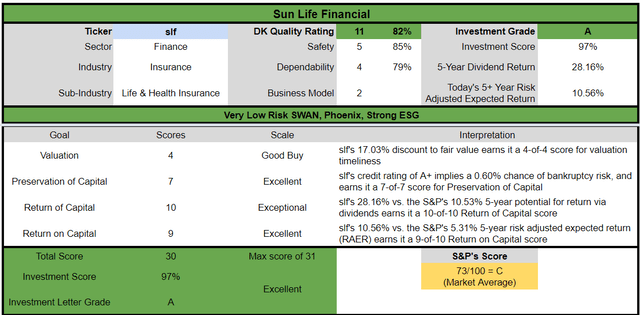
I like SLF but you must remember that this one is in Canada and subject to withholding (learn more here). As Dividend Sensei points out, the stock is compelling, trading at 10.3x versus the normal range of 11.8x. The dividend yield is 4.5% and well-covered with attractive growth estimates of 6% in 2023 and 16% in 2024:
FAST Graphs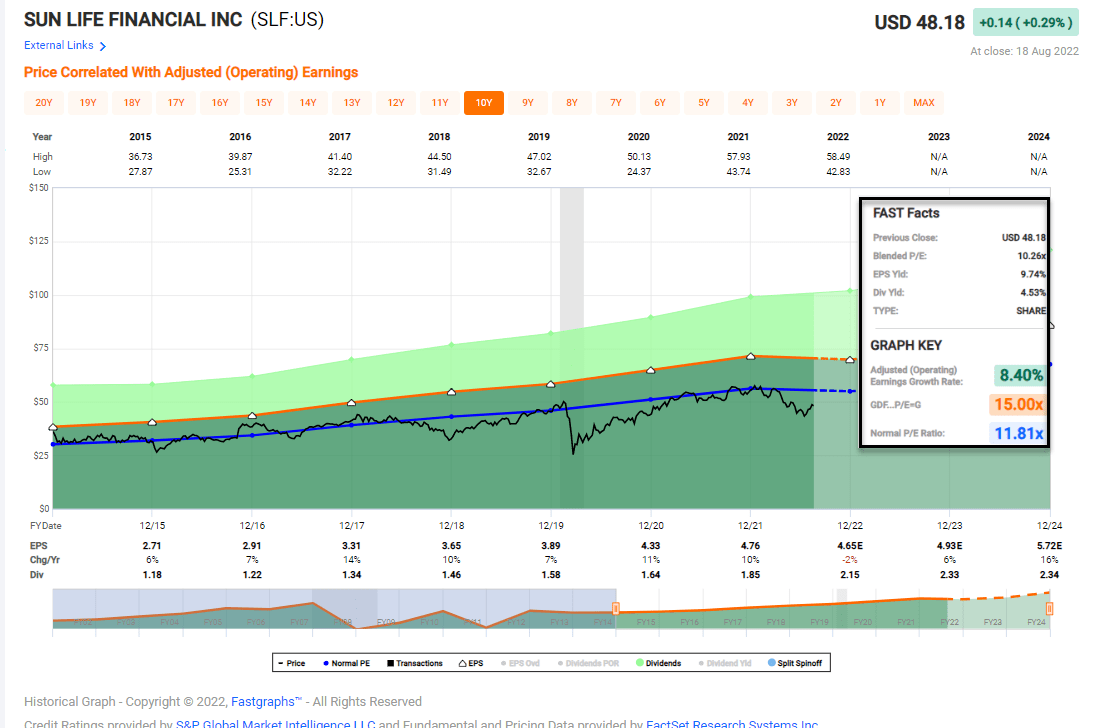
The company has an A-rated balance sheet and could generate returns in the 15% to 20% range. I like the pick, but I’m limiting my exposure to non-US stocks, although I may take a nibble as I really like SLF’s strong track record of distributions, driven by steady growth in earnings.
Fast Graphs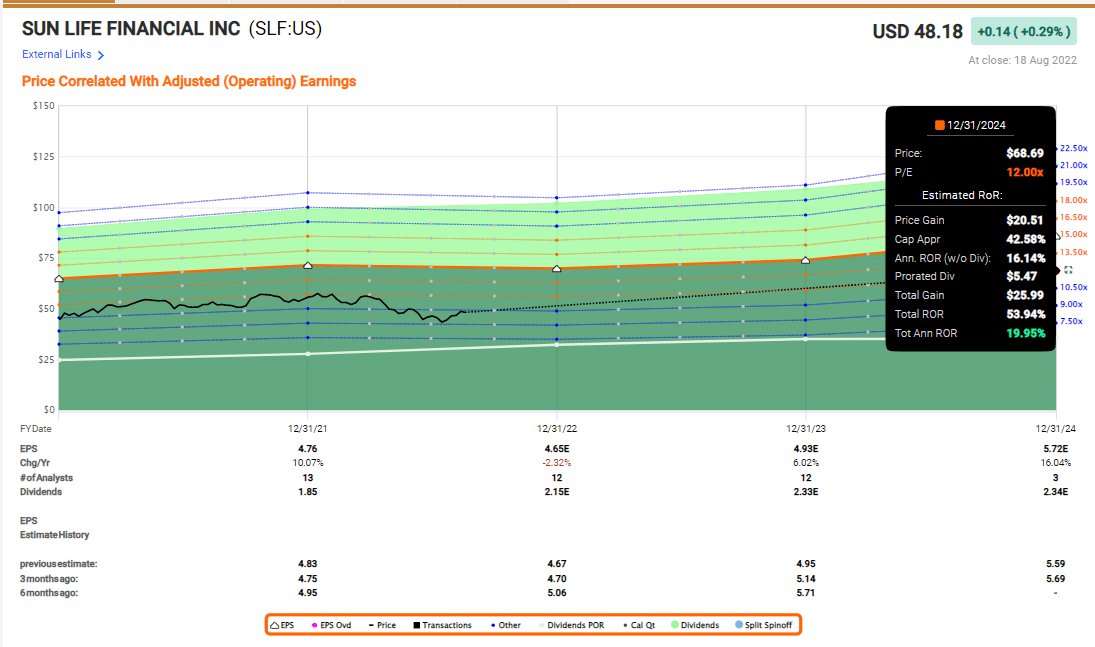
Author’s note: Brad Thomas is a Wall Street writer, which means he’s not always right with his predictions or recommendations. Since that also applies to his grammar, please excuse any typos you may find. Also, this article is free: Written and distributed only to assist in research while providing a forum for second-level thinking.
Be the first to comment