

Poike/iStock via Getty Images
Intro
If we pull up a daily chart of Stride, Inc. (NYSE:LRN) (Education Service Company), we see that we have a potential megaphone top pattern playing itself out in the stock. The sustained pattern of higher highs and lower lows demonstrates an emotional market with an above-average number of participants. Furthermore, the very poor share-price action in October has resulted in shares now trading below their 200-day moving average as well as their 20-day moving average. Suffice it to say, given the stock’s present downward momentum, there is every opportunity that the recent October lows will get tested here sometime over the near term.
Stride Potential Megaphone Pattern (Stockcharts.com)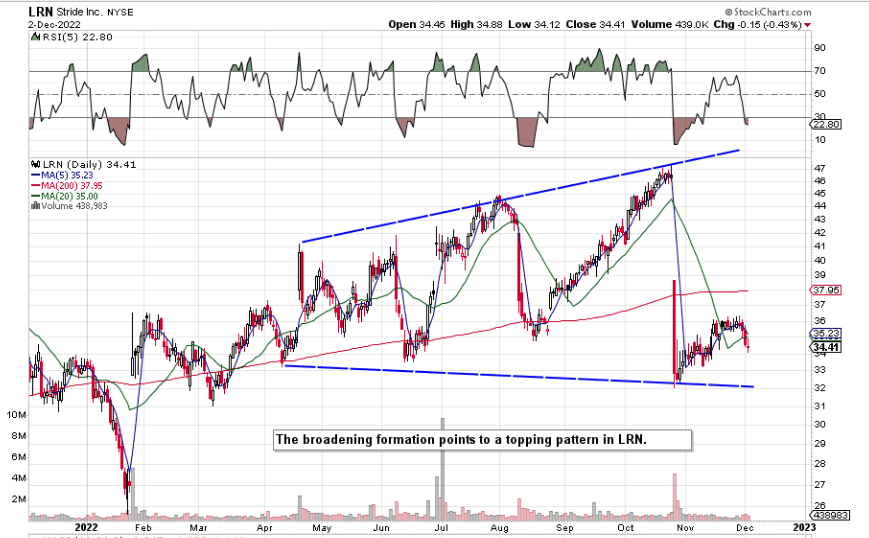
Q1 Surprise
The sharp downturn in the share price seems to have stemmed from the poorer earnings outlook that consensus is expecting going forward. In the company’s first fiscal quarter of this year, Stride reported an operating loss of $314 million, which surprised the market. Career Learning sales grew by over 60% in Q1 but the larger General Education segment witnessed an 11% drop in sales in the quarter to come in at $271.7 million.
Suffice it to say, Q1 trends demonstrated a steeper growth rate in costs than the company’s top-line growth rate. The growth rates of the Career Learnings segment continue to impress but higher costs across the board continue to impair its potential. Consensus is now looking for $1.04 in earnings per share in Q2 along with $0.93 & $0.60 in Q3 & Q4, respectively. Profitability trends in the final two quarters are what is worrying as both of these estimates continue to decline as we see below.
Stride Consensus Earnings Projections (Seeking Alpha)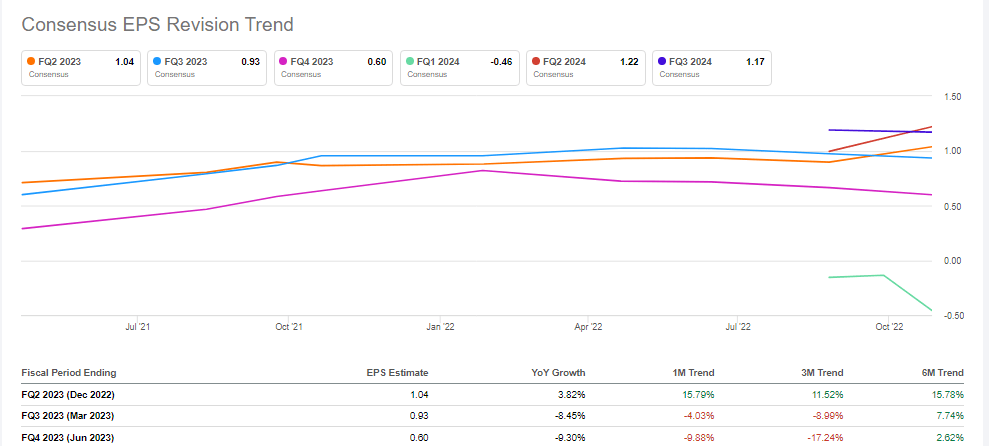
Cash-Flow Worries
Furthermore, Stride, due to how its business is set up, makes its money in the latter three quarters of each fiscal year. Therefore, if downward earnings projections turn out to be true, this will directly affect this fiscal year’s cash-flow generation. As we see below, management wants to put capital to work in academic quality, customer experience, new products & strategic acquisitions as well as return cash to shareholders over time. If Stride’s earnings power continues to come under pressure, however, this will affect the dynamic concerning the quality and speed at which sustained investment can happen in the company over time. Furthermore, from a shareholder’s return standpoint, the number of shares outstanding continues to increase (43+ million) and book value dropped by over $25 million (3%+) in Q1 this year. Suffice it to say, these trends are not conducive to long-term gains.
Stride Capital Allocation Strategy (Seeking Alpha)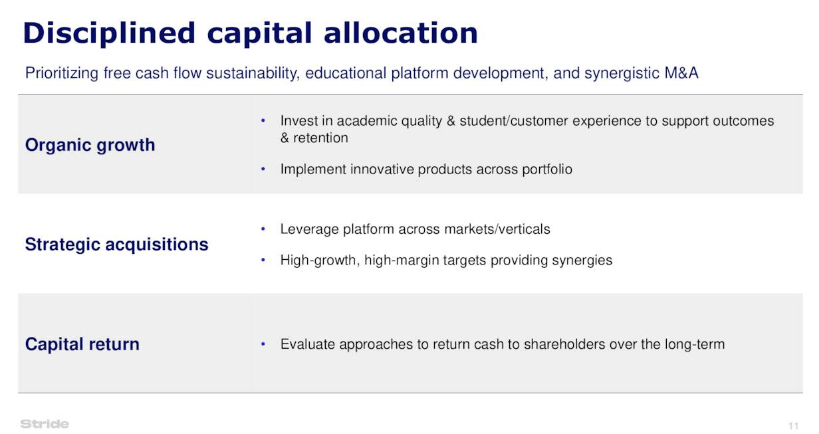
Gross Margin Drop In Q1
Success in a high-inflation environment comes back to protecting that key gross margin metric to ensure profitability can be maintained on the income statement. In Q1, Stride’s gross margin came in at 30.85% which was lower than last year’s print (31.73%) and now well below the trailing 12-month average percentage (34.75%).
Why is this trend noteworthy? Well, gross margin trends come in for extra scrutiny in inflationary times among investors, and with good reason. The reason being is that costs can be very difficult to bring down when the price of literally everything continues to rise. In Stride’s case, for every $1 in revenue, the company earns $0.35 (Trailing 12-month number) in gross profit which currently is resulting in $0.053 in net profit. Suffice it to say, there has been roughly $0.30 of operating costs, tax, and interest expenses to be accounted for before arriving at the company’s $0.053 in net profit for every $1 in sales over the past 12 months.
Now, let’s say that inflation continues to remain elevated over the next 12 months which results in the company’s cost of revenues (or the cost of goods sold) increasing by a mere 5%. This means that our initial cost of goods sold ($0.65) would now increase to $0.683 for every $1 of sales. This means our new gross margin in 12 months comes in under 32% which would be worrying. Why? Well, assuming operating costs, taxes and interest expenses would remain the same ($0.30 per $1 of sales), our new trailing net profit margin in 12 months would come in under 2%.
Conclusion
Therefore to sum up, as we can see in the above exercise, declining gross margins are worrying because they directly affect the most followed metric on Wall Street, earnings growth. Therefore, let’s see what Q2 brings and also how the above technical pattern plays itself out in due course. We look forward to continued coverage.
Be the first to comment