

Jean-Luc Ichard
By Valuentum Analysts
We’re playing the long game when it comes to investing, and we still like the areas of large cap growth and big cap tech as a way to generate significant capital appreciation over the long haul. 2022 hasn’t been the best year for these areas, but as with any drawdown in some of the strongest free-cash-flow generating, net-cash-rich, secular-growth powerhouses, we believe that they once again will reach new highs — it may take a bit longer than previously expected, however. Large cap growth, as measured by the Schwab U.S. Large-Cap Growth ETF (SCHG), in which Microsoft Corp. (NASDAQ:MSFT) is one of the top weightings, has been a strong performer the past 5 years.
The area of large cap growth continues to beat the market and trounce that of REITs during the past five years. (Image Source: Morningstar)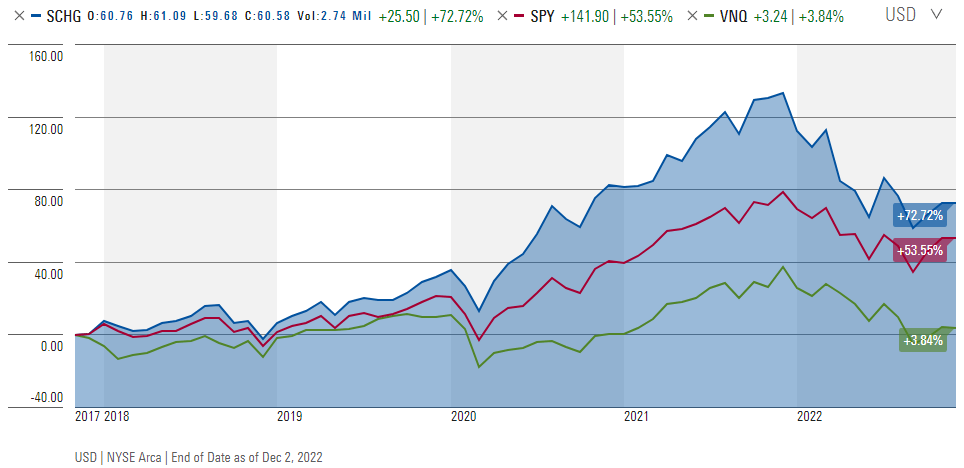
On October 25, 2022, Microsoft reported calendar third-quarter results. We had been expecting weakness in the PC (personal computer) market as well as in news and search advertising spending on the basis of the company’s prior outlook, and the quarterly report from the company was generally in line with the trends that we had been anticipating the past several months. We believe the remainder of calendar 2022 and the first half of 2023 will be difficult for Microsoft, but we continue to love the company’s long-term capital appreciation potential.
As long-term investors, we’re looking past the next few quarters at Microsoft because we know that they are going to be weak, or at least weaker than one might have expected when making forecasts last year. What really matters to the long-term picture at Microsoft, however, is that it continues to generate strong free cash flow, retains an impregnable net cash position on the balance sheet, and builds upon its strong competitive advantages to capture strength at the other side of this ongoing economic weakness.
During Microsoft’s calendar third quarter, the company hauled in $16.9 billion in free cash flow in the period, and it ended the quarter with a net cash position of $58.6 billion, as its total cash and cash equivalents positioned swelled to $107.3 billion. These cash-based sources of intrinsic value remain key attributes behind the resilience of Microsoft’s fair value estimate. In this note, let’s dig into Microsoft and talk about how we derive our fair value estimate and why we think its dividend growth potential is phenomenal.
Microsoft’s Key Investment Considerations
Key Investment Considerations (Image Source: Valuentum)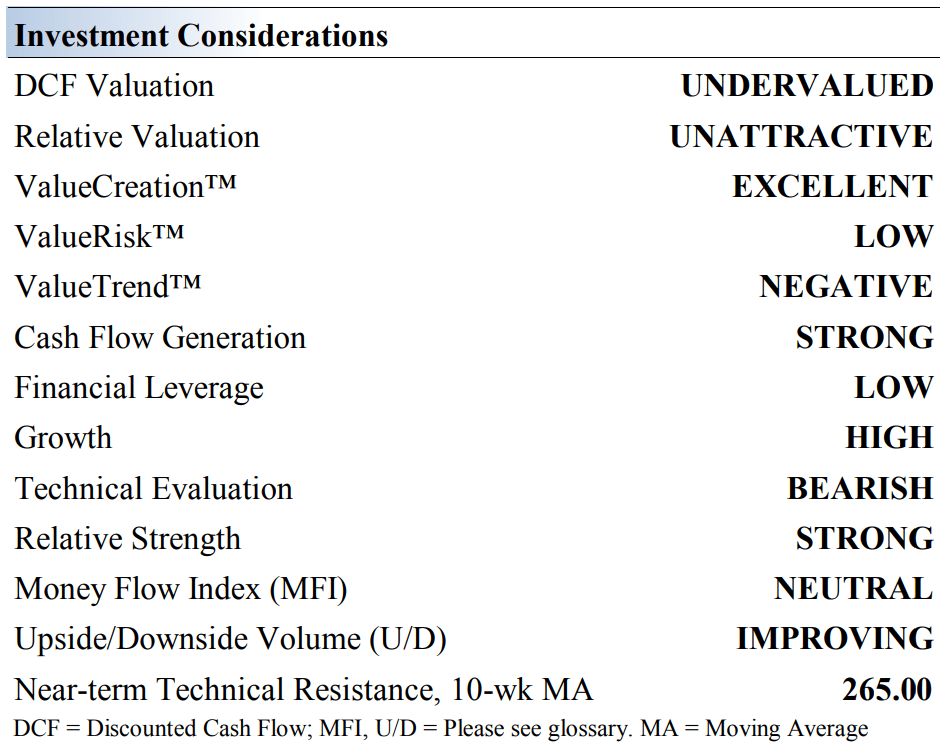
Microsoft’s products include operating systems, cloud services, server applications, desktop and server management tools, software development tools, video games, and online advertising. It also designs, manufactures and sells hardware, including PCs, tablets, gaming consoles, and other smart accessories that integrate with its cloud offerings. The Xbox is consistently one of the best selling items during the holiday season.
Microsoft can’t scoop up its own shares fast enough through its massive buyback program. The firm floats debt with the best credit quality [AAA], and we can’t think of another firm with a better financial profile. Financial discipline and strong execution remain hallmarks of its business, and we don’t think this will change anytime soon.
Microsoft is not a tech dinosaur, and momentum behind new devices and platforms continues to build. Its cloud-based product suite, Office 365 and Azure, continues to catch favor among consumers and enterprises at impressive rates. This momentum has allowed it to achieve goals in commercial cloud annual recurring revenue well ahead of schedule.
Years ago, Microsoft acquired LinkedIn for over $26 billion in cash, and the deal has expanded its addressable market, while helping drive engagement across Office 365. The firm’s impressive financial profile gives us confidence in it moving forward, and its tremendous free cash flow generating capacity has not wavered. Its deal with Activision (ATVI) could open up even more opportunities.
Microsoft’s Windows business has been the bread-and-butter of the company for such a long time, but investor focus has shifted to the company’s other segments as its business model moves towards the cloud. Microsoft is helping drive the transition to cloud-based software products, something that is here to stay.
Microsoft’s Return on Invested Capital
Return on Invested Capital (Image Source: Valuentum)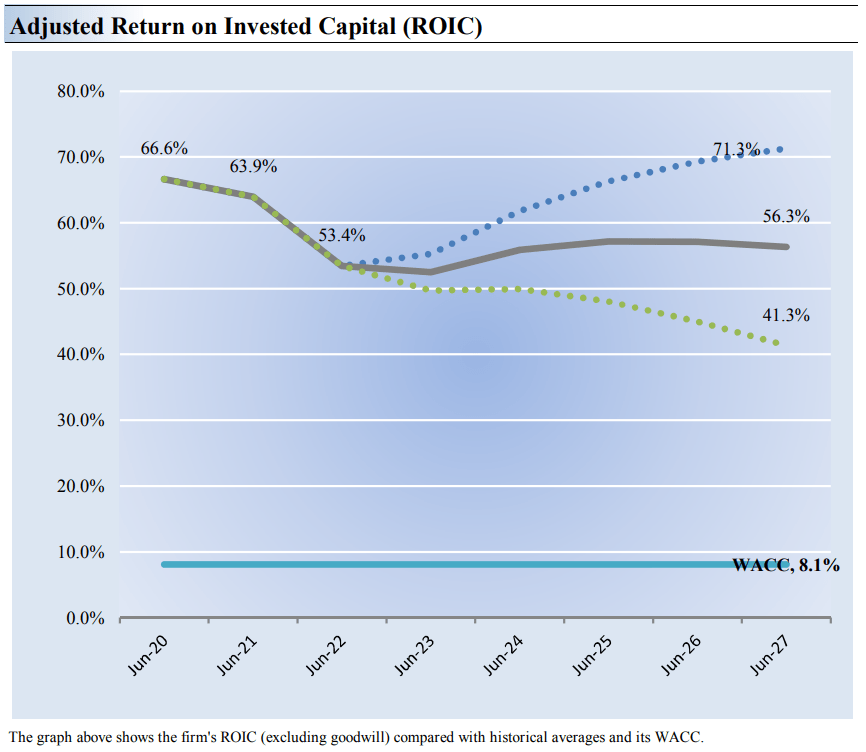
The best measure of a company’s ability to create value for shareholders is expressed by comparing its return on invested capital [ROIC] with its weighted average cost of capital [WACC]. The gap or difference between ROIC and WACC is called the firm’s economic profit spread. Microsoft’s 3-year historical return on invested capital (without goodwill) is 61.3%, which is above the estimate of its cost of capital of 8.1%.
As such, we assign the firm a ValueCreation rating of excellent. In the chart above, we show the probable path of ROIC in the years ahead based on the estimated volatility of key drivers behind the measure. The solid grey line reflects the most likely outcome, in our opinion, and represents the scenario that results in our fair value estimate. Microsoft is a solid economic profit generator and has been for a long time.
Microsoft’s Cash-Flow-Based Valuation Estimate
Cash Flow Generation (Image Source: Valuentum)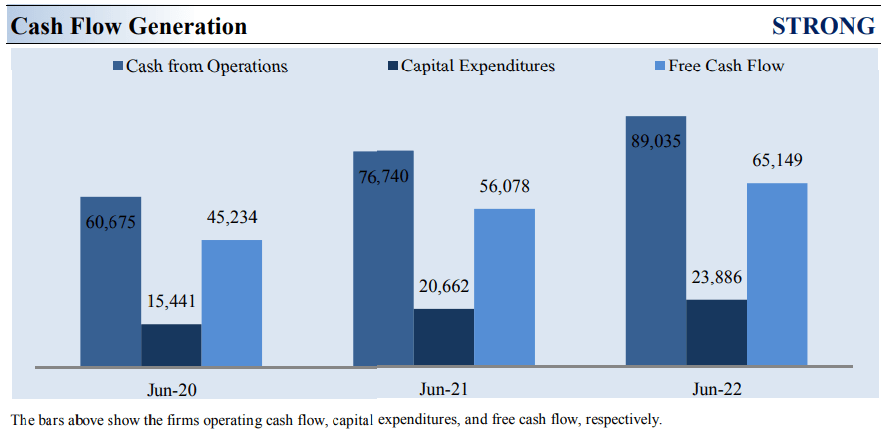
Stocks that generate a free cash flow margin (free cash flow divided by total revenue) above 5% are usually considered cash cows. Microsoft’s free cash flow margin has averaged about 32.6% during the past 3 years. As such, we think the firm’s cash flow generation is very strong. The free cash flow measure shown above is derived by taking cash flow from operations less capital expenditures and differs from enterprise free cash flow, which we use in deriving our fair value estimate for the company. At Microsoft, cash flow from operations increased about 47% from levels registered two years ago, while capital expenditures expanded about 55% over the same time period.
Valuation Assumptions (Image Source: Valuentum)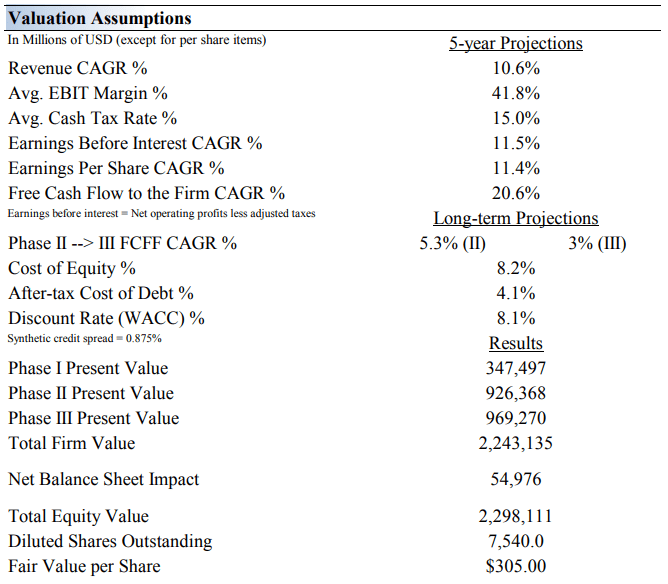
We think Microsoft is worth $305 per share with a fair value range of $244-$366. The margin of safety around our fair value estimate is driven by the firm’s LOW ValueRisk rating, which is derived from an evaluation of the historical volatility of key valuation drivers and a future assessment of them.
Our near-term operating forecasts, including revenue and earnings, do not differ much from consensus estimates or management guidance. Our model reflects a compound annual revenue growth rate of 10.6% during the next five years, a pace that is lower than the firm’s 3- year historical compound annual growth rate of 16.4%.
Our valuation model reflects a 5-year projected average operating margin of 41.8%, which is above Microsoft’s trailing 3- year average. Beyond year 5, we assume free cash flow will grow at an annual rate of 5.3% for the next 15 years and 3% in perpetuity. For Microsoft, we use a 8.1% weighted average cost of capital to discount future free cash flows.
Valuation Breakdown (Image Source: Valuentum)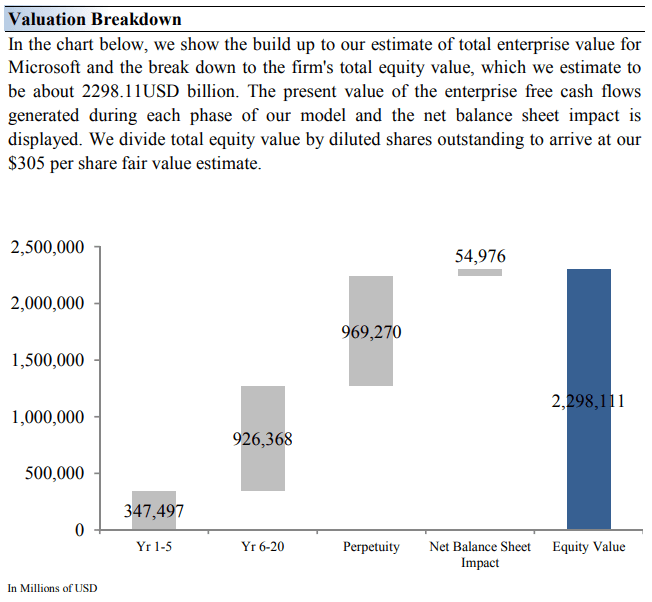
Our Fair Value Estimate Range for Microsoft
Range of Potential Outcomes (Image Source: Valuentum)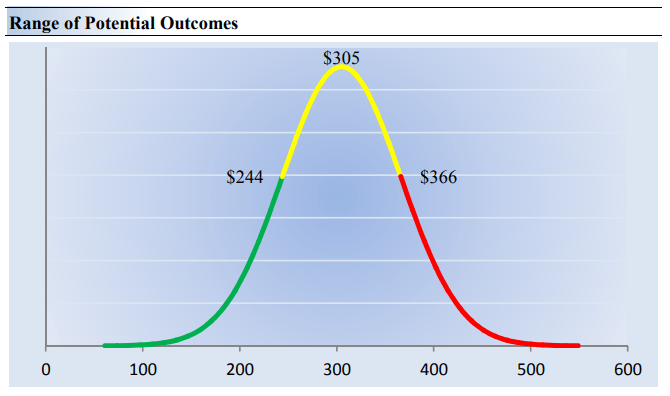
Our discounted cash flow process values each stock on the basis of the present value of all future free cash flows. Although we estimate Microsoft’s fair value at about $305 per share, every company has a range of probable fair values that’s created by the uncertainty of key valuation drivers (like future revenue or earnings, for example). After all, if the future were known with certainty, we wouldn’t see much volatility in the markets as stocks would trade precisely at their known fair values.
Our ValueRisk rating sets the margin of safety or the fair value range we assign to each stock. In the graph above, we show this probable range of fair values for Microsoft. We think the firm is attractive below $244 per share (the green line), but quite expensive above $366 per share (the red line). The prices that fall along the yellow line, which includes our fair value estimate, represent a reasonable valuation for the firm, in our opinion.
Microsoft’s Strong Dividend Health
Dividend Cushion Cash Flow Bridge (Image Source: Valuentum)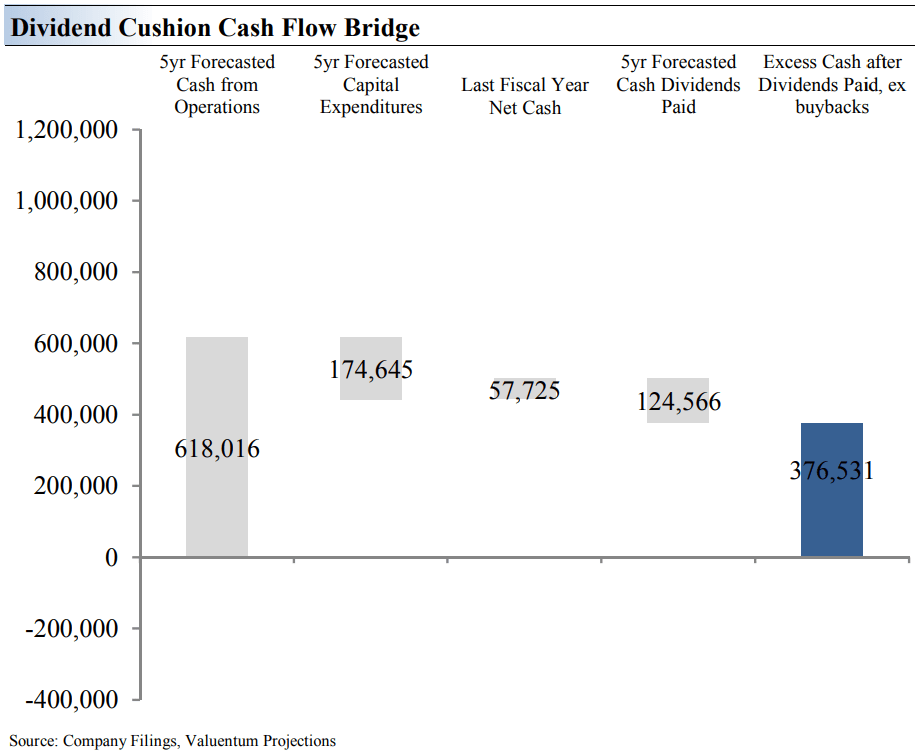
The Dividend Cushion Cash Flow Bridge, shown in the image above, illustrates the components of the Dividend Cushion ratio and highlights in detail the many drivers behind it. Microsoft’s Dividend Cushion Cash Flow Bridge reveals that the sum of the company’s 5-year cumulative free cash flow generation, as measured by cash flow from operations less all capital spending, plus its net cash/debt position on the balance sheet, as of the last fiscal year, is greater than the sum of the next 5 years of expected cash dividends paid.
Because the Dividend Cushion ratio is forward-looking and captures the trajectory of the company’s free cash flow generation and dividend growth, it reveals whether there will be a cash surplus or a cash shortfall at the end of the 5-year period, taking into consideration the leverage on the balance sheet, a key source of risk. On a fundamental basis, we believe companies that have a strong net cash position on the balance sheet and are generating a significant amount of free cash flow are better able to pay and grow their dividend over time.
Stocks that are buried under a mountain of debt and do not sufficiently cover their dividend with free cash flow are more at risk of a dividend cut or a suspension of growth, all else equal, in our opinion. Generally speaking, the greater the ‘blue bar’ to the right (in the image above) is in the positive, the more durable a company’s dividend, and the greater the ‘blue bar’ to the right is in the negative, the less durable a company’s dividend. Microsoft has substantial excess financial capacity to continue to keep growing its dividend.
Dividend Cushion Ratio Deconstruction (Image Source: Valuentum)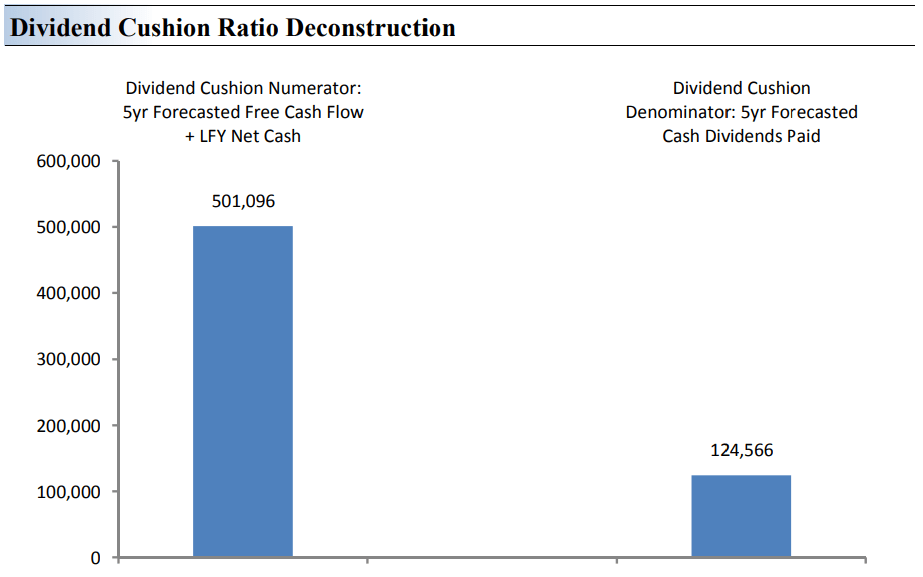
The Dividend Cushion Ratio Deconstruction, shown in the image above, reveals the numerator and denominator of the Dividend Cushion ratio. At the core, the larger the numerator, or the healthier a company’s balance sheet and future free cash flow generation, relative to the denominator, or a company’s cash dividend obligations, the more durable the dividend.
In the context of the Dividend Cushion ratio, Microsoft’s numerator is larger than its denominator suggesting strong dividend coverage in the future. The Dividend Cushion Ratio Deconstruction image puts sources of free cash in the context of financial obligations next to expected cash dividend payments over the next 5 years on a side-by-side comparison.
Because the Dividend Cushion ratio and many of its components are forward-looking, our dividend evaluation may change upon subsequent updates as future forecasts are altered to reflect new information, as in the ATVI transaction, for example. Microsoft’s Dividend Cushion ratio stands at 4 at this time of this writing.
The Dividend Cushion ratio is one of the most powerful financial tools an income or dividend growth investor can use in conjunction with qualitative dividend analysis. The ratio is one-of-a-kind in that it is both free-cash-flow based and forward looking. Since its creation in 2012, the Dividend Cushion ratio has forewarned readers of approximately 50 dividend cuts. We estimate its efficacy at ~90%. (Image Source: Valuentum)
Concluding Thoughts
The next few quarters may be a bit weaker than investors had been expecting at Microsoft, as the gaming markets, PC demand, and general tech spending slow relative to the robust pace of years ago. The software giant has a lot of moving parts, especially with its cloud business and its deal with ATVI, but Microsoft remains a solid free cash flow generator with a fantastic balance sheet, both of which support its $305 per share fair value estimate and lofty Dividend Cushion ratio of 4. Microsoft remains one of our all-around favorite ideas, and it may just turn into the best dividend growth stock over the next few decades. We’re fans.
This article or report and any links within are for information purposes only and should not be considered a solicitation to buy or sell any security. Valuentum is not responsible for any errors or omissions or for results obtained from the use of this article and accepts no liability for how readers may choose to utilize the content. Assumptions, opinions, and estimates are based on our judgment as of the date of the article and are subject to change without notice.
Be the first to comment