

S&P 500, Nasdaq 100 Talking Points:
- Stocks pulled back this morning as the 10-year Treasury tested above the same 2.5% that was resistance in late-March.
- This morning also brought a comment from Lael Brainard indicating that the Fed would be looking to begin QT in May. This was a pensive topic that Powell punted on in March and this helped stocks to launch in a massive rally after the Fed hiked rates. The Nasdaq gained more than 17% in a little over two weeks on the back of that rate hike. But now that QT has entered the conversation matters may begin to shift.
- We’ve just released Top Trades for Q2 and my selection is bearish equities. My expectation is for this theme to develop later in the quarter.
- The analysis contained in article relies on price action and chart formations. To learn more about price action or chart patterns, check out our DailyFX Education section.
Q2 Begins
Stocks were strong for the first couple days of Q2 trade, riding the wave of strength that triggered around the FOMC rate decision a few weeks ago. While the Fed hiked rates for the first time since 2018 while warning that many more hikes were likely on the way, stocks put in an aggressive bounce that ran through the end of March. The S&P 500 gained as much as 12.9% from the February low, while the Nasdaq 100 put in a whopping 17.97% from the low on March 15th up to the high on March 29th.
Those are the types of moves that’s often indicative of bubble-behavior, when trillions in market cap are added very suddenly even without a direct fundamental argument as to why. The big change here appears to be the Fed avoiding the topic of Quantitative Tightening.
For a while they were expected to hike by 50 in March while announcing QT. But, due to market turbulence from the Russia-Ukraine scenario the Fed backed way down, settling with a single 25 basis point hike to start ‘lift off.’
But, now that the Fed has that first hike in the books and, also taken with the fact that markets put in an exuberant rally on the back of a relatively-dovish move from the FOMC, and there now may be even more motive for the FOMC to pick up the pace of tightening. And that leads into Lael Brainard’s comments this morning, indicating that the bank is gearing up for a QT announcement in May.
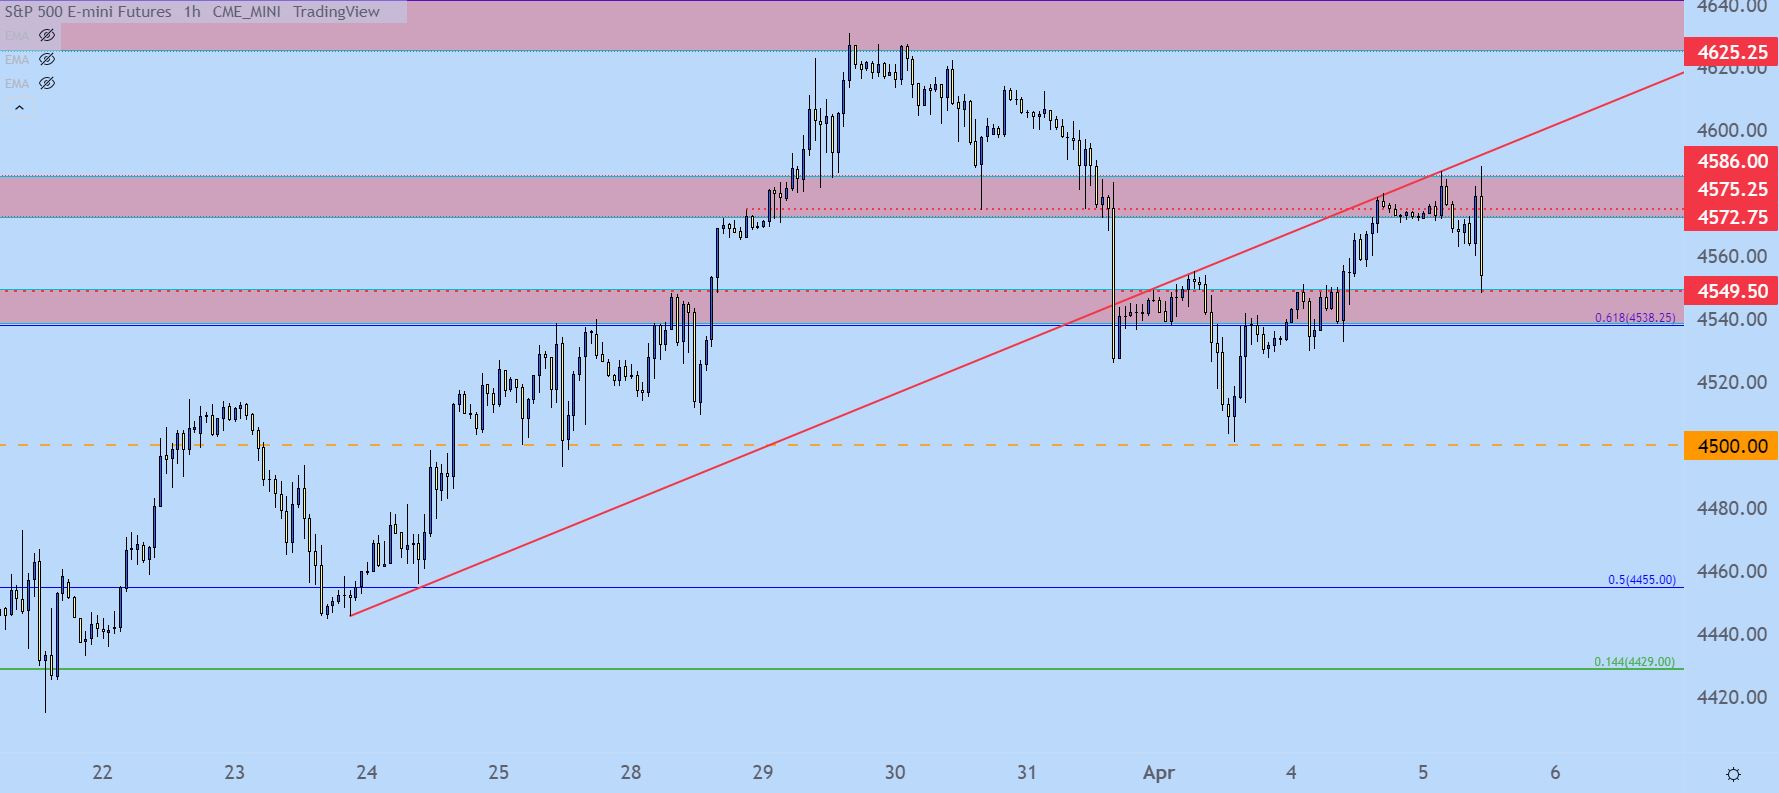
In response, the 10-year note popped above 2.5% and this seems to be bringing some strain to stocks, with the S&P 500 pulling back to the 4550 spot on the chart.
S&P 500 Hourly Price Chart
Chart prepared by James Stanley; S&P 500 on Tradingview
S&P 500 Bigger Picture
Taking a step back and there’s a couple of things going on with the S&P 500 chart.
First and foremost, there’s a bullish setup on the daily chart. Yesterday confirmed a morning star formation which is a three bar sequence looking for bullish reversals. Often, these formations will print near lows after a downtrend bottoms out, which is not what we have here. Instead, we had a pullback, and that formation may be marking the end of the retracement, which can keep the focus on the long side of the pair.
However, that formation is negated on a breach of the low, which comes in at the psychological 4500 area on the chart. And if that zone is taken-out, there’s another spot of support from 4430-4455, and a test here opens the door for a bounce up to lower-highs around 4500. That could prelude a larger bearish move in the S&P 500.
But, if the morning star continues to push prices higher, a breach of the high from last week, around 4630, opens the door for a move up towards 4700.
S&P 500 Daily Price Chart
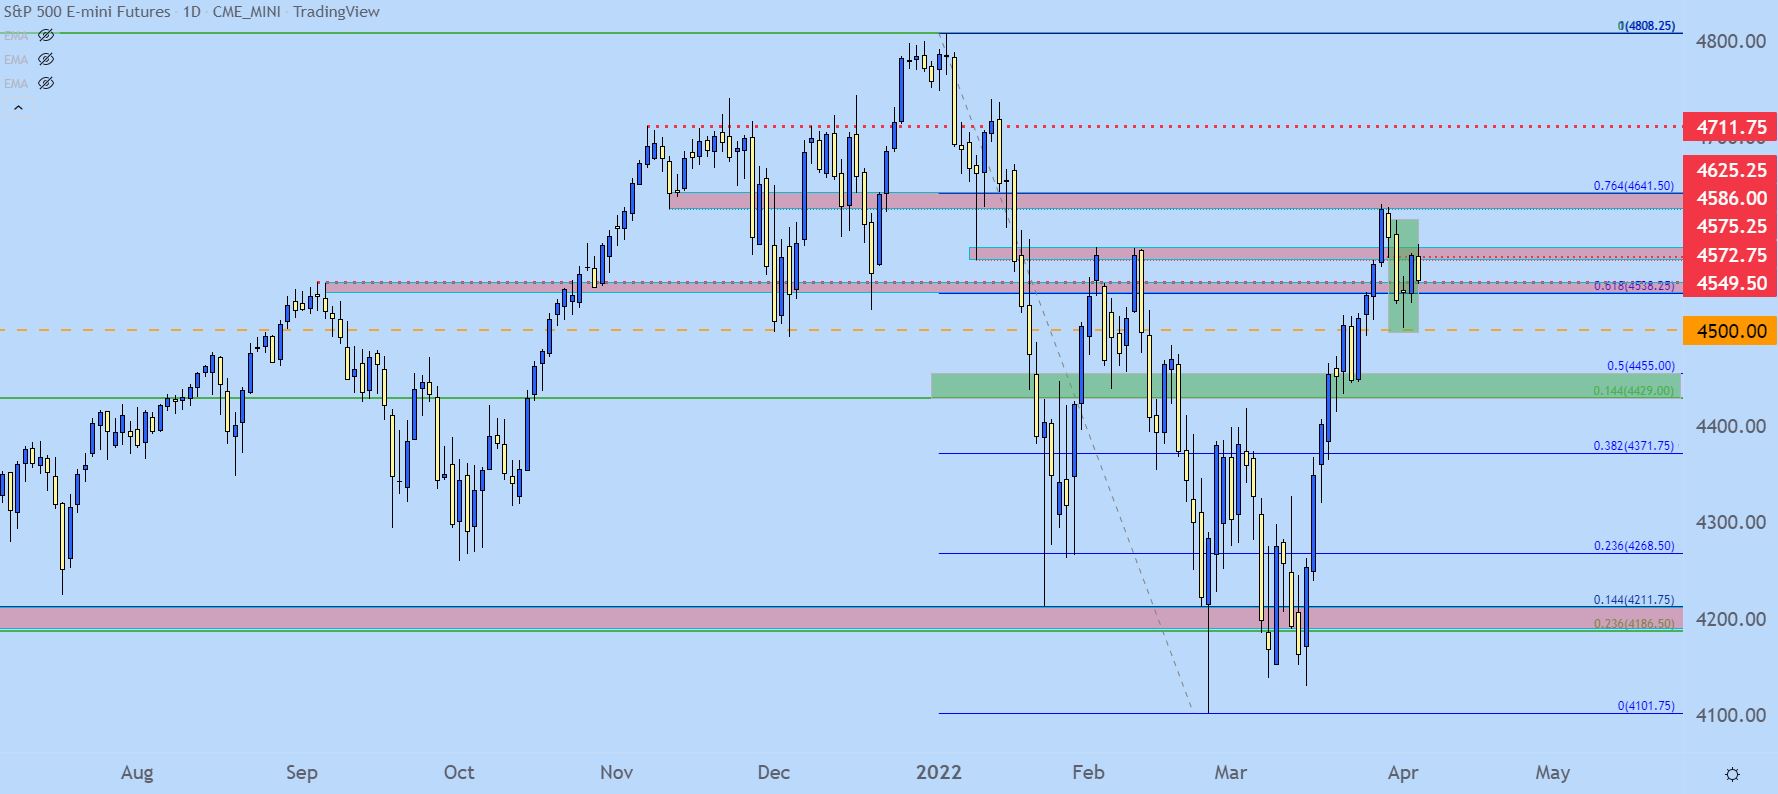
Chart prepared by James Stanley; S&P 500 on Tradingview
Nasdaq 100
I remain more bearish here than the S&P 500. The moves have certainly been more emphatic, witnessed by that 17.97% rip while the S&P 500 was up a more modest 12.9% over a similar period of time.
But perhaps more interesting, when stocks were selling-off into the first-half of March, the Nasdaq 100 had an extra heavy move, eventually tickling ‘bear market territory’ ahead of the FOMC rate hike, which then launched prices higher.
But, as I wrote in the Top Trades for this quarter, there’s a possible double top in the Nasdaq 100. There’s about 2,000 points from the top to the neckline, which aligns with that support from late-February, early-March. The key here is sellers defending resistance at 15,307.
This would also bring a projected target of the approximate distance from resistance to the neckline, which would project down to around the 11,000 area on the chart.
Nasdaq 100 Daily Price Chart
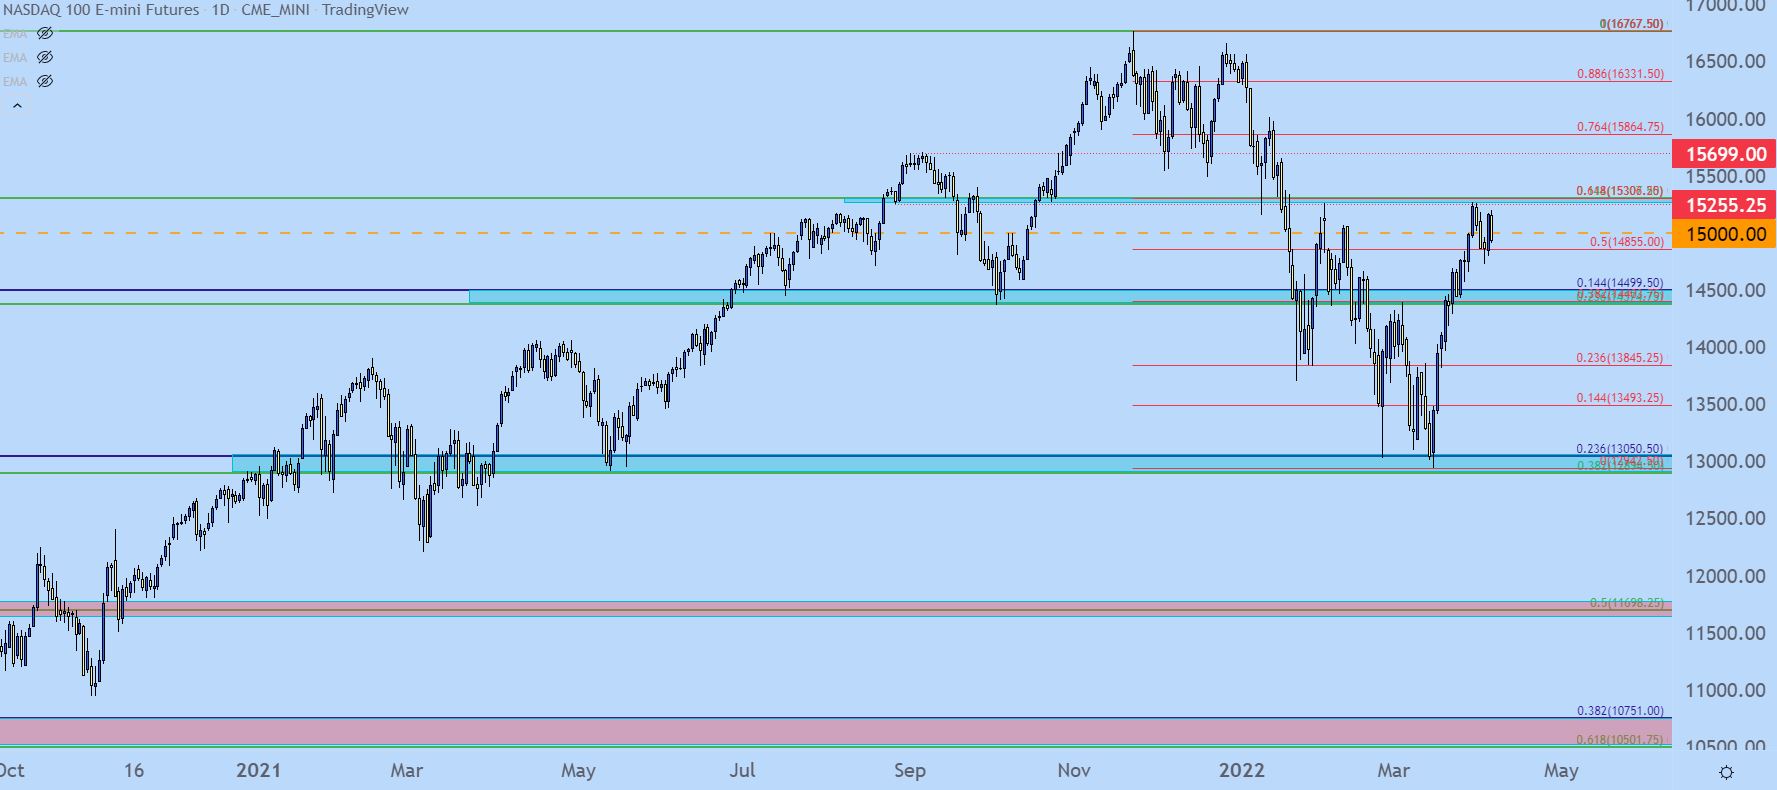
Chart prepared by James Stanley; Nasdaq 100 on Tradingview
Nasdaq 100 Shorter-Term
When looking for a significant change in market direction, it’s always wise to investigate the counter-side to the argument. And, shorter-term, there could be bullish potential in here, too; one must not be so blinded by their own biases that they can’t even consider alternatives.
For the double top to ‘activate’ prices would need to take out the neckline, around support at current 10-month lows. But, until that low is taken-out, we have a range and that’s it. And if bulls can deal with resistance in short order that double top will never fill-in and we’ll have an entirely different picture to look at.
The bullish thesis here would be similar to a cup-and-handle pattern, where prices bottomed and immediately returned to resistance, after which sellers responded to help form a ‘handle.’ If buyers can burst through resistance in short order, the next major spot of resistance on my chart is around 15.7k, after the current two-month-highs around the Fibonacci level at 15,307.
Nasdaq 100 Four-Hour Price Chart
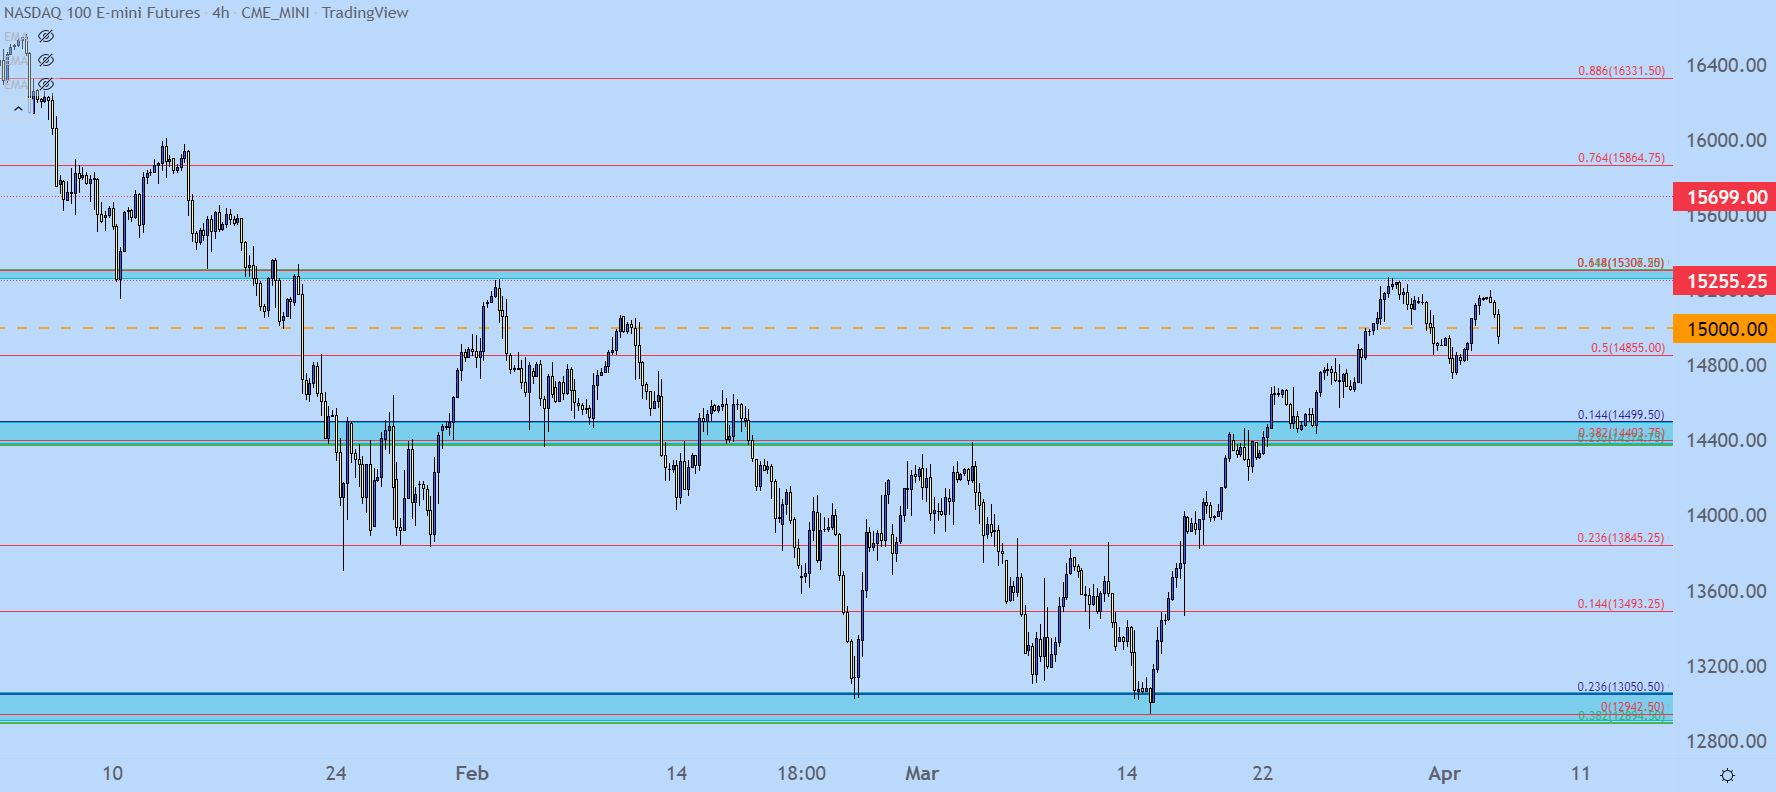
Chart prepared by James Stanley; Nasdaq 100 on Tradingview
— Written by James Stanley, Senior Strategist for DailyFX.com
Contact and follow James on Twitter: @JStanleyFX
Be the first to comment