

RiverNorthPhotography
Earnings of Stock Yards Bancorp, Inc. (NASDAQ:SYBT) will most probably continue on an uptrend this year on the back of moderate organic loan growth. Further, the margin will likely expand despite an unfavorable balance sheet positioning. Overall, I’m expecting Stock Yards Bancorp to report earnings of $3.83 per share for 2023, up 19% from my estimated earnings of $3.20 per share for 2022. The December 2023 target price suggests a moderate downside from the current market price. Based on the total expected return, I’m adopting a hold rating on Stock Yards Bancorp.
Regional Economic Factors to Continue to Boost Earnings
Stock Yard Bancorp’s loan portfolio grew by 4% in the third quarter, which is very impressive because it was through organic means and the company’s organic growth has remained quite low in the past. The company has historically relied on acquisitions for growth. Going forward, the third quarter’s level will not be sustained because it was unusually high.
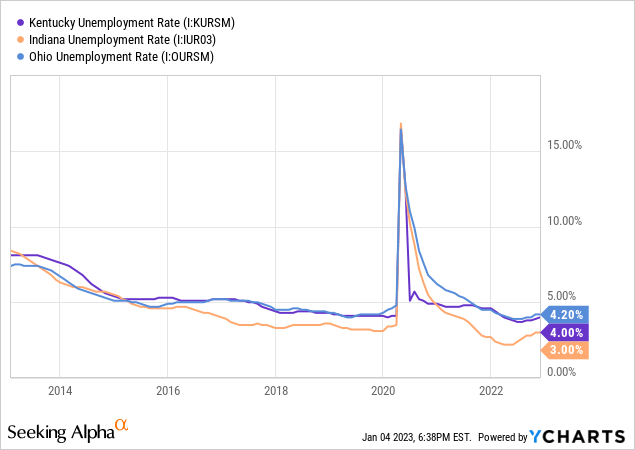
Most of Stock Yard Bancorp’s loans are to commercial customers; therefore, the unemployment rate is a good indicator of future loan growth. Stock Yards mostly operates in Kentucky, with some presence in Indianapolis, Indiana, and Cincinnati, Ohio. All three states have low unemployment rates in a historical context, as shown below.
The coincident economic activity index is another important gauge of credit demand. As shown below, the trendlines for all three states have started to flatten. Nevertheless, they are still at a healthy level compared to their respective pasts.
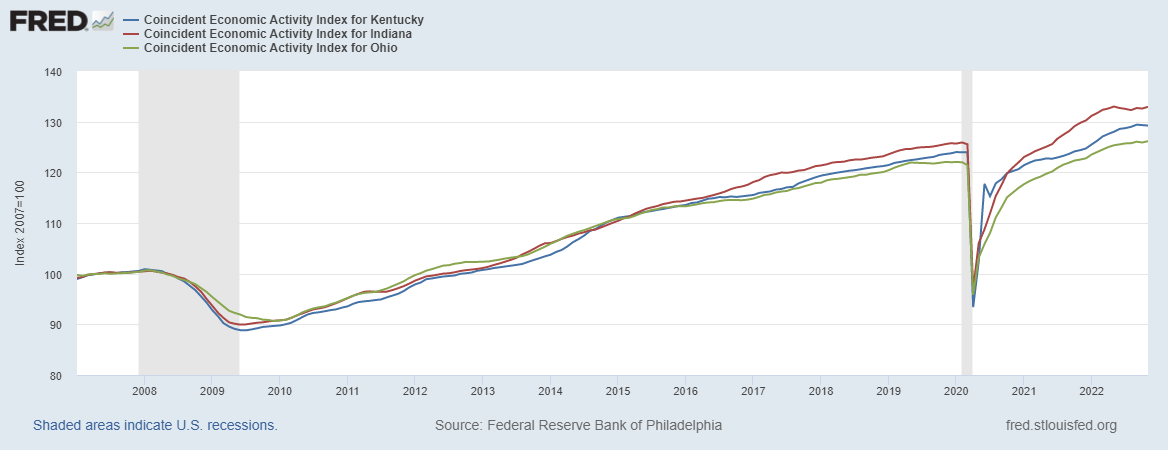
The Federal Reserve Bank of Philadelphia
Residential loans make up a sizable 21% of total loans. The outlook for this segment is not as bright as that for commercial loans because of high borrowing costs. Residential borrowers do not have customers, so they cannot pass on their borrowing costs, unlike commercial borrowers. Therefore, mortgage rates are a key factor that determines residential loan demand.
Considering these factors, I’m expecting the loan portfolio to have increased by 1.5% in the last quarter of 2022, taking full-year growth to 23%. For 2023, I’m expecting the portfolio to grow by 6%. Further, I’m expecting deposits to grow in line with loans. The following table shows my balance sheet estimates.
| Financial Position | FY18 | FY19 | FY20 | FY21 | FY22E | FY23E |
| Net Loans | 2,523 | 2,818 | 3,480 | 4,115 | 5,078 | 5,389 |
| Growth of Net Loans | 5.8% | 11.7% | 23.5% | 18.3% | 23.4% | 6.1% |
| Other Earning Assets | 596 | 694 | 896 | 2,097 | 1,894 | 1,951 |
| Deposits | 2,794 | 3,134 | 3,989 | 5,788 | 6,598 | 7,003 |
| Borrowings and Sub-Debt | 95 | 123 | 91 | 86 | 161 | 166 |
| Common equity | 367 | 406 | 441 | 676 | 812 | 890 |
| Book Value Per Share ($) | 16.0 | 17.8 | 19.4 | 26.9 | 27.6 | 30.3 |
| Tangible BVPS ($) | 16.0 | 17.1 | 18.7 | 21.5 | 20.7 | 23.4 |
| Source: SEC Filings, Author’s Estimates(In USD million unless otherwise specified) | ||||||
Slight Margin Growth is Likely Despite the Odds
Stock Yards Bancorp was able to grow its margin by 9 basis points in the second quarter and 26 basis points in the third quarter of 2022 despite its unfavorable balance sheet positioning. The company’s balance sheet is in an unenviable position, given the current rising-rate environment, as its assets are slower to reprice than deposits. As a result, the margin stands to initially get hurt by rate hikes. Adjustable-rate deposits, including interest-bearing demand, savings, and money market accounts, altogether made up 59% of total deposits at the end of September 2022. In comparison, only 31% of total loans are based on variable rates, as mentioned in the 10-Q filing.
The results of the management’s interest-rate simulation model show that a 200-basis points hike in interest rates can decrease the net interest income by 1.56%.
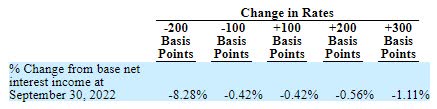
3Q 2022 10-Q Filing
On the plus side, the anticipated loan additions will raise the margin as they will originate at higher rates compared to the portfolio’s average yield. Considering these factors, I’m expecting the margin to have remained stable in the fourth quarter of 2022. Further, I’m expecting the margin to grow by four basis points in 2023.
Expecting Earnings to Surge by 19% in 2023
The anticipated loan growth and slight margin expansion will support earnings this year. Further, the outlook for wealth management fee income is bright. The company’s assets under management have surged from $4.8 billion at the end of December 2021 to $6.3 billion at the end of September 2022, as mentioned in the earnings presentation. Meanwhile, I’m expecting the provision for expected loan losses to remain at a normal level. I’m expecting the net provision expense to make up around 0.15% of total loans in 2023, which is the same as the average for the last five years.
Overall, I’m expecting Stock Yards Bancorp to report earnings of $3.20 per share for 2022, up 8% year-over-year. For 2023, I’m expecting earnings to grow by 19% to $3.83 per share. The following table shows my income statement estimates.
| Income Statement | FY18 | FY19 | FY20 | FY21 | FY22E | FY23E |
| Net interest income | 114 | 125 | 136 | 171 | 231 | 260 |
| Provision for loan losses | 3 | 1 | 18 | (1) | 9 | 8 |
| Non-interest income | 45 | 50 | 52 | 66 | 91 | 96 |
| Non-interest expense | 90 | 98 | 102 | 142 | 191 | 202 |
| Net income – Common Sh. | 56 | 66 | 59 | 75 | 94 | 112 |
| EPS – Diluted ($) | 2.42 | 2.89 | 2.59 | 2.97 | 3.20 | 3.83 |
| Source: SEC Filings, Earnings Releases, Author’s Estimates (In USD million unless otherwise specified) | ||||||
My estimates are based on certain macroeconomic assumptions that may not come to fruition. Therefore, actual earnings can differ materially from my estimates.
Year-End Target Price is Below the Current Market Price
Given the earnings outlook, I’m expecting the company to increase its dividend by $0.01 per share to $0.30 per share in the third quarter of 2023. The earnings and dividend estimates suggest a payout ratio of 31% for 2023, which is below the five-year average of 41%. Therefore, there is room for a greater dividend hike next year than $0.01 per share, but I’d rather be on the conservative side. Based on my dividend estimate, Stock Yards Bancorp is offering a forward dividend yield of 1.9%.
I’m using the historical price-to-tangible book (“P/TB”) and price-to-earnings (“P/E”) multiples to value Stock Yards Bancorp. The stock has traded at an average P/TB ratio of 2.20x in the past, as shown below.
| FY19 | FY20 | FY21 | Average | |||
| T. Book Value per Share ($) | 17.1 | 18.7 | 21.5 | |||
| Average Market Price ($) | 36.4 | 37.1 | 53.4 | |||
| Historical P/TB | 2.13x | 1.98x | 2.49x | 2.20x | ||
| Source: Company Financials, Yahoo Finance, Author’s Estimates | ||||||
Multiplying the average P/TB multiple with the forecast tangible book value per share of $23.4 gives a target price of $51.4 for the end of 2023. This price target implies a 17.4% downside from the January 4 closing price. The following table shows the sensitivity of the target price to the P/TB ratio.
| P/TB Multiple | 2.00x | 2.10x | 2.20x | 2.30x | 2.40x |
| TBVPS – Dec 2023 ($) | 23.4 | 23.4 | 23.4 | 23.4 | 23.4 |
| Target Price ($) | 46.8 | 49.1 | 51.4 | 53.8 | 56.1 |
| Market Price ($) | 62.3 | 62.3 | 62.3 | 62.3 | 62.3 |
| Upside/(Downside) | (24.9)% | (21.1)% | (17.4)% | (13.6)% | (9.9)% |
| Source: Author’s Estimates |
The stock has traded at an average P/E ratio of around 15.0x in the past, as shown below.
| FY19 | FY20 | FY21 | Average | |||
| Earnings per Share ($) | 2.89 | 2.59 | 2.97 | |||
| Average Market Price ($) | 36.4 | 37.1 | 53.4 | |||
| Historical P/E | 12.6x | 14.3x | 18.0x | 15.0x | ||
| Source: Company Financials, Yahoo Finance, Author’s Estimates | ||||||
Multiplying the average P/E multiple with the forecast earnings per share of $3.83 gives a target price of $57.3 for the end of 2023. This price target implies a 7.9% downside from the January 4 closing price. The following table shows the sensitivity of the target price to the P/E ratio.
| P/E Multiple | 13.0x | 14.0x | 15.0x | 16.0x | 17.0x |
| EPS 2023 ($) | 3.83 | 3.83 | 3.83 | 3.83 | 3.83 |
| Target Price ($) | 49.7 | 53.5 | 57.3 | 61.1 | 65.0 |
| Market Price ($) | 62.3 | 62.3 | 62.3 | 62.3 | 62.3 |
| Upside/(Downside) | (20.2)% | (14.1)% | (7.9)% | (1.8)% | 4.4% |
| Source: Author’s Estimates |
Equally weighting the target prices from the two valuation methods gives a combined target price of $54.4, which implies a 12.6% downside from the current market price. Adding the forward dividend yield gives a total expected return of negative 10.8%. Hence, I’m adopting a hold rating on Stock Yards Bancorp.
Be the first to comment