


Sitade/iStock via Getty Images
Stock based compensation, or SBC for short, has been a topic firmly on my mind considering the state of the stock market. It is not a sexy subject, yet I felt that with the continued breakdown of high-growth names so far in 2022, along with what I see is continued abuse of SBC, my article highlighting a few egregious examples from March of this year could use a refresher.
In this article, I will discuss what stock based compensation is and provide a list of equities that, in my opinion, are the most egregious offenders utilizing stock based compensation, along with a list of companies that I believe are doing it the right way… or at least, not quite as terribly.
What is stock based compensation?
The very basic definition of stock-based compensation is that it is a non-cash way of paying employees by way of issuing stock options as part of an overall compensation package.
Theoretically, stock options and awards create an alignment with shareholders who have a financial interest in seeing the company prosper. Stock options have a vesting period before shares can be earned and thus sold, also creating an incentive for talented employees and executives to stay with the company for a given period.
Stock-based compensation is not a new phenomenon and is used in virtually all industries and by nearly all public companies. Historically, SBC has been a very valuable tool for retention and alignment of key executives.
In the last decade, given the historically low interest rates in the United States and the avalanche of venture funds flowing into the stock market, SBC levels have been on a meteoric rise, beginning around 2013, particularly in the software and technology sector.
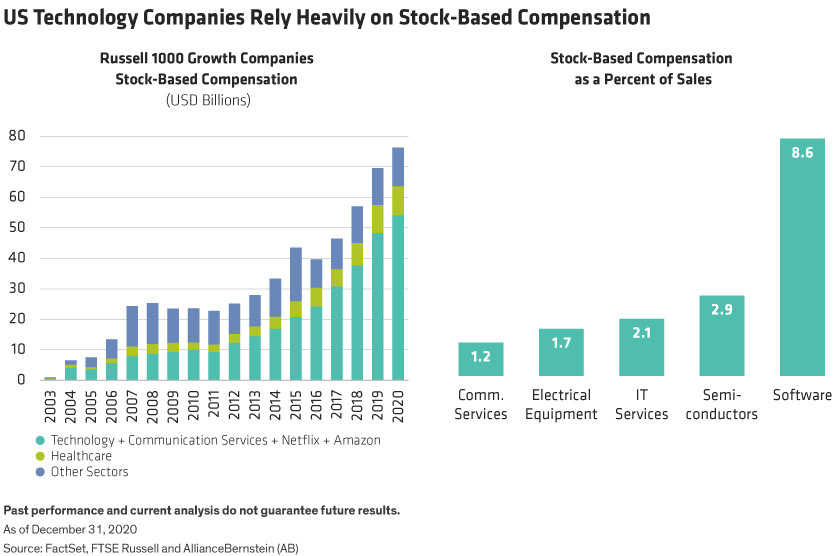
Alliance Bernstein
The reason behind this rise appears to be quite simple. SBC is a cash neutral way of supercharging a young technology company’s financials. If you are a hot new start-up with a billion-dollar idea, you need the best and the brightest programmers, coders, developers, and sales reps, yet you do not have the cash on hand, nor the earnings required to pay them each $400,000 per year in cash.
To lure this top notch talent away from Microsoft (MSFT), Oracle (ORCL), IBM (IBM), Alphabet (GOOGL) etc., who are currently paying them $300,000 cash per year plus $50,000 in SBC, you offer them $150,000 in cash per year and $250,000 in stock. In a low interest rate environment, when any stock that was IPO’ed in the market was soaring, this playbook works to perfection, you conserve the cash you need, show strong non-GAAP gross margins and insane revenue growth… Life is good.
The problem is, good times never last. When interest rates rise and the stock market totally obliterates your stock, how do you hang onto these vital employees when the $250,000 in SBC you have issued them becomes virtually worthless. This is when the problem of dilution really rears its ugly head. Companies in this situation often will award these vital employees the original intended value of the compensation package to keep them with the company, leading to massive dilution to shareholders.
For example, in the above scenario, company X decides to award the employee 25,000 shares of stock at the current $10 a share price, when originally, the stock traded at $40 a share and the employee was only due 6,250 shares. When you multiply this out over an entire organization, as a shareholder of this company, your ownership has just been massively diluted.
Clearly, this is a hypothetical situation, however, many companies in the market are about to face this exact situation considering that nearly all of the high-fliers of the 2020-21 period have been brutally sold off during 2022 so far.
Worst Offenders
Below I have compiled a list of equities that, in my opinion, appear to have rather egregious SBC costs and may end up with significant dilution. In this list, I will measure each company based on SBC as a percentage of revenues. Please keep in mind, this is not a list of all equities, only those that I watch on a regular basis.
| Name | Total TTM SBC Cost | SBC As A Percentage Of TTM Revenue |
| Matterport, Inc. (MTTR) | $183.5 Million | 151.7% |
| C3.ai (AI) | $179.6 Million | 66.5% |
| Robinhood Markets (HOOD) | $811.4 Million | 60.5% |
| Snowflake, Inc. (SNOW) | $756.5 Million | 40.6% |
| SentinelOne, Inc. (S) | $144 Million | 39.8% |
| The Trade Desk (TTD) | $576.5 Million | 38.8% |
| Okta, Inc. (OKTA) | $669.6 Million | 38.6% |
| Unity Software (U) | $474 Million | 37.7% |
| Asana, Inc (ASAN) | $178.1 Million | 35% |
| Zscaler, Inc. (ZS) | $424.8 Million | 34.9% |
| UiPath, Inc. (PATH) | $347.8 Million | 33.4% |
| Palantir Technologies (PLTR) | $602 Million | 32.8% |
| Bill.com (BILL) | $231.9 Million | 30.7% |
| MongoDB (MDB) | $353.1 Million | 29.6% |
| Alteryx, Inc. (AYX) | $202.9 Million | 27.8% |
Source: Author created using Seeking Alpha data
I truly cannot fathom how company’s such as Matterport, C3.ai and Robinhood can remotely justify the ridiculous amounts of SBC they have paid out. As an example, over just the last year, using Seeking Alpha’s data, Matterport’s shares outstanding have exploded from 196.5 million total shares in September 2021 to 286.5 million as of September 2022 or roughly 45% dilution for shareholders. To be clear, not all of this was SBC, however it certainly had an impact.
I will make no prediction as to the future of Matterport the company, however, they will need to absolutely set the world on fire with their products going forward to reward shareholders if that rate of dilution continues.
Some of the companies on the above list claim to be cash flow positive and present with growing cash balances, Snowflake is a good example of this. In the most recent quarter, Snowflake reported that, over the last 9 months, its cash balance has grown by over $90 million, however, the total shares outstanding have increased by 11.4 million in the same period and the company has a GAAP loss of over $589 million over the same period as a result.
Snowflake may indeed end up scaling and becoming a powerhouse GAAP profitable company, they certainly have a very interesting offering, but currently, all the talk of “profitability” is a myth.
The “Not As Bad” List
In contrast to the above list, I created a list of the companies below that appear to use a more conservative approach. In this list, I attempted to find comparable companies to the above list with a growth focus, yet under 20% SBC expense as a percentage of revenue. Again, as a reminder, this is not a screen of the market as a whole, simply of equities that I closely follow.
| Name | Total TTM SBC Cost | SBC As A Percentage Of TTM Revenue |
| Digital Turbine (APPS) | $21.7 Million | 2.8% |
| Paycom Software (PAYC) | $92 Million | 7.1% |
| PubMatic, Inc. (PUBM) | $18.8 Million | 7.3% |
| PTC Inc. (PTC) | $174.9 Million | 9% |
| Dynatrace, Inc. (DT) | $121.4 Million | 11.9% |
| nCino, Inc. (NCNO) | $46.4 Million | 12.4% |
| Autodesk, Inc. (ADSK) | $638 Million | 13% |
| Veeva Systems, Inc. (VEEV) | $318.1 Million | 15.3% |
| Elastic N.V. (ESTC) | $175.2 Million | 17.9% |
| Datadog, Inc. (DDOG) | $307 Million | 19.9% |
Source: Author created using Seeking Alpha data
A comparison that I would like to point out on this list is that of Datadog and Snowflake. Both of these companies have very similar growth profiles, Snowflake is expected to grow revenues at 68% in 2022 and Datadog near 61% during the same period, yet Datadog has less than half the SBC expense than Snowflake and is rapidly closing in on GAAP profitability while Snowflake remains quite a long way away from this measure.
Of course, Datadog and Snowflake are not directly comparable given the different sectors in which they operate, however I found this disparity interesting considering the hypergrowth and software orientated focus of both companies.
Bottom Line
It is important to note that simple stock-based compensation numbers in a vacuum do not tell the entire picture of a company, nor do they predict its future. Investors should never base an investment decision on a single metric. For example, I am still a holder of Palantir stock, which has been the poster boy of egregious SBC expenses for some time now and continue to hold a few names on the “worst offenders” list in high regard such as SentinelOne and The Trade Desk.
Personally, I am using this metric as yet another tool in my belt to screen perspective investments. What is clear, in my opinion, is that investors in software companies need to keep a very close eye on total share count dilution as non-GAAP gross margin figures that are extremely popular metrics appear to be quite misleading. You are betting your money that the company eventually reaches the scale to overcome this hidden cost.
If that scale never materializes, those growing cash balances and non-GAAP profits are but smoke and mirrors when your ownership percentage in the company is dropping by a greater amount each quarter than the cash balance is rising.
I look forward to your thoughts and comments below. Thank you for reading and good luck to all!
Be the first to comment