

Riekkinen/iStock via Getty Images
Investment Summary
After a heavy punishment across the bulk of FY22, STERIS plc (NYSE:STE) has caught a strong bid and broken out above the longer-term resistance level. Broad equities rallied at the back end of last year anyway, however, STE’s situation was more unique in that it faced heavy overhang from a string of lawsuits its competitor Sotera Health (SHC) is facing. As a reminder, the company faces lawsuits from >700 plaintiffs that allege emissions from its Willowbrook sterilization plant resulted in carcinogenic illness for residents in the area.
However, in November, a jury in Illinois found in favour of SHC in one particular case, acknowledging the company wasn’t liable for a woman’s breast cancer. The outcome saw STE rally off its 52-week lows, and it provides a more balanced picture to the expected outcomes of future litigations. Consequently, with the SHC overhang less visible, we re-rate STE as a buy and here I’ll run through some of the fundamental reasons why we believe the company has scope to reprice back towards its longer term support levels.
Before you read on, I encourage you to read our last 3 publications on STE, outlining its journey since FY20′:
- Steris: Deleveraging Key Undercurrent, Valuation A Concern
- Steris: Non-GAAP Valuations Supportive Of Substantial Upside
- Steris: Yet To Find Equilibrium After Market Punishment
Net-net, we revise STE to a buy.
Exhibit 1. STE rallying off 52-week lows, pushing back to 250DMA following SHC trial outcome in November
Data: Updata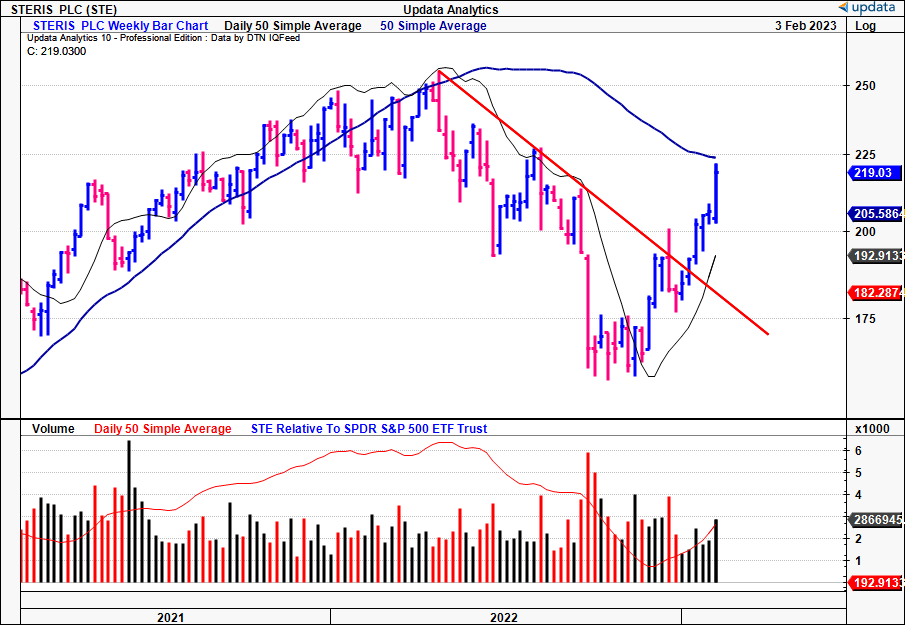
Fundamental outlook cleaner for STE without SHC overhang
Now with the SHC overhang less of a visible counterweight to its share price, we can delve into the company’s financials on a deeper level to extrapolate how it creates value for shareholders. We’ve covered this in great lengths in our last publications on STE, and here I’ll run through additional financial statement forensics to outline our revised buy case.
As a reminder, a firm generates value for its shareholders when its return on invested capital (“ROIC”) exceeds the cost of capital. This reflects an economic reality [economic profit, (“EP”)], and diverges from the accounting realities presenting in periodic earnings statements. Simply, our core investment tenets look for companies with a high EP spread, as this requires a small percentage of reinvestment from post-tax earnings, leaving the rest as distributable cash for equity holders. We also make adjustments for the size of post-tax earnings as well. Here we’ll use rolling TTM periods to demonstrate STE’s performance on this level.
For those observing exhibit 2, you’ll note STE generated a cumulative $8.2Bn of NOPAT in to the TTM in Q3 CY22′, and ~$4Bn in earnings over this time [note, this corresponds with the company’s Q2 FY23′. Thus, it will present its Q3 FY23′ earnings next. To avoid confusion, we’ll maintain consistency with US reporting periods in this report, hence, Q2 FY23′ = Q3 CY22′ = Q3 FY22′]. On this cumulative amount, it recognized an additional growth of $365mm in NOPAT and $99mm in earnings. To achieve this, it only had to invest an additional $3.3Bn in invested capital over the testing period.
As a result, the return on incremental invested capital (“ROIIC”) was 11% over this time, leading to a 4.5% and ~9.1% growth in NOPAT and earnings respectively. Consequently, it’s unsurprising to see the 10.5% in geometric growth for STE’s share price over this period-date, as the market values these metrics heavily.
As another footnote, we’ve decided to perform these calculations without penalizing the company for its goodwill tied to acquisitions. Moreover, ROIC can be calculated via an operating and financing approach, we’ve opted for the operating approach here to gauge the return STE generated on its cash earnings without the impacts of financial leverage.
Exhibit 2. STE periodic NOPAT, ROIC, rolling TTM Q1 FY20–Q3 FY22
Data: Author, using data from STE SEC Filings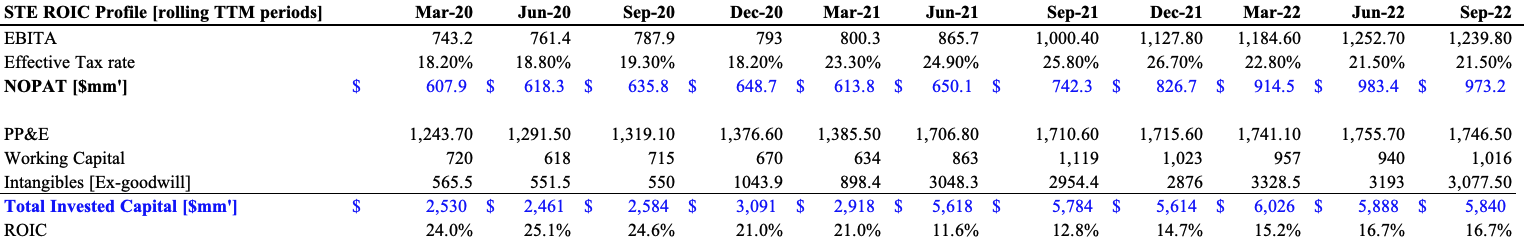
To achieve the growth rates stated above, it had to reinvest 40% of NOPAT, leaving ~60% as distributable cash to shareholders. Hence, investment of $3.3Bn to generated $8.2Bn in NOPAT, reinvesting 40% of NOPAT to generate an 11% return.
Exhibit 3. STE incremental ROIC with 40% of NOPAT reinvested for a growth rate of 4.5%
Data: Author, using data from STE SEC Filings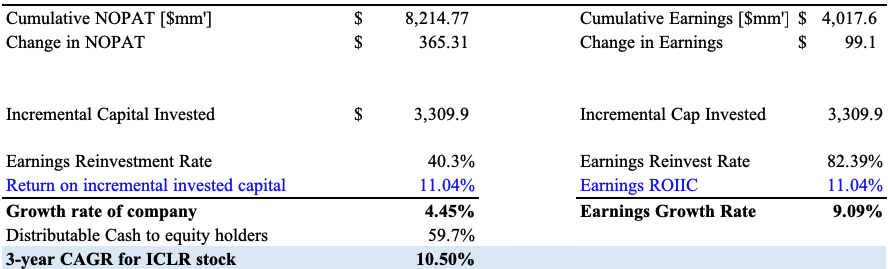
Moreover, because its ROIC has outpaced the hurdle rate on a consistent basis, even with the punishment from investors last year, all of this growth has been accretive to shareholder value.
Exhibit 4.
Data: Author, using data from STE SEC Filings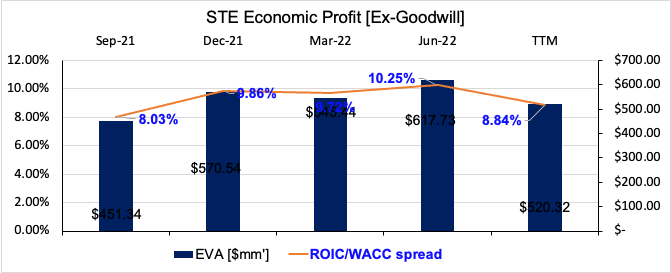
How this translated to value for STE looking ahead
Based on the above, we can extrapolate how this scenario creates value for STE equity holders looking ahead. The growth rates described above aren’t fantastic. However, not all growth is created equally. A large, mature company can grow at a slow rate and still distribute high amounts of cash to shareholders, depending on its incremental ROIC, EP, and required reinvestment rates to grow.
On that note, presuming STE holds its current levels of growth, and reinvestment of post-tax earnings to achieve this, we still see the stock trading fairly at ~27.9x forward P/E, prescribing a YoY growth 9% to the company’s FY22 adjusted earnings and including its forward dividend payout. This is above consensus P/E estimates. On a trailing basis, we see it fairly valued at 33x adjusted P/E.
Exhibit 5.
Data: Author’s Estimates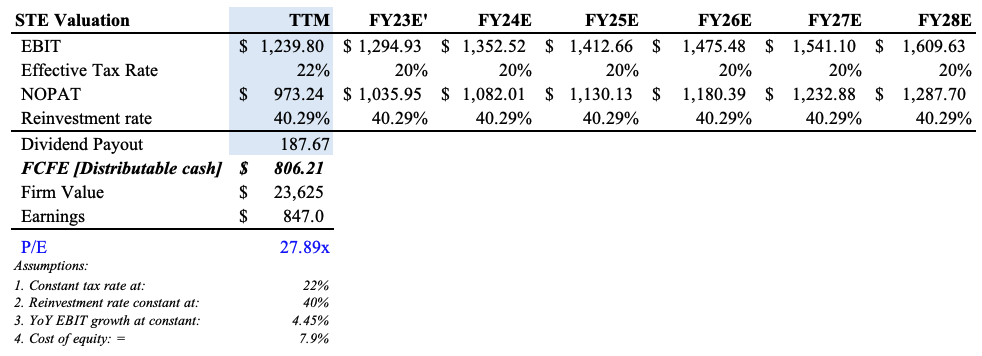
We also have upsides to $242, then $252 on our point and figure studies below.
Exhibit 6. Upside targets to $242, then $252
Data: Updata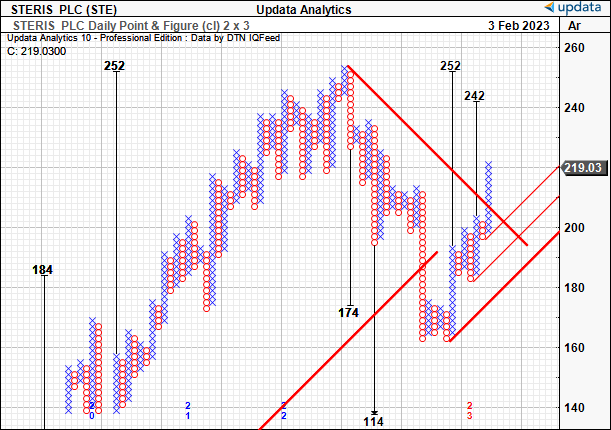
In short
Given the SHC overhang has begun to minimize and has been effectively priced in last year, plus the outcome of SHC’s latest trial, we believe there’s scope for STE to catch another bid and continue pricing higher. Shares have lifted off 52-week lows and ran up the page into the new year as a reflection of this. We believe it is fairly priced trading at 25x forward P/E and we’d see it fairly priced at ~28x P/E. There’s also upside targets on our radar to $242 and $252. Net-net, we revise STE to a buy.
Be the first to comment