

filmestria/iStock Editorial via Getty Images
Introduction
It may seem redundant and, perhaps, well-known, but the more I look at Stellantis (STLA) the more I turn bullish on the stock and keep on increasing my position. So far, I have shared my research in two articles that focused on two different aspects:
- Stellantis Is Swimming In Cash. In this article, I pointed out at Stellantis’ strong balance sheet that gives it a net cash position and makes the company stronger than all its peers. I also showed how new synergies will support the balance sheet without deteriorating its cash position, leaving the company with huge room to deploy its capital for investing activities and shareholder return.
- Stellantis: Its Undervaluation Is Harder And Harder To Justify. In this article, I went over my previous analysis updating it with the first half results the company published. The result was that Stellantis is executing much better than its peers and is silently becoming one of the EV leaders, while achieving best-in-class profitability.
Let’s recap some major numbers about the past earnings report for those who may have not followed my previous coverage.
Stellantis posted the following data:
- Net revenues: €88.0 billion, up 17% YoY
- Adjusted operating income of €12.4 billion, up 44% YoY
- Operating margin 14.1% with all five regions with double-digit margins
- Net profit of €8.0 billion, up 34% YoY
- Industrial free cash flows of €5.3 billion, up €6.5 billion YoY (6% of revenue)
- Industrial available liquidity at almost €60 billion
- Stellantis ranked second in BEV sales and LEV sales in Europe and ranked third in the U.S. market for LEV sales.
- Global BEV sales up nearly 50% YoY to 136k units
Now, in a few words, I keep on saying over and over that at today’s valuation, Stellantis is trading “for free”. This means that as the share price is $13.61, the cash per share available is currently around $15, which is really a situation that doesn’t occur that often. If we put this number into a larger context, where synergies are leading to at least $5 billion in savings and cars keep on beings sold with high prices, we are before a company that is fundamentally cheap while holding true value within itself.
To this we have to add that Stellantis’ fwd PE is just a 2.4 which means that investors are not willing to pay more than 2 and half years of current earnings for the stock. It is as if Stellantis were to die in three years, but the fundamentals don’t hint at all towards this outcome.
Behind the curtains of Stellantis’ cash fortress, I felt I wanted to dig more in depth about Stellantis’ execution and this is why I decided to write an article focused on the company’s profitability metrics. In fact, profitability is the real engine that keeps a company moving.
Let’s recall that Stellantis is not only experiencing the benefit of tight market conditions where demand is greater than supply. It is really doing something more than its peers. In fact, while Stellantis was able to push its operating margin up above 14%, other competitors like Volkswagen and Ford are still struggling to reach the low double digits. This means that, even in case of a recession, Stellantis will start from a higher point compared to its competitors, thus having more room to absorb any major hit. This is combined with a very low breakeven point at 40% of production capacity.
Let’s take a look at Stellantis compared to some of its main peers in terms of top and bottom line profitability.
Seeking Alpha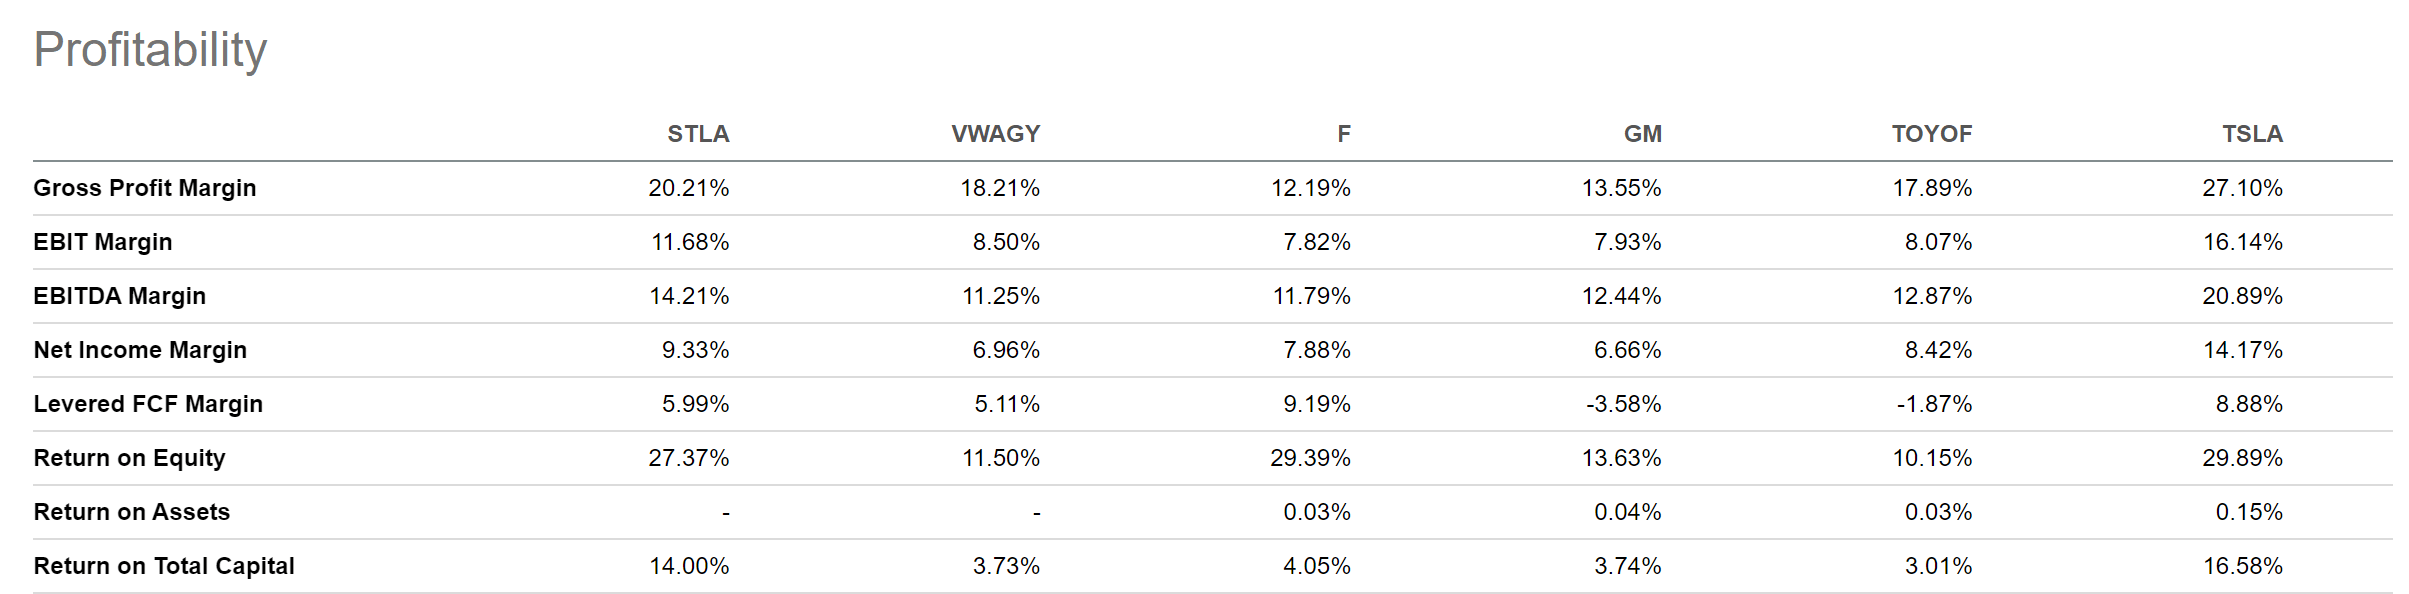
Gross Profit Margin
First of all, let’s start with gross profit margin, that is the amount of cash the company retains after incurring the direct costs to produce the goods sold.
Stellantis here is the only one alongside Tesla (TSLA) to be above 20%. Among legacy automakers, it is well ahead of its peers, as Volkswagen (OTCPK:VWAGY) reaches an 18% margin, Toyota (OTCPK:TOYOF) a 17% while Ford (F) and General Motors (GM) are the two laggards with 12% and 13% gross profit margins respectively.
Already from the start, Stellantis has an advantage over its traditional competitors, being the one that is closest to Tesla and its new automotive business, which, being focused only on BEV, is enjoying higher margins.
Why is gross profit margin so important? Because it is the income a company has left, after paying all direct expenses related to the manufacturing of a product. In other words, it is a way to understand how much production costs weigh on total revenues. This is why who leads on gross profit margins shows both the necessary pricing power to offset production costs in a profitable way and the ability to manage production costs. Regarding production management, it is no mystery that Stellantis is putting into play important synergies that have been unlocked thanks to the merger between former PSA and FCA. So far, important industrial synergies have led to $3.1 billion in savings and at least other $2 billion will be seen in the future. Given the fact that Stellantis has a TTM gross profit of $34 billion, the synergies already account for almost 10% of this result. The synergies savings are also equal to 2% of total revenues, which is exactly the difference that separates Stellantis’ gross profit from Volkswagen’s.
EBIT And Net Income Margins
If we move towards the bottom line, we see that only Ford is able to beat Stellantis’ execution and actually closes a bit the gap with Stellantis, though still lagging behind. GM is slightly ahead of Stellantis, too, but the gap is very close. In fact, while Stellantis has a larger EBIT margin than all its other peers, the EBIT as a percentage of gross margin is a little bit less compared to the one of the two American legacy automakers. As we can see below, Stellantis’ EBIT margin is 11.68%, which is equal to 57.79% of the gross profit margin. Ford reaches a 64.15% while GM a 58.52%. Let’s keep in mind that, in any case, Stellantis’ EBIT is higher than all its peers except for Tesla, being the only one that reaches the low double-digits. This result is also very close to Tesla’s, whose gross profit margin is at 27%. This means that on the way from revenue to net income, Stellantis reduces its gap with the BEV market leader.
| STLA | VWAGY | F | GM | TOYOF | TSLA | |
| EBIT as % of gross margin | 57.79% | 46.67% | 64.15% | 58.52% | 45.1% | 59.56% |
| Net income as % of gross margin | 46.16% | 38.22% | 64.64% | 44.72% | 35.68% | 52.29% |
| Net income as % of EBIT | 79.88% | 81.88% | 100.77% | 83.98% | 104.33% | 87.79% |
However, though these comparisons help us get a grasp of where the pipeline that turns revenue into net profits works best for each company, it is hard to compare them because they are affected by different tax and interest rates that depend on circumstances that are not always directly related to how well the business is run.
EBITDA Margin
A quick mention on EBITDA margin. Not all automakers report it because it is not as meaningful as in other industries. The reason is quite simple. The automotive industry is capital intensive and depreciation and amortization are high. Thus, EBITDA wouldn’t give the best view on the results, while using EBIT gives us a better understanding of what is being earned by the company. This is why I don’t really look at EBITDA margin in this article as I would if we were talking about another industry.
Efficiency And ROTC
What we have seen above is that Stellantis has indeed an advantage over its legacy competitors and is the one that gets closest to Tesla. Let’s keep in mind that in Europe Stellantis is already ahead of Tesla in terms of vehicles sold and is just a few thousand vehicles behind Volkswagen.
In the last earnings call, Carlos Tavares, the Portuguese CEO of Stellantis, was asked about the company’s efficiency and this is what he replied:
We believe we have a 30% efficiency and effectiveness edge against our peers in the way we spend our money. This is something that we check once we have all the results, and every time again, we consider and we conclude that we have a 30% efficiency edge, effectiveness edge against our competitors. So it’s normal that on a recurring basis, you see CapEx numbers, which may be much lower than some of our competitors. And as you know, it is not in our skills to show CapEx headline numbers to the media. We prefer to use our money in a wise and very demanding and frugal way so that your money is being taken care of in the most efficient and effective way. So we confirm that we have a 30% hedge, positive hedge against our competitors.
Even though the company doesn’t show the breakdown of its capex, investors can have a fundamental metric to understand how the company uses its capital structure of debt and equity: the return on total capital (ROTC). Unlike ROCE, ROTC takes into account the company’s use of debt, which for industrial companies is very important. ROTC is thus a better metric to assess overall profitability and it makes us understand how a company’s management uses the company’s capital structure to generate value. It is the metric I use to understand how good of a management team a company has.
Now, Stellantis, as we have seen above, beat by a large extent all the legacy automakers, reaching a ROTC of 14%, compared to the 3%-4% range its peers have. Only Tesla is slightly ahead with 16.58%. Again, I don’t think investors are still aware of how much Stellantis is generating value at a stronger ratio compared to peers like Ford, General Motors, Toyota and Volkswagen.
Cash Position And Free Cash Flow
Let me remind everybody that currently Stellantis is not a leveraged company as it has a net cash position of $20 billion. Having around $50 billion of available of cash on hand would give the possibility to the company to a complete buyback that would lead to a delisting, as the company currently has a $43 billion market cap. Even if this were to take place, the company would still have several billions on hand.
But the most interesting part is that Stellantis is proving itself able to generate free cash flow to a very large extent. Stellantis trades, in fact, at a staggering 21.53% fwd free cash flow yield, which is almost 4 times larger than Ford’s 5.7%. This shows how mispriced Stellantis is.
Not by chance, Stellantis rewarded its shareholders with an annual dividend with an 8% yield. The payout ratio is around 22% and this proves once again that the dividend is sustainable even in case of headwinds.
I expect Stellantis to keep its dividend and raise it at a faster pace compared to inflation. I actually think that, in order to make the stock more interesting for income investors, the company may consider in the future to split its annual dividend at least into two semi-annual payments.
Conclusion
Stellantis trades at a fwd PE of 2.44 which I really think is absurd because it is as if investors are expecting the company to be wiped out in 2 and half years. I actually believe that in this time frame, the company will benefit from its efficiency and will create a gap with its peers. This is why I think Stellantis is set for at least a 2x for its stock price. In the meantime, holding it for the long-term, I will enjoy its dividend and will keep on monitoring how its management keeps on making it a better and better company.
Be the first to comment