NicoElNino
By John Welling
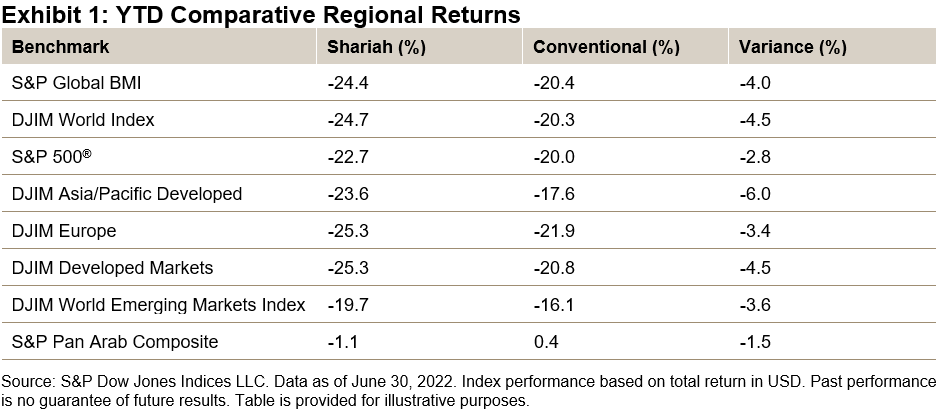
Global equities fell 15.7% during Q2, as measured by the S&P Global BMI, accumulating losses of 20.4% YTD. Shariah-compliant benchmarks, including the S&P Global BMI Shariah and Dow Jones Islamic Market (DJIM) World Index, continued to underperform their conventional counterparts YTD in part due to continued weakness in the Information Technology sector, which fell 30.1% during the period.
Major regional broad-based Shariah and conventional benchmarks likewise concluded with steep negative performance YTD, as central bank actions to contain runaway inflation weighed on markets. The Pan Arab region, meanwhile, vastly outperformed, as the Shariah benchmark finished with only marginal losses.

Drivers of YTD Shariah Index Performance
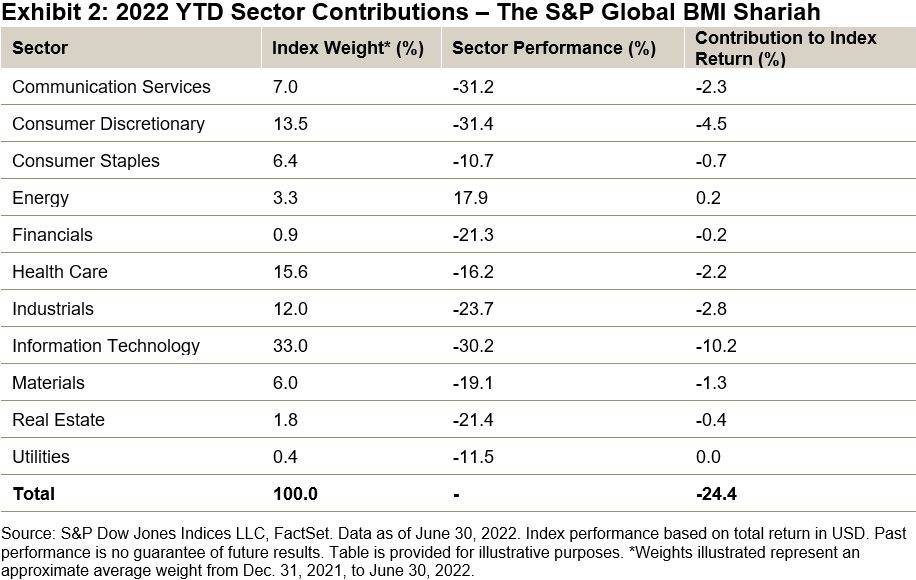
While global equities declined broadly over the first half of 2022, sector performance played a part in the relative underperformance of Shariah-compliant equity benchmarks. Information Technology, which is heavily represented in Islamic indices, fell 30.2%, contributing most heavily to the broad underperformance over the period, as growth-oriented tech shares have suffered during the recent downturn. Consumer Discretionary likewise fell 31.4%, representing the next greatest negative contribution to returns, as inflation and economic concerns worried consumers.
Despite a June pullback, Energy remained the sole positive sector YTD, outpacing the broader market by strides, as supply constraints bolstered shares (see Exhibit 2). Due to its low weight in Islamic indices, however, the performance impact remained relatively muted.

MENA Equities Lose Ground
MENA regional equities reversed in Q2, following several quarters of positive performance. The regional S&P Pan Arab Composite sank 12.7% in Q2, leading to a minor gain of 0.4% YTD. All GCC country indices besides Oman suffered losses during the recent quarter, led by the S&P United Arab Emirates BMI (down 17.1%) and the S&P Saudi Arabia BMI (down 13.0%). Meanwhile, the S&P Oman BMI eked out a 0.2% gain during the quarter. Year-to-date, there was high dispersion of returns across countries, as Oman gained 10.4% and Egypt lost 34.3% in U.S. dollar terms.
For more information on how Shariah-compliant benchmarks performed in Q2 2022, read our latest Shariah Scorecard.
This article was first published in IFN Volume 19 Issue 28 dated July 13, 2022.
Disclosure: Copyright © 2022 S&P Dow Jones Indices LLC, a division of S&P Global. All rights reserved. This material is reproduced with the prior written consent of S&P DJI. For more information on S&P DJI please visit www.spdji.com. For full terms of use and disclosures please visit Terms of Use.
Editor’s Note: The summary bullets for this article were chosen by Seeking Alpha editors.


Be the first to comment