

Torsten Asmus/iStock via Getty Images
By Robert Hum, CAIA, U.S. Head of Factor ETFs; Ken Baba, CFA, Factor Strategist; Jim Fuson, CFA, Factor Strategist
Key Takeaways
- Minimum volatility ETFs can help investors during periods of heightened volatility and geopolitical uncertainty.
- Negative returns can have dramatic effects on portfolio performance. Attempting to reduce downside risk can result in more favorable returns over the long term.
- Minimum Volatility has not only had strong relative performance YTD, but it has also reduced portfolio volatility over the long run.
Paul “Bear” Bryant, the legendary football coach of the Alabama Crimson Tide, once said, “offense wins games…defense wins championships.” That sentiment can be also applied to investing, where limiting downside risk of a portfolio can be just as important, if not more so, than maximizing upside potential. Given the current backdrop of heightened volatility and geopolitical uncertainty, it is critical that investors appropriately consider how to manage investment risk and properly diversify their portfolios. The iShares minimum volatility suite represents a set of tools that investors can use to help reduce volatility and mitigate downside capture with the goal of staying invested in equity markets when markets get bumpy.
Time In The Market, Not Timing The Market
An important factor when determining whether an investor achieves their desired outcomes is their ability to stay invested over the long term. This can be challenging, as investors are often tempted into buying equities in periods of strong performance, only to sell those same securities when performance becomes challenged. The benefit of staying invested through turbulent market cycles is illustrated in the graph below, which shows that missing out on the market’s top returning days can have a dramatic impact on a portfolio’s ending value.
Exhibit 1: Missing top-performing days can hurt your return
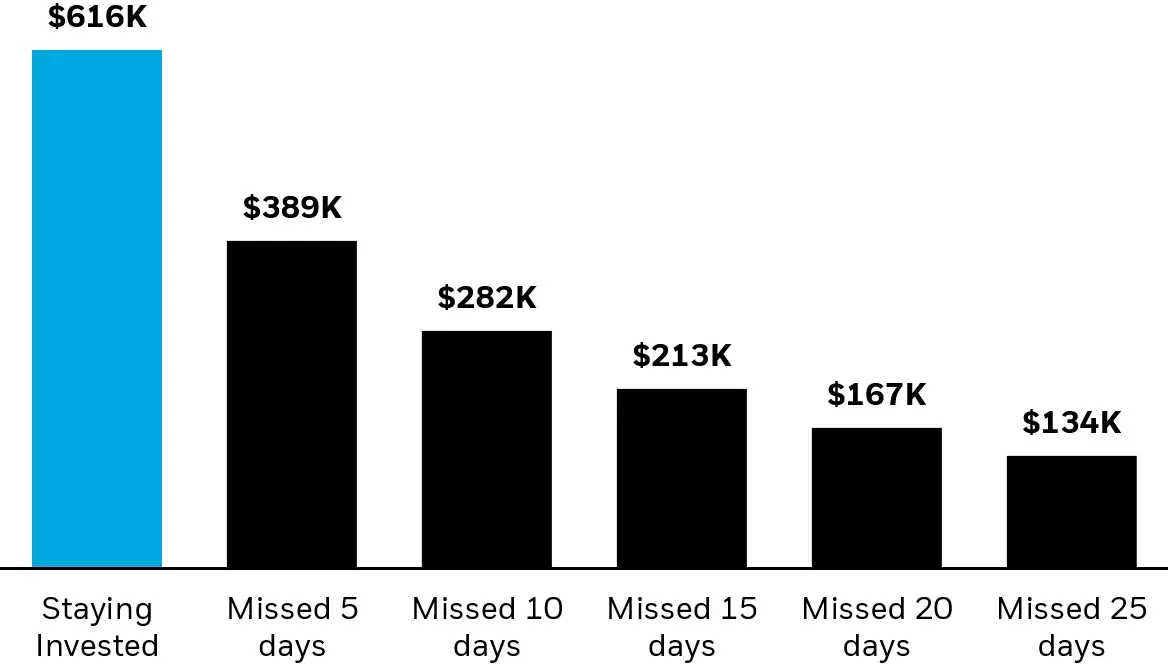
Source: BlackRock, Bloomberg as of 12/31/21. Stocks are represented by the S&P 500 Index, an unmanaged index that is generally considered representative of the US stock market. Index performance is for illustrative purposes only. Index performance does not reflect any management fees, transaction costs or expenses. Indexes are unmanaged and one cannot invest directly in an index. Past performance does not guarantee future results.
Chart description: Bar chart that shows the hypothetical growth of a $100k investment in the S&P 500 Index (over the last 20 years) and the long term effect of missing out on some of the market’s best days due to investors hypothetically selling equities when markets are volatile.
In short, since trying to time the market is extremely difficult staying the course and remaining invested may be prudent. Having said that, many investors would most likely prefer to lessen the pain of a market crash. One potential solution for investors is to focus on the stocks that tend to not climb as high or fall as low as other stocks, known as minimum volatility investing. These strategies can help mitigate the inherent behavioral bias of trying to time the market by pursuing consistent returns during both up markets and down markets – giving investors more confidence in maintaining their equity positions during market uncertainty.
Managing Downside Risk
Investors who can tolerate market swings can benefit from managing a portfolio’s downside risk, as negative returns can have an outsized impact on performance. For example, suppose that the market falls by 50% and then rebounds, rising by 50%. In this scenario, an investor may intuitively think that they’ve broken even, while their portfolio is actually down -25%. In reality, the investor would need a 100% return to break even from a 50% drop.
Exhibit 2: The Arithmetic of Losses
| Investment loss | Return needed to break even |
|---|---|
| 10% | 11% |
| 20% | 25% |
| 30% | 43% |
| 40% | 67% |
| 50% | 100% |
For illustrative purposes only.
In other words, reducing the amount you could lose in a selloff can lead to more favorable returns over time, helping investors to grow their wealth over the long run.
Minimum Volatility Performance
The return of volatility, and subsequent market selloff this year, serves to illustrate the potential benefit of a minimum volatility approach. When looking at year-to-date performance of domestic, international developed, and emerging markets, performance has been challenging thus far in 2022. Minimum volatility strategies in each region outperformed their broad market counterparts, as evidenced by the below MSCI minimum volatility indexes:
Exhibit 3: Returns of various minimum volatility indexes
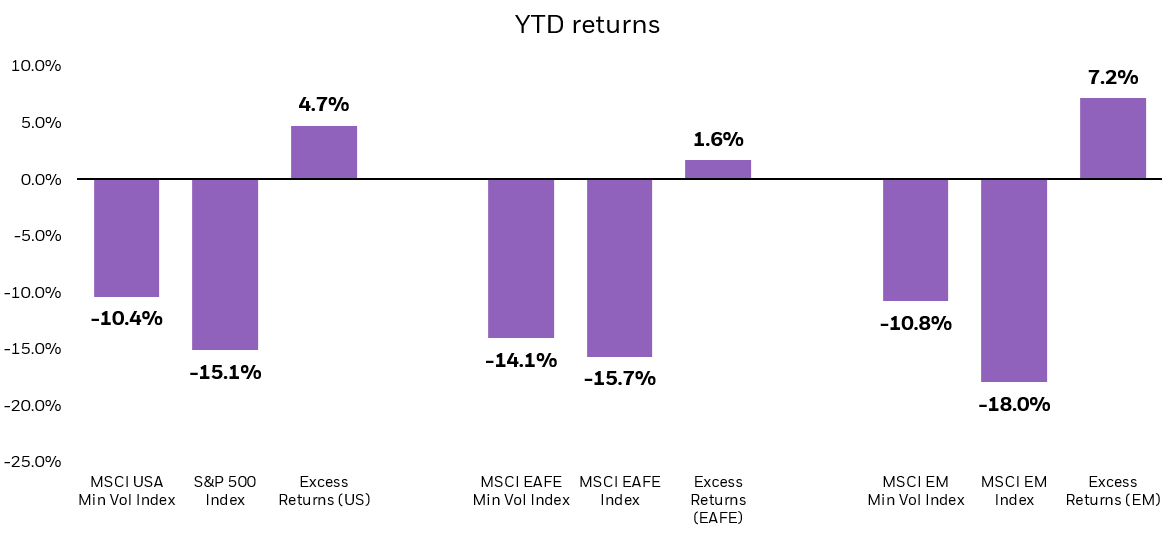
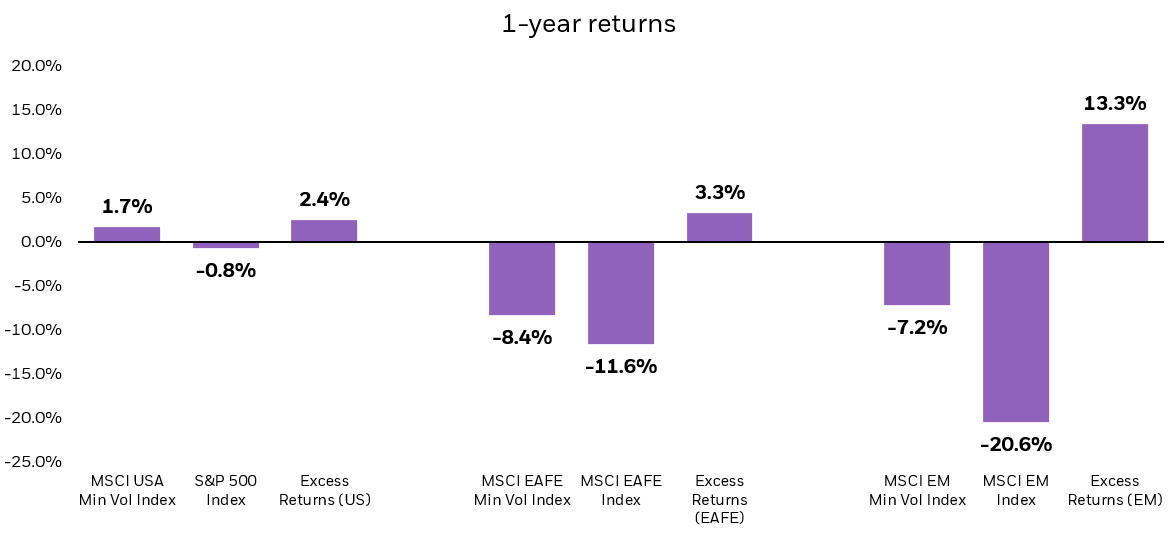
Source: Morningstar Direct as of 5/13/22. Relative performance calculations may differ slightly due to rounding. Index performance is for illustrative purposes only. Index performance does not reflect any management fees, transaction costs or expenses. Indexes are unmanaged and one cannot invest directly in an index. Past performance does not guarantee future results.
Chart description: Bar charts that show the YTD and trailing 1-year returns (through 5/13/22) of min vol indexes in the US, International Developed Markets, and Emerging Markets. During the time period measured, the above highlighted min vol indexes outperformed their broad market counterparts.
The iShares MSCI USA Min Vol Factor ETF (USMV), iShares MSCI EAFE Min Vol Factor ETF (EFAV), and iShares MSCI Emerging Markets Min Vol Factor ETF (EEMV) seek to track the minimum volatility indexes listed above. YTD, and over the trailing 1-year period, each benchmark min vol index has outperformed their respective broad market benchmarks with meaningfully lower risk1. Since inception, each index has also been successful at mitigating downside risk with downside capture ratios of less than 70%2.
The iShares minimum volatility suite can be a valuable set of tools for investors who are looking to maintain their equity exposure in a volatile market environment.
Summary
While reducing overall portfolio risk may not be as exciting as generating market beating returns, Paul “Bear” Bryant reminds us of the importance of defense. Using minimum volatility strategies can help ensure investors stay invested through turbulent markets, so they are able to “be there” to capture underlying market returns.
© 2022 BlackRock, Inc. All rights reserved.
1 Using performance data (from 11/1/2011 through 5/13/22), the MSCI USA Minimum Volatility Index has had ~16% less risk than the S&P 500 Index. The MSCI EAFE Minimum Volatility Index has had ~25% less risk than the MSCI EAFE Index. The MSCI EM Minimum Volatility Index has had ~24% less risk than the MSCI EM Index.
2 Since Nov 2011, the MSCI USA Min Vol Index, MSCI EAFE Min Vol Index, and MSCI EM Min Vol Index have had downside capture ratios of 68%, 61%, and 67% respectively.
Carefully consider the Funds’ investment objectives, risk factors, and charges and expenses before investing. This and other information can be found in the Funds’ prospectuses or, if available, the summary prospectuses, which may be obtained by visiting the iShares Fund and BlackRock Fund prospectus pages. Read the prospectus carefully before investing.
Investing involves risk, including possible loss of principal.
The Funds are distributed by BlackRock Investments, LLC (together with its affiliates, “BlackRock”).
International investing involves risks, including risks related to foreign currency, limited liquidity, less government regulation and the possibility of substantial volatility due to adverse political, economic or other developments. These risks often are heightened for investments in emerging/ developing markets or in concentrations of single countries.
Fixed income risks include interest-rate and credit risk. Typically, when interest rates rise, there is a corresponding decline in bond values. Credit risk refers to the possibility that the bond issuer will not be able to make principal and interest payments.
This material represents an assessment of the market environment as of the date indicated; is subject to change; and is not intended to be a forecast of future events or a guarantee of future results. This information should not be relied upon by the reader as research or investment advice regarding the funds or any issuer or security in particular.
The strategies discussed are strictly for illustrative and educational purposes and are not a recommendation, offer or solicitation to buy or sell any securities or to adopt any investment strategy. There is no guarantee that any strategies discussed will be effective.
The information presented does not take into consideration commissions, tax implications, or other transactions costs, which may significantly affect the economic consequences of a given strategy or investment decision.
Diversification and asset allocation may not protect against market risk or loss of principal.
There can be no assurance that performance will be enhanced or risk will be reduced for funds that seek to provide exposure to certain quantitative investment characteristics (“factors”). Exposure to such investment factors may detract from performance in some market environments, perhaps for extended periods. In such circumstances, a fund may seek to maintain exposure to the targeted investment factors and not adjust to target different factors, which could result in losses.
The iShares Minimum Volatility Funds may experience more than minimum volatility as there is no guarantee that the underlying index’s strategy of seeking to lower volatility will be successful.
Commodities’ prices may be highly volatile. Prices may be affected by various economic, financial, social and political factors, which may be unpredictable and may have a significant impact on the prices of commodities.
TIPS can provide investors a hedge against inflation, as the inflation adjustment feature helps preserve the purchasing power of the investment. Because of this inflation adjustment feature, inflation protected bonds typically have lower yields than conventional fixed rate bonds and will likely decline in price during periods of deflation, which could result in losses. Government backing applies only to government issued securities, and does not apply to the funds.
This material contains general information only and does not take into account an individual’s financial circumstances. This information should not be relied upon as a primary basis for an investment decision. Rather, an assessment should be made as to whether the information is appropriate in individual circumstances and consideration should be given to talking to a financial professional before making an investment decision.
The information provided is not intended to be tax advice. Investors should be urged to consult their tax professionals or financial professionals for more information regarding their specific tax situations.
The Funds are distributed by BlackRock Investments, LLC (together with its affiliates, “BlackRock”).
The iShares Funds are not sponsored, endorsed, issued, sold or promoted by Bloomberg, BlackRock Index Services, LLC, Cohen & Steers, European Public Real Estate Association (“EPRA®”), FTSE International Limited (“FTSE”), ICE Data Indices, LLC, NSE Indices Ltd, JPMorgan, JPX Group, London Stock Exchange Group (“LSEG”), MSCI Inc., Markit Indices Limited, Morningstar, Inc., Nasdaq, Inc., National Association of Real Estate Investment Trusts (“NAREIT”), Nikkei, Inc., Russell or S&P Dow Jones Indices LLC or STOXX Ltd. None of these companies make any representation regarding the advisability of investing in the Funds. With the exception of BlackRock Index Services, LLC, which is an affiliate, BlackRock Investments, LLC is not affiliated with the companies listed above.
Neither FTSE, LSEG, nor NAREIT makes any warranty regarding the FTSE Nareit Equity REITS Index, FTSE Nareit All Residential Capped Index or FTSE Nareit All Mortgage Capped Index. Neither FTSE, EPRA, LSEG, nor NAREIT makes any warranty regarding the FTSE EPRA Nareit Developed ex-U.S. Index or FTSE EPRA Nareit Global REITs Index. “FTSE®” is a trademark of London Stock Exchange Group companies and is used by FTSE under license.
© 2022 BlackRock, Inc. All rights reserved. BLACKROCK, BLACKROCK SOLUTIONS, BUILD ON BLACKROCK, ALADDIN, iSHARES, iBONDS, FACTORSELECT, iTHINKING, iSHARES CONNECT, FUND FRENZY, LIFEPATH, SO WHAT DO I DO WITH MY MONEY, INVESTING FOR A NEW WORLD, BUILT FOR THESE TIMES, the iShares Core Graphic, CoRI and the CoRI logo are trademarks of BlackRock, Inc., or its subsidiaries in the United States and elsewhere. All other marks are the property of their respective owners.
iCRMH0622U/S-2224004
This post originally appeared on the iShares Market Insights.
Editor’s Note: The summary bullets for this article were chosen by Seeking Alpha editors.
Be the first to comment