

Viktor_Gladkov/iStock via Getty Images
It’s been a wild year so far in 2022, with some truly mind-bending volatility.
- According to Bloomberg the worst January in US history
- a 21% bear market in the Nasdaq by Feb 24th
- an 11% 11-day rally that ended just recently (14th best 11-day gain in US history)
Well, guess what my friends? 2022’s wild ride is likely just getting started.
And this creates the opportunity for smart long-term income investors to lock in not just good bargains, but Buffett-style “fat pitch” bargains that rich retirement dreams are made of.
Let me share with you why I just added to my position in Stanley Black & Decker (NYSE:SWK). This isn’t just one of my top conviction recs, it’s also a top-five recommendation from my fellow Dividend Kings Justin Law and Nicholas Ward, in our Top Buy List.
What does it mean when three of America’s leading blue-chip analysts all agree that one of the world’s best companies is crazy, stupid, cheap?
SWK 2027 Consensus Return Potential
FAST Graphs, FactSet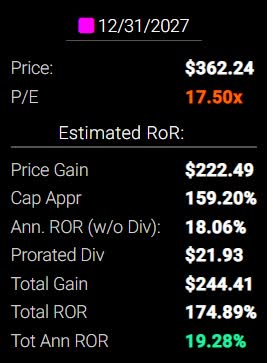
It means you could potentially earn 19% annual returns over the next five years, 5X better than the S&P 500 consensus.
But wait it gets better.
SWK 2024 Consensus Return Potential
FAST Graphs, FactSet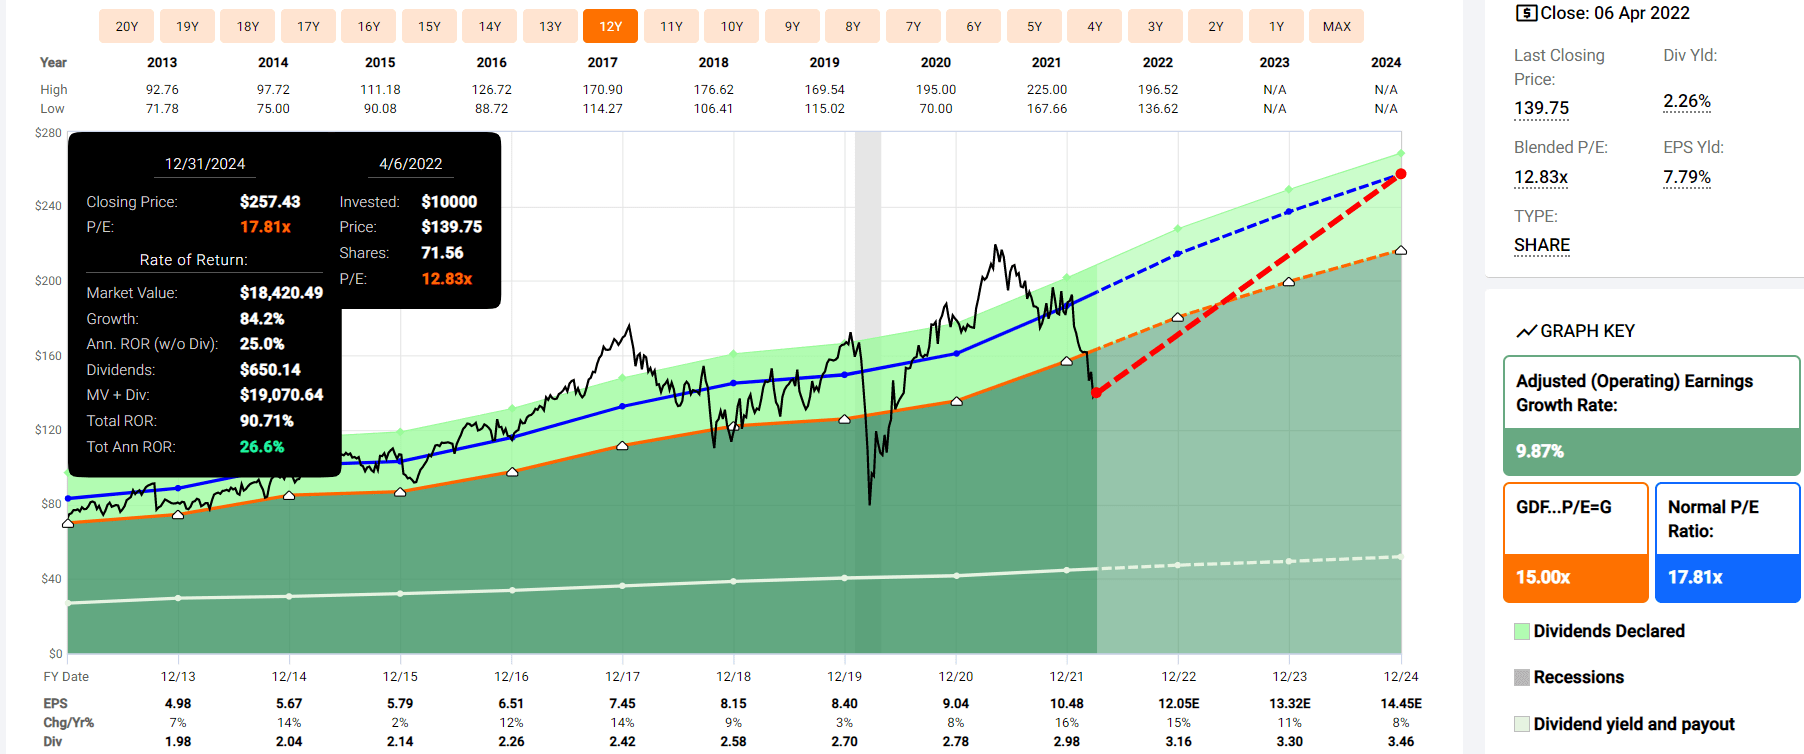
SWK offers the potential for 27% annual returns over the next three years, the potential to nearly double your money.
But wait it gets better!
|
Analyst Median 12-Month Price Target |
Morningstar Fair Value Estimate |
| $198.38 (14.4 PE) | $180.65 (14.5 PE) – quant model |
|
Discount To Price Target (Not A Fair Value Estimate) |
Discount To Fair Value |
| 30.38% | 23.54% |
|
Upside To Price Target (Not Including Dividend) |
Upside To Fair Value (Not Including Dividend) |
| 43.63% | 30.79% |
|
12-Month Median Total Return Price (Including Dividend) |
Fair Value + 12-Month Dividend |
| $201.54 | $183.81 |
|
Discount To Total Price Target (Not A Fair Value Estimate) |
Discount To Fair Value + 12-Month Dividend |
| 31.47% | 24.86% |
|
Upside To Price Target ( Including Dividend) |
Upside To Fair Value + Dividend |
| 45.92% | 33.08% |
(Source: DK Research Terminal, FactSet, Morningstar)
Analysts expect SWK to deliver 46% total returns in the next year alone!
Why do I care about such an optimistic forecast?
SWK Valuation Model
| Metric | Historical Fair Value Multiples (12-Years) | 2021 | 2022 | 2023 | 2024 | 2025 |
12-Month Forward Fair Value |
| 5-Year Average Yield | 1.75% | $170.29 | $180.57 | $180.57 | $201.71 | NA | |
| Earnings | 17.81 | $199.47 | $214.97 | $239.90 | $257.71 | $299.21 | |
| Average | $183.73 | $196.27 | $206.05 | $226.30 | $299.21 | $198.91 | |
| Current Price | $138.12 | ||||||
|
Discount To Fair Value |
24.82% | 29.63% | 32.97% | 38.97% | 53.84% | 30.56% | |
|
Upside To Fair Value (NOT Including Dividends) |
33.02% | 42.10% | 49.18% | 63.84% | 116.63% | 44.01% (46.2% with dividend) | |
| 2022 EPS | 2023 EPS | 2021 Weighted EPS | 2022 Weighted EPS | 12-Month Forward EPS | 12-Month Average Fair Value Forward PE |
Current Forward PE |
|
| $12.07 | $13.47 | $8.82 | $3.63 | $12.45 | 16.0 | 11.1 |
Because SWK’s discount to fair value is so great, a return to fair value in the next year justifies a 46% total return.
- so analyst forecasts for 100% justified by fundamentals
But wait it gets better!
SWK Rolling Returns Since 1986
Portfolio Visualizer Premium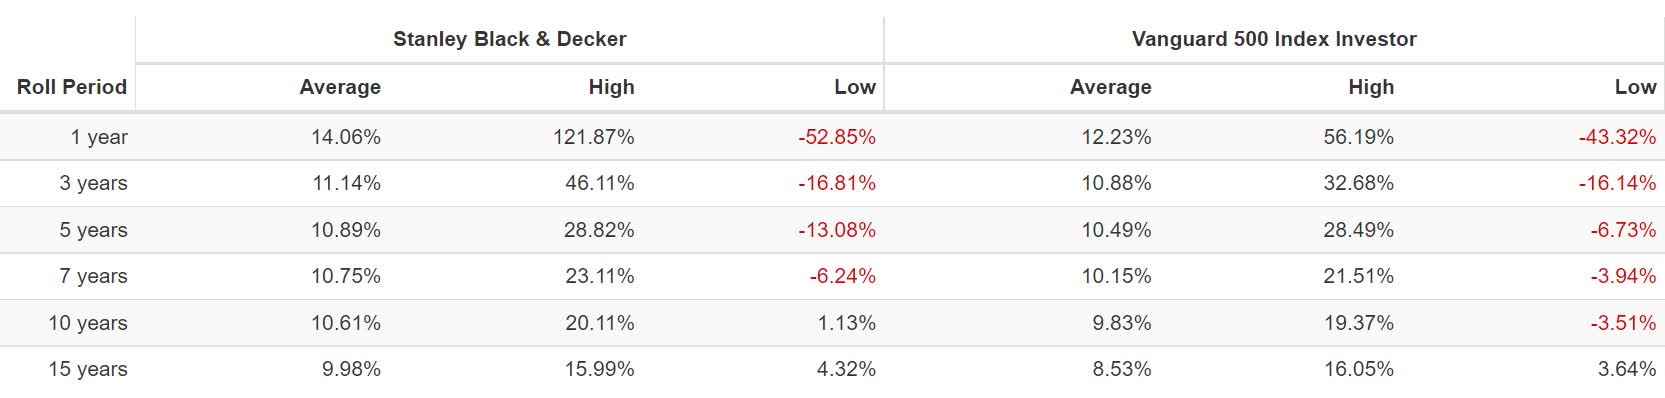
Buying the world’s best cyclical companies during bear markets is a great way to enjoy outsized returns.
- as much as 16% CAGR for 15 years with SWK
- 9.3X returns in 15 years
But wait it gets even better.
| Investment Strategy | Yield | LT Consensus Growth | LT Consensus Total Return Potential | Long-Term Risk-Adjusted Expected Return | Long-Term Inflation And Risk-Adjusted Expected Returns | Years To Double Your Inflation & Risk-Adjusted Wealth |
10 Year Inflation And Risk-Adjusted Return |
| Stanley Black & Decker | 2.2% | 11% | 13.2% | 9.2% | 6.8% | 10.7 | 1.92 |
| Dividend Growth | 1.6% | 11.2% | 12.8% | 9.0% | 6.5% | 11.1 | 1.88 |
| Top 50 Megacaps | 1.0% | 12.1% | 13.1% | 9.2% | 6.7% | 10.8 | 1.91 |
| Dividend Aristocrats | 2.2% | 8.9% | 11.1% | 7.8% | 5.3% | 13.6 | 1.67 |
| S&P 500 | 1.4% | 8.5% | 9.9% | 7.0% | 4.5% | 16.1 | 1.55 |
| REITs | 2.9% | 6.5% | 9.4% | 6.6% | 4.1% | 17.6 | 1.49 |
(Sources: Morningstar, FactSet, Ycharts)
According to management guidance, SWK could deliver 13.2% long-term returns in the future, which is better than many of the most popular investment strategies, including the aristocrats and S&P 500.
What do 13.2% long-term returns potentially mean for you?
SWK Inflation-Adjusted Consensus Forecast: $1,000 Initial Investment
| Time Frame (Years) | 7.4% CAGR Inflation-Adjusted S&P Consensus | 8.6% Inflation-Adjusted Aristocrat Consensus | 10.7% CAGR Inflation-Adjusted SWK Guidance | Difference Between Inflation Adjusted SWK Guidance And S&P Consensus |
| 5 | $1,429.63 | $1,511.29 | $1,663.16 | $151.87 |
| 10 | $2,043.84 | $2,284.01 | $2,766.10 | $482.09 |
| 15 | $2,921.94 | $3,451.81 | $4,600.48 | $1,148.66 |
| 20 | $4,177.29 | $5,216.70 | $7,651.33 | $2,434.63 |
| 25 | $5,971.97 | $7,883.98 | $12,725.39 | $4,841.42 |
| 30 | $8,537.71 | $11,915.01 | $21,164.38 | $9,249.37 |
(Source: DK Research Terminal, FactSet)
Over the long-term 10.7% inflation-adjusted returns mean a potential 21X return over 30 years.
| Time Frame (Years) | Ratio Aristocrats/S&P | Ratio SWK Guidance Vs S&P Consensus |
| 5 | 1.06 | 1.16 |
| 10 | 1.12 | 1.35 |
| 15 | 1.18 | 1.57 |
| 20 | 1.25 | 1.83 |
| 25 | 1.32 | 2.13 |
| 30 | 1.40 | 2.48 |
(Source: DK Research Terminal, FactSet)
It means potentially 2.5X better inflation-adjusted returns than the S&P 500, which is almost certainly not capable of 19% annual returns over the next five years.
I know what you’re thinking. “Aren’t you the guy warning people about a potential recession in 2023?! How can you be recommending an industrial company before a recession?!”
So let me tell you the method to my apparent madness;)
Why Stanley Black & Decker Is A Great Way To Profit If There Is No 2023 Recession
How much should we be worried about a recession in 2023?
Dividend Kings’ Preparing For Recession Video Series
- Part 1: The Nature Of Corrections And Bear Markets
- Part 2: History’s Lessons For The Next Downturn
- Part 3: The Role Of Bonds In A Diversified Recession-Resistant Portfolio
- Part 4: How The Fed Plans To Beat Inflation While Avoiding Recession
- Part 5: How Recessions Affect Corporate Fundamentals And Dividends
- Part 6: How We Forecast And Track Recessions
- Part 7: How To Build A Bunker Sleep Well At Night Recession-Resistant Retirement Portfolio
- Part 8: How To Manage A Bunker Sleep Well At Night Recession-Resistant Retirement Portfolio Over Time
- Part 9: Why Smart Investors Should Look Forward To Bear Markets
We’re preparing our members through a nine-part series because at some point a recession and bear market are inevitable.
Dividend Kings Recession Watch
| Bonds | Yield |
| 3-Month Treasury Yield | 0.69% |
| 2-Year Treasury Yield | 2.46% |
| 10-Year Treasury Yield | 2.65% |
| 10-3M Curve (Most Accurate Recession Forecasting Tool) | 1.96% |
| 10-2 Curve (Most Popular Yield Curve Followed By Wall Street) | 0.20% |
| Potential Historically Average Recession Start If Curve Inverts Now (Curve Inverted March 31st) | October 31st, 2023 |
| Potential Historically Average Bear Market Start If Curve Inverts Now (Curve Inverted March 31st) | September 8th, 2023 |
| Potential Historically Average Bear Market Bottom (Curve Inverted March 31st) | September 8th, 2024 |
| Potential Historically Average New Record High (Curve Inverted March 31st) | December 8th, 2025 |
(Source: DK S&P 500 Valuation & Total Return Tool) NOT For Market Timing Purposes
The 10-2 curve is the most closely watched by Wall Street but a study from the NY Fed finds that the 10-3 curve is the most accurate at forecasting recessions.
(Source: NY Fed)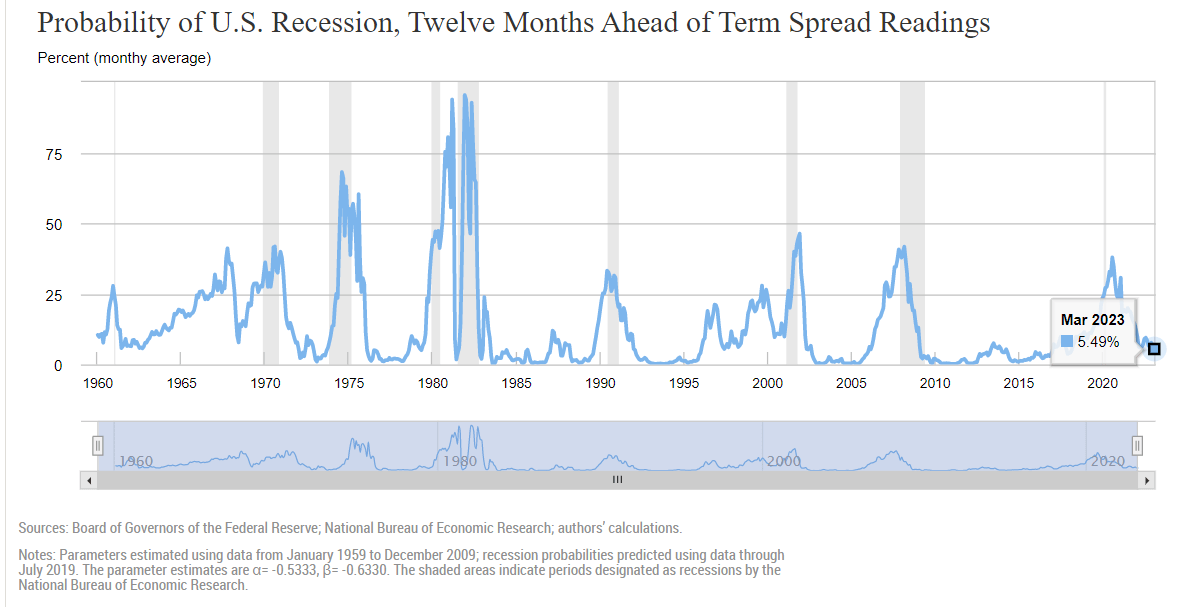
The NY Fed’s model estimates the risk of a recession within the next year is about 5.5%.
(Source: St. Louis Federal Reserve)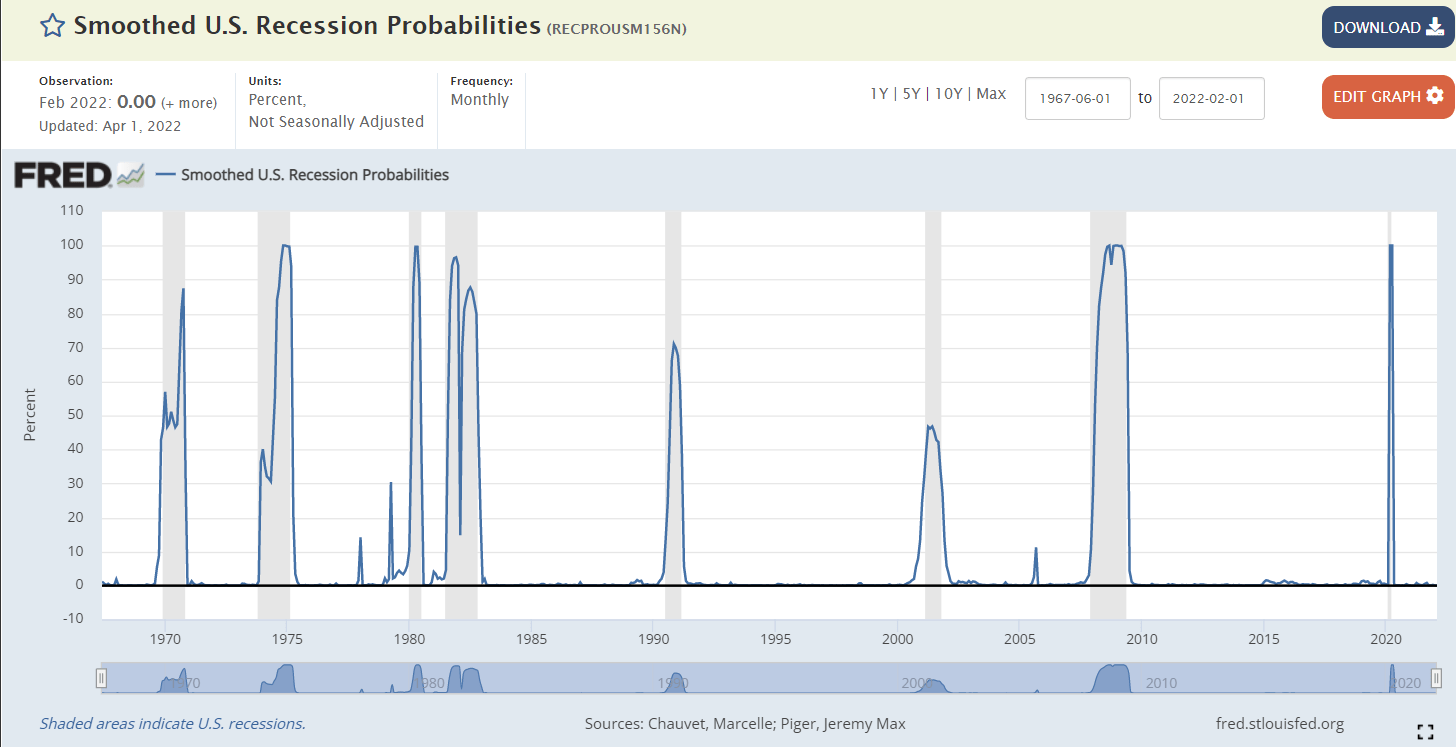
The St. Louis Fed’s model, based on four economic metrics, estimates a 0.0% chance we’re in a recession right now.
Currently, the bond market is not overly concerned about recession risk and we are monitoring the situation closely each day and week.
BaR Economic Grid
That’s through David Rice’s Baseline and Rate of Change or BaR economic grid, which tracks 18 leading economic indicators each week.
Currently, the average of all indicators, or mean of coordinates, is 20% above the historical baseline.
- confirming the NY Fed’s model that says recession risk within 12 months is very low
Even if a recession is coming next year, the stock market doesn’t tend to peak and start a bear market until about 50 days before the recession actually starts.
David Rice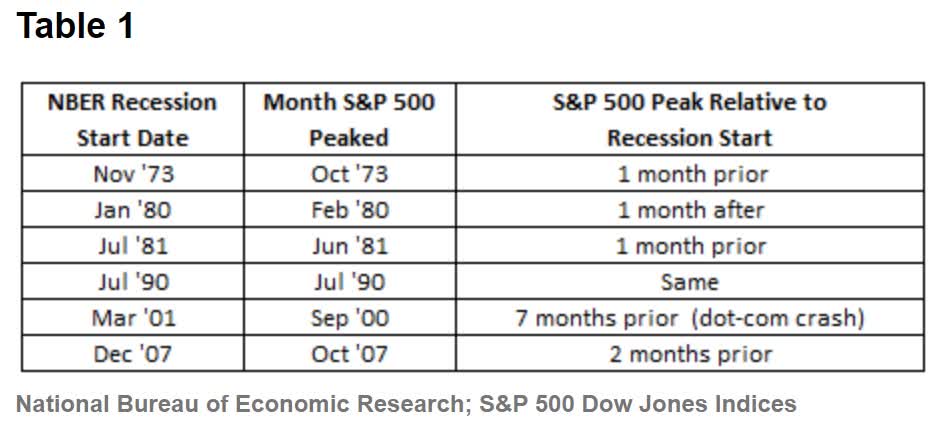
And that data is confirmed by Bloomberg.
Jeff Miller, Bloomberg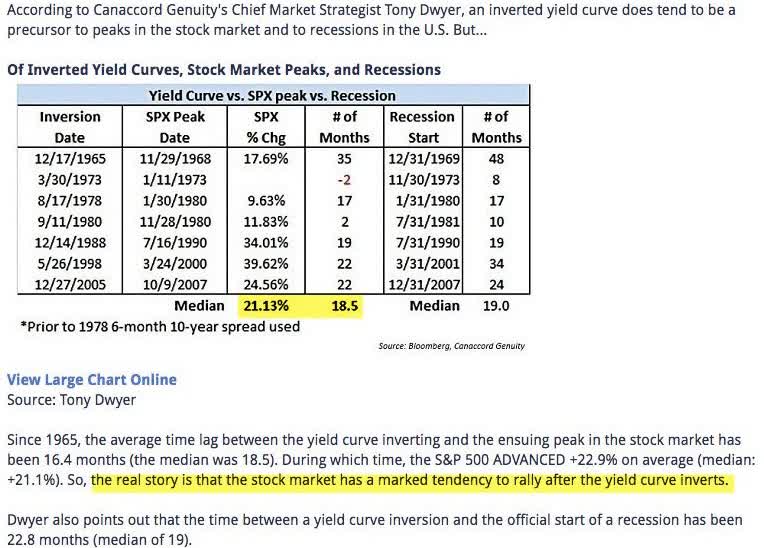
In fact, the median market rally following a 2-10 yield curve inversion (which happened on March 31st) is a 21% gain over the next 18.5 months.
And then right before a recession begins stocks tend to roll over into a 12 month 36% average bear market.
In other words, even if we do get a recession in late 2023 or early 2024, stocks could still go up… a lot.
And guess what’s likely to go up a lot more than the 16% overvalued S&P 500?
Deep value Buffett-style fat pitch Ultra SWAN quality dividend kings like SWK.
But what if we do get a recession relatively soon? Wouldn’t that hurt Stanley? Isn’t it a bad idea to consider buying an industrial with recession risk even at 5.5%?
Why You Can Trust Stanley Even In A Future Recession
SWK is one of the world’s highest quality companies, and here’s how I know this.
The Dividend King’s overall quality scores are based on a 243 point model that includes:
-
dividend safety
-
balance sheet strength
-
credit ratings
-
credit default swap medium-term bankruptcy risk data
-
short and long-term bankruptcy risk
-
accounting and corporate fraud risk
-
profitability and business model
-
growth consensus estimates
-
management growth guidance
-
historical earnings growth rates
-
historical cash flow growth rates
-
historical dividend growth rates
-
historical sales growth rates
-
cost of capital
-
long-term risk-management scores from MSCI, Morningstar, FactSet, S&P, Reuters’/Refinitiv, and Just Capital
-
management quality
-
dividend friendly corporate culture/income dependability
-
long-term total returns (a Ben Graham sign of quality)
-
analyst consensus long-term return potential
In fact, it includes over 1,000 fundamental metrics including the 12 rating agencies we use to assess fundamental risk.
How do we know that our safety and quality model works well?
During the two worst recessions in 75 years, our safety model 87% of blue-chip dividend cuts, the ultimate baptism by fire for any dividend safety model.
And then there’s the confirmation that our quality ratings are very accurate.
DK Zen Phoenix: Superior Fundamentals Lead To Superior Long-Term Results
| Metric | US Stocks | 189 Real Money DK Phoenix Recs |
| Great Recession Dividend Growth | -25% | 0% |
| Pandemic Dividend Growth | -1% | 6% |
| Positive Total Returns Over The Last 10 Years | 42% | 99.5% (Greatest Investors In History 60% to 80% Over Time) |
| Lost Money/Went Bankrupt Over The Last 10 Years | 47% | 0.5% |
| Outperformed Market Over The Last Decade (296%) | 36% | 52% |
| Bankruptcies Over The Last 10 Years | 11% | 0% |
| Permanent 70+% Catastrophic Decline Since 1980 | 44% | 0.5% |
| 100+% Total Return Over The Past 10 Years | NA | 87% |
| Sources: Morningstar, JPMorgan, Seeking Alpha |
Basically, historical market data confirms that the DK safety and quality model is one of the most comprehensive and accurate in the world.
This is why I entrust 100% of my life savings to this model and the DK Phoenix blue-chip strategy.
How does SWK score on one of the world’s most comprehensive and accurate safety and quality models?
SWK Dividend Safety
| Rating | Dividend Kings Safety Score (153 Point Safety Model) | Approximate Dividend Cut Risk (Average Recession) |
Approximate Dividend Cut Risk In Pandemic Level Recession |
| 1 – unsafe | 0% to 20% | over 4% | 16+% |
| 2- below average | 21% to 40% | over 2% | 8% to 16% |
| 3 – average | 41% to 60% | 2% | 4% to 8% |
| 4 – safe | 61% to 80% | 1% | 2% to 4% |
| 5- very safe | 81% to 100% | 0.5% | 1% to 2% |
| SWK | 94% | 0.5% | 1.30% |
| Risk Rating | Low Risk (74th industry percentile risk-management consensus) | A stable outlook credit rating 0.66% 30-year bankruptcy risk | 20% OR LESS Max Risk Cap Recommendation |
Long-Term Dependability
| Company | DK Long-Term Dependability Score | Interpretation | Points |
| Non-Dependable Companies | 21% or below | Poor Dependability | 1 |
| Low Dependability Companies | 22% to 60% | Below-Average Dependability | 2 |
| S&P 500/Industry Average | 61% (58% to 70% range) | Average Dependability | 3 |
| Above-Average | 71% to 80% | Very Dependable | 4 |
| Very Good | 81% or higher | Exceptional Dependability | 5 |
| SWK | 89% | Exceptional Dependability | 5 |
Overall Quality
| SWK | Final Score | Rating |
| Safety | 94% | 5/5 very safe |
| Business Model | 80% | 3/3 wide moat |
| Dependability | 89% | 5/5 exceptional |
| Total | 92% | 13/13 Ultra SWAN Dividend King |
| Risk Rating | 3/3 Low Risk | |
| 20% OR LESS Max Risk Cap Rec |
5% Margin of Safety For A Potentially Good Buy |
SWK: 28th Highest Quality Master List Company (Out of 507) = 94th Percentile
The DK 500 Master List includes the world’s highest quality companies including:
-
All dividend champions
-
All dividend aristocrats
-
All dividend kings
-
All global aristocrats (such as BTI, ENB, and NVS)
-
All 13/13 Ultra Swans (as close to perfect quality as exists on Wall Street)
- 49 of the world’s best growth stocks (on its way to 100)
SWK’s 92% quality score means its similar in quality to such blue-chips as
- Allianz SE (OTCPK:ALIZY)
- Automatic Data Processing (ADP) – dividend aristocrat
- Amazon (AMZN)
- 3M (MMM) – dividend king
- Lowe’s (LOW) – dividend king
- Apple (AAPL)
- Bank of Nova Scotia (BNS)
Even among the most elite companies on earth, SWK is higher quality than 94% of them.
Why I Trust Stanley With My Money And So Can You
SWK was founded in 1843 in New Britain, Connecticut. Since then it’s survived and thrived during which it has paid uninterrupted dividends for 145 consecutive years through
- 43 US recessions
- eight depressions
- inflation ranging from -2.5% to 20%
- interest rates ranging from 0.0% to 20%
- 10-year US Treasury yields ranging from 0.5% to 16%
- dozens of bear markets
- 28 stock market corrections (since WWII alone)
- over 100 market pullbacks
SWK is almost certainly going to outlive us all.
- the ultimate “buy and hold forever and leave to your children” dividend blue-chip
SWK is selling its security business for $3.2 billion in 2022.
- and using most of that for $4 billion in buybacks at very attractive valuations
- $2 to $2.5 billion in Q1 (right during the correction, perfect timing)
- SWK gets 60% of its sales from the US
- 17% from Europe
- 14% from emerging markets
- 9% from the rest of the world
- including M&A management thinks it can achieve 10% to 12% long-term growth
- 7% to 9% growth excluding M&A (same as the analyst consensus)
- which is 12.1% to 14.1% CAGR total return guidance
SWK’s capital allocation strategy is very reasonable and prudent.
- 50% of cash flow for M&A
- 50% for shareholder cash returns (split 50/50 buybacks and dividends)
- 50% M&A
- 25% dividends
- 25% buybacks
SWK is planning to sell its security business and double down on tools, including its two most recent acquisitions, announced in December 2021.
The combination of these two high-quality, complementary businesses with our existing outdoor business creates a powerful growth engine with approximately $4 billion in annual revenue across the $25 billion-plus outdoor power equipment industry. These transactions will be accretive to our 2022 earnings and have the potential for further margin expansion as we integrate these great businesses.
SWK has some of the world’s most trusted tools brands.
- for every end market and a wide range of price points
The average EV generates 4.5X the sales per vehicle as regular gas cars.
And electrifying outdoor tools represent a potential growth opportunity in a $25 billion global market.
SWK’s R&D is going into improving its products, everything from higher energy density batteries, to faster recharging times, to asset tracking for industrial products (monitors tools as they wear out).
- $276 million in 2021 R&D
- up 46% from 2020
The industrial part of the business has an $85 billion annual addressable market.
- more than 3X the size of the outdoor tools market
- $110 billion combined addressable market
- about 14% global market share
SWK has good exposure and growth potential in several major secular megatrends.
- residential home construction
- commercial real estate
- infrastructure spending (a $100+ trillion global opportunity according to Brookfield and the IEA)
- EVs
How good is SWK at executing on its growth potential?
SWK’s capital allocation is so good that its returns on operating capital have doubled over the last 20 years.
SWK’s returns on operating capital are the 3rd best in its industry.
- China is a key growth market
- 400 employees working just on digital commerce at SWK
With 967% returns over the last 20 years compared to 394% returns for the S&P 500, SWK has proven a very dependable company you can trust with your hard-earned savings.
SWK Credit Ratings
| Rating Agency | Credit Rating | 30-Year Default/Bankruptcy Risk | Chance of Losing 100% Of Your Investment 1 In |
| S&P | A stable | 0.66% | 151.5 |
| Fitch | A- stable | 2.50% | 40.0 |
| Moody’s | Baa1 (BBB+ equivalent) | 5.00% | 20.0 |
| Consensus | A- stable | 2.72% | 36.8 |
(Source: S&P, Fitch, Moody’s)
Rating agencies estimate SWK’s fundamental risk at 2.72%.
- a 1 in 37 chance of losing all your money buying SWK today
SWK Leverage Consensus Forecast
| Year | Debt/EBITDA | Net Debt/EBITDA (3.0 Or Less Safe According To Credit Rating Agencies) |
Interest Coverage (8+ Safe) |
| 2020 | 1.73 | 1.16 | 10.37 |
| 2021 | 2.56 | 2.48 | 12.37 |
| 2022 | 2.04 | 2.01 | 11.57 |
| 2023 | 1.73 | 1.40 | 14.02 |
| 2024 | 1.73 | 0.81 | 16.19 |
| Annualized Change | 0.07% | -8.78% | 11.79% |
(Source: FactSet Research Terminal)
SWK’s leverage ratios are safe today and expected to get steadily more so.
Management’s long-term target is 2.0 debt/EBITDA, a strong investment-grade credit rating (current ones), and a 33% payout ratio.
SWK Balance Sheet Consensus Forecast
| Year | Total Debt (Millions) | Cash | Net Debt (Millions) | Interest Cost (Millions) | EBITDA (Millions) | Operating Income (Millions) | Average Interest Rate |
| 2020 | $4,247 | $1,381 | $2,866 | $205 | $2,461 | $2,126 | 4.83% |
| 2021 | $6,661 | $142 | $6,454 | $176 | $2,600 | $2,177 | 2.64% |
| 2022 | $6,242 | $734 | $6,141 | $220 | $3,053 | $2,545 | 3.52% |
| 2023 | $5,802 | $1,872 | $4,668 | $201 | $3,345 | $2,818 | 3.46% |
| 2024 | $6,290 | $3,740 | $2,930 | $191 | $3,634 | $3,093 | 3.04% |
| Annualized Growth | 10.32% | 28.28% | 0.55% | -1.75% | 10.23% | 9.83% | -10.94% |
(Source: FactSet Research Terminal)
Like many companies in the pandemic, SWK took on a lot of debt at record low-interest rates.
However, cash flow supporting that debt is growing rapidly and cash on the balance sheet is growing at 28% annually.
SWK Bond Profile
- $5.6 billion in liquidity
- well staggered debt maturities (no debt maturing until 2026)
- 83% unsecured bonds (high financial flexibility)
- bond investors are so confident in SWK’s long-term energy transition plan they are willing to lend to it for 38 years at 4.9%
- 3.28% average borrowing cost
- 1.1% inflation-adjusted borrowing costs vs 9.4% returns on capital
SWK Credit Default Swaps: The Bond Market’s Real-Time Fundamental Risk Assessment
(Source: FactSet Research Terminal)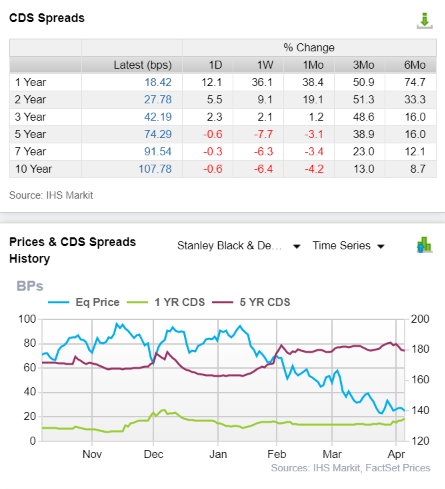
Credit default Swaps are insurance policies bond investors take out against default.
- the bond market’s real-time estimate of fundamental risk
- very useful when headlines are scary and stock prices are crashing
- SWK’s CDS are consistent with its credit ratings
- 3.2% fundamental risk over 30 years according to bond investors
- and relatively stable since September 2021
- when the stock price is crashing but the fundamental risk remains stable you can buy with more confidence
- analysts, rating agencies, and the bond market are all confirming SWK’s investment thesis remains intact
SWK Profitability: Wall Street’s Favorite Quality Proxy
SWK’s historical profitability is in the top 20% of peers.
SWK Trailing 12-Month Profitability Vs Peers
| Metric | Industry Percentile | Major Industrial Companies More Profitable Than SWK (Out Of 2,707) |
| Operating Margin | 71.34 | 776 |
| Net Margin | 76.12 | 646 |
| Return On Equity | 77.63 | 606 |
| Return On Assets | 69.52 | 825 |
| Return On Capital | 92.89 | 192 |
| Average | 77.50 | 609 |
(Source: GuruFocus Premium)
Adjusting for the natural cyclicality of its business, SWK’s industry-leading profitability has been stable for the last 32 years, confirming a wide and stable moat.
SWK Profit Margin Consensus Forecast
| Year | FCF Margin | EBITDA Margin | EBIT (Operating) Margin | Net Margin | Return On Capital Expansion |
Return On Capital Forecast |
| 2020 | 11.5% | 16.9% | 14.6% | 9.7% | 1.04 | |
| 2021 | 0.9% | 16.7% | 14.0% | 11.1% | TTM ROC | 61.01% |
| 2022 | 11.9% | 15.6% | 13.0% | 9.5% | Latest ROC | NA |
| 2023 | 10.9% | 16.4% | 13.8% | 9.8% | 2024 ROC | 63.18% |
| 2024 | 10.4% | 17.0% | 14.5% | 10.2% | 2024 ROC | NA |
| 2025 | NA | NA | NA | NA | Average | 63.18% |
| 2026 | NA | NA | NA | NA | Industry Median | 13.82% |
| Annualized Growth | -2.53% | 0.07% | -0.30% | 1.38% | SWK/Peers | 4.57 |
| Vs S&P | 4.33 |
(Source: FactSet Research Terminal)
SWK’s margins are expected to remain relatively stable in the coming years.
Returns on capital or ROC is Joel Greenblatt’s gold standard proxy for quality and moatiness.
ROC = pre-tax profit/operating capital (the money it takes to run the business).
SWK’s ROC has been over 60% in the last year and is expected to modestly improve in the next few years.
- for every $1 it takes to run the business, SWK is generating over $0.6 in annual pre-tax profit
- average SWK investment pays for itself in 20 months
- S&P 500’s average in 2021 was 14.6% (average investment pays for itself in 7 years)
- according to one of the greatest investors in history, SWK is nearly 4X higher quality than the S&P 500
For three decades SWK’s ROC has been trending higher at 2.2% annually over time.
- further confirmation of its wide and stable moat
SWK Dividend Growth Consensus Forecast
| Year | Dividend Consensus | EPS/Share Consensus | Payout Ratio | Retained (Post-Dividend) Cash Flow | Buyback Potential | Debt Repayment Potential |
| 2021 | $2.98 | $11.20 | 26.6% | $1,340 | 5.42% | 20.1% |
| 2022 | $3.16 | $11.99 | 26.4% | $1,439 | 5.83% | 21.6% |
| 2023 | $3.34 | $13.31 | 25.1% | $1,625 | 6.58% | 26.0% |
| 2024 | $3.53 | $14.47 | 24.4% | $1,783 | 7.22% | 30.7% |
| Total 2021 Through 2024 | $13.01 | $50.97 | 25.5% | $6,187.48 | 25.04% | 92.89% |
| Annualized Rate | 5.81% | 8.91% | -2.85% | 10.00% | 10.00% | 15.18% |
(Source: FactSet Research Terminal)
- according to rating agencies, 60% is a safe payout ratio for this industry
- SWK is expected to average 25.5%
- and retain $6.2 billion in post-dividend earnings
- enough to repay almost all of its current debt
- or buyback as much as 25% of shares at current valuations
| Year | Consensus Buybacks ($ Millions) | % Of Shares (At Current Valuations) | Market Cap |
| 2022 | $4,005.0 | 16.2% | $24,708 |
| 2023 | $104.0 | 0.4% | $24,708 |
| 2024 | $149.0 | 0.6% | $24,708 |
| Total 2022-2024 | $4,258.00 | 17.2% | $24,708 |
| Annualized Rate | 6.10% | Average Annual Buybacks | $1,419.33 |
(Source: FactSet Research Terminal)
These repurchase actions are a significant step to complete our expected $4 billion share repurchase in 2022,” said Stanley Black & Decker’s CEO Jim Loree. “These repurchases come as we look to deliver another strong year in 2022 and continue to position the business for a multi-year runway for growth and margin expansion. This program is an attractive use of capital and represents a compelling value.” – CEO, buyback announcement
At current valuations, SWK could buy back 17% of its shares according to management.
SWK is opportunistic with buybacks, sometimes issuing shares to make major acquisitions and other times buying back 10% of its shares in a single year.
- this is the largest single-year buyback SWK has ever accomplished
- potentially 75% larger (in net shares) than any other single year repurchase program
| Time Frame (Years) | Net Buyback Rate | Shares Remaining | Net Shares Repurchased | Each Share You Own Is Worth X Times More (Not Including Future Growth And Dividends) |
| 5 | 0.8% | 96.11% | 3.89% | 1.04 |
| 10 | 0.8% | 92.38% | 7.62% | 1.08 |
| 15 | 0.8% | 88.78% | 11.22% | 1.13 |
| 20 | 0.8% | 85.33% | 14.67% | 1.17 |
| 25 | 0.8% | 82.01% | 17.99% | 1.22 |
| 30 | 0.8% | 78.82% | 21.18% | 1.27 |
(Source: DK Research Terminal, Ycharts)
And even if SWK only buyback a modest historical 0.8% of its stock each year that 21% potential share count reduction over the next 30 years.
- +16% management says its going to buyback this year
- 37% share count reduction potential for SWK
Bottom line, SWK has survived and thrived through eight depressions, including the Great Depression.
- no economic downturn since 1845 has caused SWK to miss a single dividend payment
- so I can say with 80% confidence that this dividend is rock solid no matter what the economy throws at us
- 80% is the John Templeton/Howard Marks certainty limit for Wall Street
- it represents “I’ll die on this hill” confidence
Strong Growth Prospects For Decades To Come
What does a steadily growing $110 billion addressable market and just 14% market share mean for SWK’s medium-term growth prospects?
SWK Medium-Term Consensus Forecast
| Year | Sales | Free Cash Flow | EBITDA | EBIT (Operating Income) | Net Income |
| 2020 | $14,535 | $1,674 | $2,461 | $2,126 | $1,410 |
| 2021 | $15,600 | $144 | $2,600 | $2,177 | $1,729 |
| 2022 | $19,514 | $2,329 | $3,053 | $2,545 | $1,850 |
| 2023 | $20,453 | $2,233 | $3,345 | $2,818 | $1,997 |
| 2024 | $21,402 | $2,225 | $3,634 | $3,093 | $2,193 |
| Annualized Growth | 10.16% | 7.37% | 10.23% | 9.83% | 11.67% |
(Source: FactSet Research Terminal)
SWK is expected to deliver very solid high single/low-double-digit top and bottom-line growth through 2024.
| Metric | 2020 Growth | 2021 Growth Consensus | 2022 Growth Consensus | 2023 Growth Consensus | 2024 (Potential recession year) Growth Consensus |
2025 Growth Consensus |
| Sales | -13% | 18% | 24% | 5% | 5% | NA |
| Dividend | 5% | 2% | 13% (Official) | 6% | 6% (56-Year dividend growth streak) | NA |
| EPS | 8% | 24% | 9% | 11% | 8% | 16% |
| Operating Cash Flow | 29% | -68% | 292% | 4% | -2% | NA |
| Free Cash Flow | 49% | -92% | 1308% | 5% | 2% | NA |
| EBITDA | -3% | 8% | 9% | 9% | 7% | NA |
| EBIT (operating income) | -4% | 11% | 16% | 12% | 8% | NA |
(Source: FAST Graphs, FactSet Research Terminal)
SWK is expected to deliver very steady growth in the coming years, though cash flows are expected to be more volatile based on the timing of recessions.
What about the long-term?
FactSet Research Terminal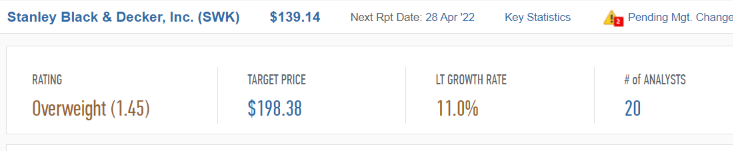
Of the 20 analysts covering SWK on Wall Street, the median long-term growth consensus is…11%, the midrange of management’s long-term guidance.
Analysts are saying to buy SWK.
Morningstar is saying the same thing.
No less than three of the Dividend Kings are screaming from the rooftops that SWK is a potentially very strong buy.
| Rating | Margin Of Safety For Low-Risk 13/13 Ultra SWAN Quality Companies | 2022 Price | 2023 Price |
12-Month Forward Fair Value |
| Potentially Reasonable Buy | 0% | $196.27 | $206.05 | $198.91 |
| Potentially Good Buy | 5% | $186.46 | $195.75 | $188.96 |
| Potentially Strong Buy | 15% | $166.83 | $175.14 | $169.07 |
| Potentially Very Strong Buy | 25% | $139.84 | $154.54 | $149.18 |
| Potentially Ultra-Value Buy | 35% | $127.58 | $133.93 | $129.29 |
| Currently | $139.05 | 29.16% | 32.52% | 30.09% |
| Upside To Fair Value (Not Including Dividends) | 41.15% | 48.18% | 43.05% |
(Source: DK Research Terminal)
For anyone comfortable with its risk profile SWK is a potentially very strong buy.
What about its risk profile?
Risk Profile: Why Stanley Isn’t Right For Everyone
There are no risk-free companies and no company is right for everyone. You have to be comfortable with the fundamental risk profile.
One reason SWK is down so much in recent weeks.
Stanley Black & Decker today announced that it plans to restate its previously issued consolidated financial statements to correct its accounting with respect to its Equity Units in response to comments received from the Securities and Exchange Commission (the “SEC”).
After giving effect to this change, the Company’s diluted GAAP earnings per share are reduced by $0.31, $0.24, and $0.14 for the fiscal years ended January 2, 2021, December 28, 2019, and December 29, 2018, respectively. Excluding acquisition-related and other charges, the Company’s diluted earnings per share are reduced by $0.36, $0.31, and $0.27 for the fiscal years ended January 2, 2021, December 28, 2019, and December 29, 2018, respectively. This accounting correction was reflected on a prospective basis as previously discussed on Form 8-K and Form 10-Q as filed on November 12, 2021.
The changes will not impact the Company’s historical net earnings and do not affect compliance with the financial covenants contained in the Company’s outstanding debt instruments or compliance with any other agreement of the Company or its subsidiaries. The effects of these changes are detailed in a Current Report on Form 8-K that is also being filed with the SEC today. – Press release
These kinds of restatements happen from time to time.
- it’s not an indication of fraud
- just updating information
- 3% reduction in EPS for 3 years
- according to the M-score SWK’s probability of accounting fraud is less than 17.5%
SWK’s Risk Profile Summary
- economic cyclicality risk: sales could suffer in a recession
- M&A risk: SWK frequently makes tuck-in acquisitions
- margin compression risk: over 2,700 major global rivals
- supply chain disruption risk: big impact in 2021 (SK is a major supplier, NK war risk)
- technology disruption risk
- customer concentration risk: top 2 customers (HD and LOW): 29% of sales
- labor retention risk (tightest job market in over 50 years and finance is a high paying industry) – rising wage pressures
- currency risk (growing over time due to international expansion)
- pension fund risk: $2.6 billion pension fund
- recall/legal liability risk
- accounting fraud risk: less than 17.5% statistical chance of accounting fraud
The continued creation, development, and advancement of new technologies such as 5G data networks, artificial intelligence, blockchain, quantum computing, data analytics, 3-D printing, robotics, sensor technology, data storage, neural networks, augmented reality, amongst others, as well as other technologies in the future that are not foreseen today, continue to transform the Company’s processes, products, and services.” – 10-K
SWK’s risk profile stretches 14 pages in its annual report.
- which isn’t unusual for this industry
How do we quantify, monitor, and track such a complex risk profile? By doing what big institutions do.
Material Financial ESG Risk Analysis: How Large Institutions Measure Total Risk
- 4 Things You Need To Know To Profit From ESG Investing
- What Investors Need To Know About Company Long-Term Risk Management (Video)
Here is a special report that outlines the most important aspects of understanding long-term ESG financial risks for your investments.
- ESG is NOT “political or personal ethics based investing”
- it’s total long-term risk management analysis
“‘ESG is just normal risk by another name.’ Simon MacMahon, head of ESG and corporate governance research, Sustainalytics” – Morningstar
“ESG factors are taken into consideration, alongside all other credit factors, when we consider they are relevant to and have or may have a material influence on creditworthiness.” – S&P
ESG is a measure of risk, not of ethics, political correctness, or personal opinion.
S&P, Fitch, Moody’s, DBRS (Canadian rating agency), AMBest (insurance rating agency), R&I Credit Rating (Japanese rating agency), and the Japan Credit Rating Agency have been using ESG models in their credit ratings for decades.
- credit and risk management ratings make up 41% of the DK safety and quality model
- dividend/balance sheet/risk ratings make up 82% of the DK safety and quality model
Dividend Aristocrats: 67th Industry Percentile On Risk Management (Above-Average, 24/100 Medium Risk)
SWK Long-Term Risk Management Consensus
| Rating Agency | Industry Percentile |
Rating Agency Classification |
| MSCI 37 Metric Model | 48.0% |
BBB Average, Stable Trend |
| Morningstar/Sustainalytics 20 Metric Model | 82.8% |
26.1/100 Medium-Risk |
| Reuters’/Refinitiv 500+ Metric Model | 91.0% | Good |
| S&P 1,000+ Metric Model | 81.0% |
Very Good- Stable Trend |
| Just Capital 19 Metric Model | 91.30% | Excellent |
| FactSet | 50.0% |
Average- Positive Trend |
| Consensus | 74% | Good |
(Sources: MSCI, Morningstar, Reuters’, Just Capital, S&P, FactSet Research)
SWK Long-Term Risk Management Is The 149th Best In The Master List (70th Percentile)
| Classification | Average Consensus LT Risk-Management Industry Percentile |
Risk-Management Rating |
| S&P Global (SPGI) #1 Risk Management In The Master List | 94 | Exceptional |
| Strong ESG Stocks | 78 |
Good – Bordering On Very Good |
| Foreign Dividend Stocks | 75 | Good |
| Stanley Black & Decker | 74 | Good |
| Ultra SWANs | 71 | Good |
| Low Volatility Stocks | 68 | Above-Average |
| Dividend Aristocrats | 67 | Above-Average |
| Dividend Kings | 63 | Above-Average |
| Master List average | 62 | Above-Average |
| Hyper-Growth stocks | 61 | Above-Average |
| Monthly Dividend Stocks | 60 | Above-Average |
| Dividend Champions | 57 | Average |
(Source: DK Research Terminal)
SWK’s risk-management consensus is in the top 30% of the world’s highest quality companies and similar to that of such other companies as
- Caterpillar (CAT) – dividend aristocrat
- Archer-Daniels-Midland (ADM) – dividend aristocrat
- McCormick (MKC) – dividend aristocrat
- Clorox (CLX) – dividend aristocrat
- Brookfield Asset Management (BAM)
- Cisco (CSCO)
The bottom line is that all companies have risks, and SWK is good at managing theirs.
How We Monitor SWK’s Risk Profile
- 20 analysts
- 3 credit rating agencies
- 8 total risk rating agencies
- 28 experts who collectively know this business better than anyone other than management
- and the bond market for real-time fundamental risk analysis
When the facts change, I change my mind. What do you do sir?” – John Maynard Keynes
There are no sacred cows at iREIT or Dividend Kings. Wherever the fundamentals lead we always follow. That’s the essence of disciplined financial science, the math behind retiring rich and staying rich in retirement.
Bottom Line: Stanley Black & Decker Is A Buffett-Style “Fat Pitch” Dividend Aristocrat Bargain
I can’t tell you whether or not a recession is coming in 2023 or 2024.
I can’t tell you when this correction will end.
I can’t tell you how high the Fed will hike interest rates or how fast.
No one else can either.
“Nobody can predict interest rates, the future direction of the economy or the stock market. Dismiss all such forecasts and concentrate on what’s actually happening to the companies in which you’ve invested.” – Peter Lynch
But it doesn’t take a crystal ball to get rich with the world’s best blue-chips.
Reasons To Potentially Buy SWK
- 92% quality low-risk 13/13 Ultra SWAN quality dividend king
- very safe 2.2% yield (94% safety score = 0.5% average recessionary dividend cut risk and 1.3% severe recessionary cut risk)
- 54-year dividend growth streak
- 30% undervalued (potential very strong buy)
- Fair Value: $198.91
- 11.2 PE vs 16.5 to 18.5 historical
- 10.1X cash-adjusted earnings!
- A stable outlook credit rating = 0.66% 30-year bankruptcy risk
- risk management consensus 74th industry percentile = Good
- 11.0% CAGR median growth consensus
- management guidance: 10% to 12% CAGR growth
- 5-year consensus total return potential: 16% to 21% CAGR
- base-case 5-year consensus return potential: 19% CAGR (5X market consensus)
- consensus 12-month total return forecast: 46%
- Fundamentally Justified 12-Month Returns: 46% CAGR
SWK is the ultimate example of how its always and forever a market of stocks, not a stock market.
While the S&P 500 is still 16% historically overvalued, SWK is a 30% screaming bargain.
While many speculative tech names still trade at absurd valuations, you can buy SWK at just 10.1X cash-adjusted earnings.
How absurdly great of a bargain is this?
- pre-pandemic the average private equity deal was closing at 12.3X cash adjusted earnings
Today SWK is a bargain even by private equity standards!
And it’s one of the world’s greatest companies, growing at double-digits.
“Luck is what happens when preparation meets opportunity.” – Roman Philosopher Seneca the younger
If you’re tired of spinning your wheels and fretting about the Fed, interest rates, inflation, the war, and recession, then maybe it’s time to start making your own luck.
Because if there is one thing I know with 80% absolute certainty, it’s that a company that has never missed a dividend payment for 145 years, through eight depressions, represents the ultimate sleep well at night long-term “buy and hold forever” investment.
Be the first to comment