


wildpixel/iStock via Getty Images
Yesterday I joined Seana Smith, Dave Briggs and Rachelle Akuffo In-Studio at Yahoo! Finance. Thanks to Taylor Clothier and Sydnee Fried for having me on.
Because I came on immediately following Fed Chairman Jay Powell’s press conference, the interview focused on the Fed in real-time. The odd thing about the press release the Fed issued and Powell’s press conference was the contradictory nature of both parts.
Back when Jon Hilsenrath was the “Fed Whisperer” at the Wall Street Journal, you could count on whatever he signaled would be consistent with what came out of either Chairman Bernanke or Yellen’s mouth. The new Fed whisperer at the WSJ, Nick Timiraos – has been less bankable – putting out a dovish signal and sparking a rally several weeks ago, then walking it back on Sunday. It is unclear how much of what he writes is his own opinion or what he is receiving directly from Powell, but thus far does not have the reliability we had from his predecessor Hilsenrath. Either his access is very limited or the messages he is receiving are convoluted, but there is a clear communication breakdown.
Original rally spark October 13:
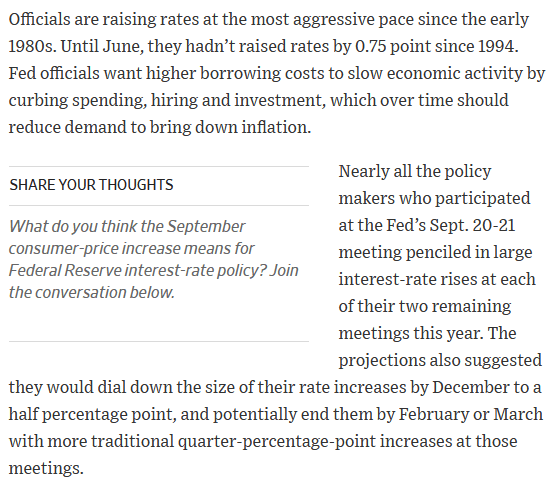
FED
Follow through confirmation October 21:
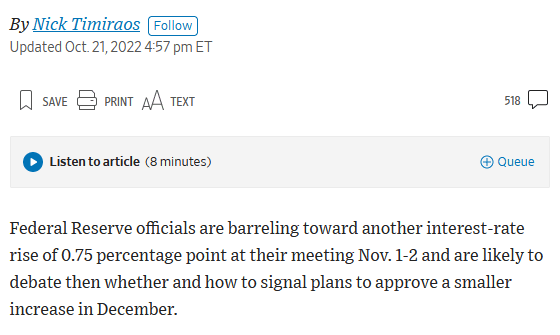
Nick Timiraos
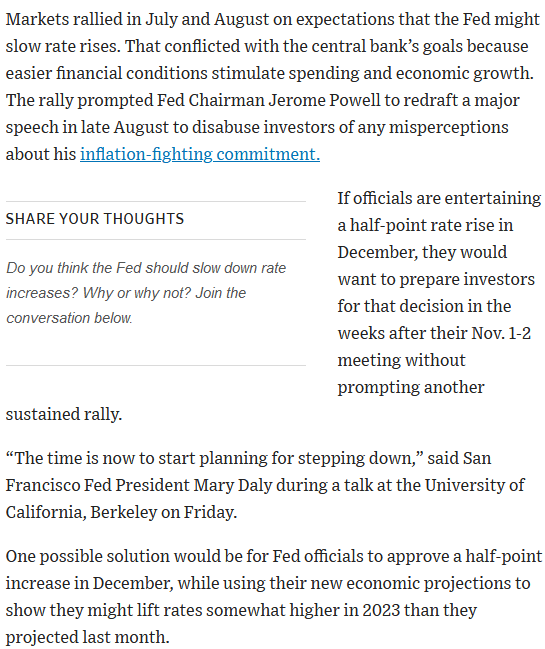
FED
Walk-back October 30:
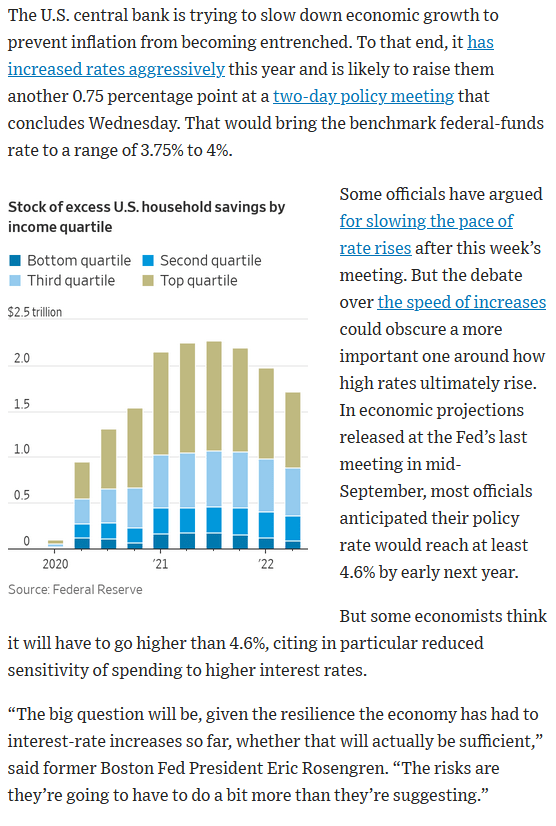
FED
Latest Note November 2 (7:21 pm):
Nick Timiraos
FED
FED
The market action correlates pretty well with his writing, the challenge is it flip-flops every couple of weeks:
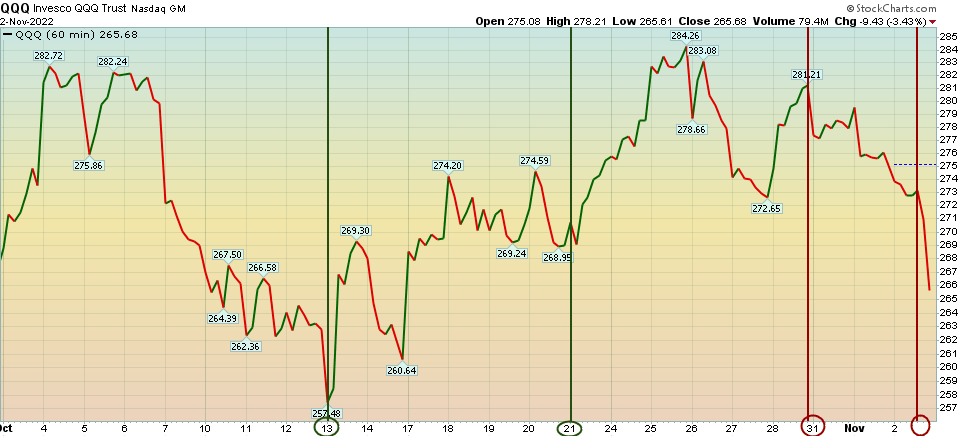
Stockcharts
The cherry on the sundae of mixed messaging came on Wednesday when the Federal Reserved released a very dovish official statement (noted by green underline below) – which caused the markets to rally ~1%, only to be reversed and destroyed by Chair Powell’s contradictory double-talk press conference (closing the S&P 500 down -2.51% on the day):
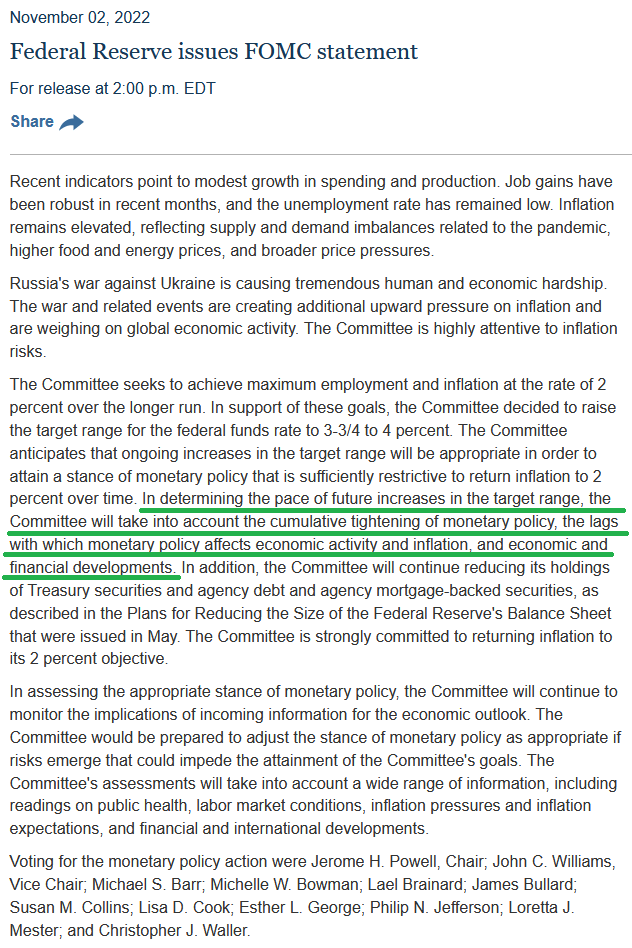
FOMC
How you can go from that official statement to its “premature for any pause” is beyond me. The definition of “taking into account the cumulative tightening of monetary policy (400bps in 8 months + QT) and the lags which monetary policy affects economic activity and inflation” is to pause and see the impact over a few months before doing more. Depending on what markets do today I would guess we’ll see another article from the “Fed Whisperer” and/or a parade of Fed speakers in coming days to “clarify” what they meant (based on market action) – because what was written and what was said were two different stories.
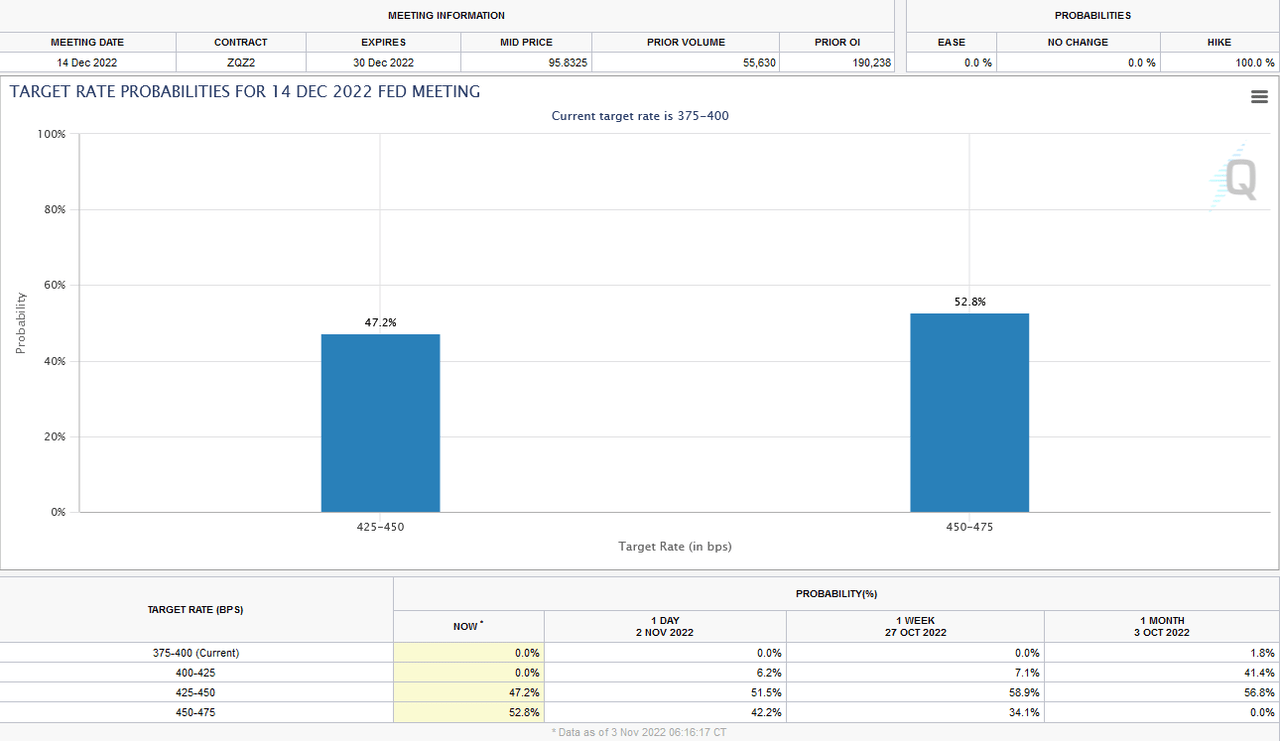
The only positive takeaway was a signaled reduction to 50bps in December or the next meeting afterward. Unfortunately, as of this morning, the futures markets now assign only a 47.2% chance that the December hike will only be 50bps. That is down from 58.9% just a week ago (shortly after Timiraos suggested that 50bps was the plan):
FED
As I said in the interview above, “the first move (in this case down) is usually the wrong one following a Fed meeting. Give it 24 hours to digest and we’ll see how it develops.”
Here were my show notes ahead of the segment that we did not have time to cover due to the Powell Presser:
Earnings:
->50% co’s reported. 71% beat EPS, 68% beat revenue.
-EPS growth +2.2% (vs. 2.8% est).
– Forward P/E 16.3 vs 5yr avg 18.5.
-Ex-Energy (+39.5% yoy), S&P 500 EPS growth -0.6% (Fed slowing demand).
-EST +0.5% EPS growth Q4 and +6.1% 2023
-Communication Services (largest yoy EPS decline) was albatross with Alphabet and Meta (sector –18.9% yoy). Excluding GOOGL & META –2.3%.
– The bottom-up 12 month target price for the S&P 500 is 4528.45, which is ~17% higher.
–Communication Services (+33.5%) sector is expected to see the largest price increase, as this sector has the largest upside differences between the bottom-up target price and the closing price.
-In contrast to 2022, in 2023, Consumer Discretionary is expected to have highest earnings growth off low base (+33.5%) and Energy the worst sector at (-11.4%).
-Earnings estimates have come down almost 6% for 2023 in the past six months to $235.61.
-This sets the stage for some strength into year-end as Fed slows down – followed by sideways/up biased churn until earnings start to recover in mid-2023. Sector and Stock selection will be key.
FED:
75bps Wednesday.
2yr treasury yield 4.55% implies 150bps more already priced in.
Will Fed start to slow down and start to look around to see impact of six consecutive hikes 25, 50, 75, 75, 75, (75 Nov) (375bps) by decelerating to 50 in December, or keep pedal to the medal and drive the economy off a cliff?
GDP at +2.6% was a “one-off” due to exports (primarily notably petroleum and products) that are not expected to repeat. Net exports of goods and services added 2.77 percentage points to the headline total, meaning GDP essentially would have been negative otherwise.
JOLTS came in hot at 10.71M v. 10M est. signaling the Jobs report might be hotter than 200K estimates on Friday. Not good for the slowdown case.
Wage growth is slowing (positive).
Dial down the pace if terminal rate remains at 4.6%.
Next step is a slowdown before a pause.
BofA Institutional Positioning from October:
- 38% (majority) of FMS investors expect the Fed tightening cycle to end in Q1 2023 – one quarter faster than a month ago.
This is consistent with my thoughts above – the worst case scenario is already priced in.
- Investors are now 3-sigma Underweight equities, surpassing even the panic during the trough of the 2008-2009 GFC.
- Managers are crowded into cash and out of equities. These conditions are present at every capitulation low.
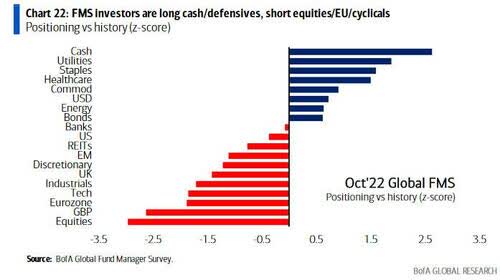
BofA
3. Long USD is the most crowded trade. As you go back through the previous most crowded trades.
Election:
18.6% on average S&P 12 mo. forward returns following mid-term elections.
If Republicans gain House and Senate (currently at 70% odds), any further fiscal spending will be shut off. Additionally, existing inflationary bills like IRA and BBB will be challenged. If that is the case, the Fed may find they have already over-tightened and will be pausing sooner than expected as the data rolls over. Next week is KEY for inflation expectations as M2 money supply is already signaling what’s next:
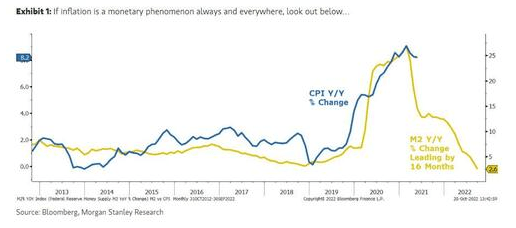
Morgan Stanley
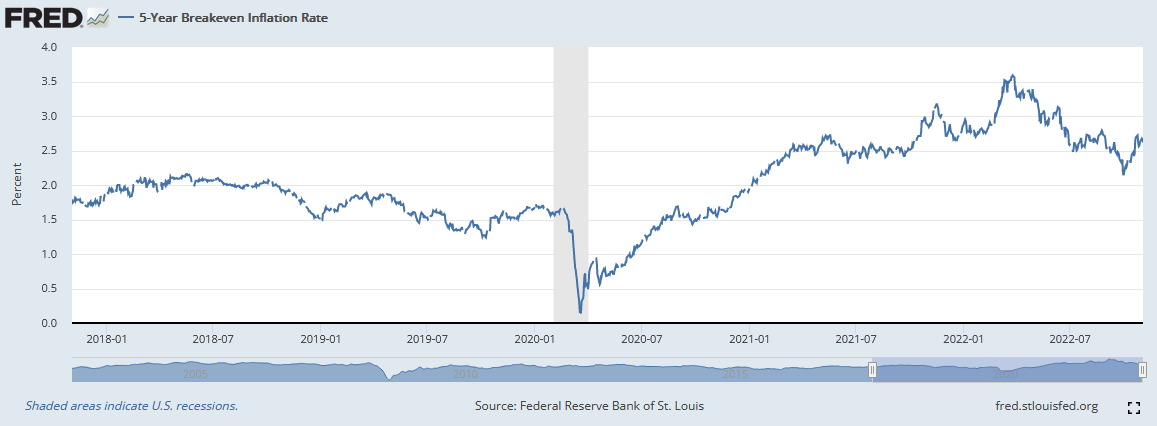
Fred
Buybacks
Buyback Window Re-open after earnings. ~$5B/day to get ahead of 1% tax that hits Jan 1.
Key Idea for 2023
Whether the Fed does 50 or 75bps in December, the key is that we’re approaching the end of tightening – likely in Q1. The biggest impacts are:
- Bonds will get bid.
- The Dollar will stop going up.
Emerging Markets (EEM) now trading at 2007 prices. Historically trade opposite the $USD. When dollar is strong (black line below) – as it has been rising since Spring of last year – Emerging Markets have sold off ~40%. When the Dollar stops going up as it did in 2002, 2009, 2016, 2020, you will see a monster rally in EEM – just as we saw:
+480% from 2002-2007
+189% from 2009-2011
+96% from 2016-2018
+97% from 2020-2021
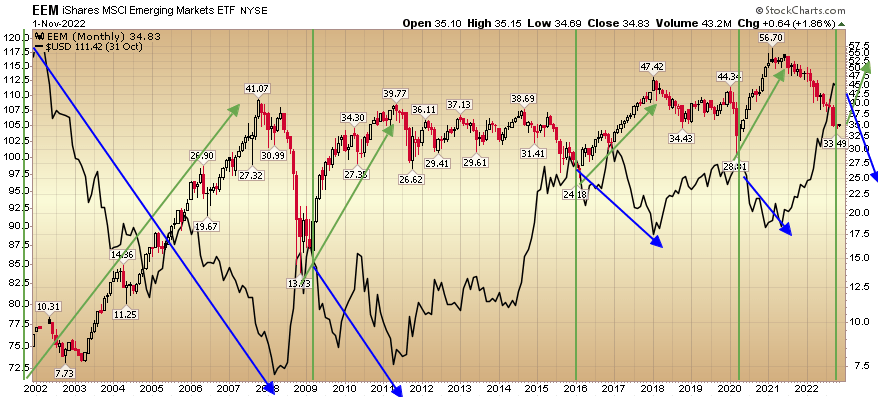
Stockcharts
The only people positioned for a stabilization in rates and a decline in the dollar are commercial hedgers. They are always early and always right. You can bet they’ll be wrong this one time, but the odds are dramatically against you:
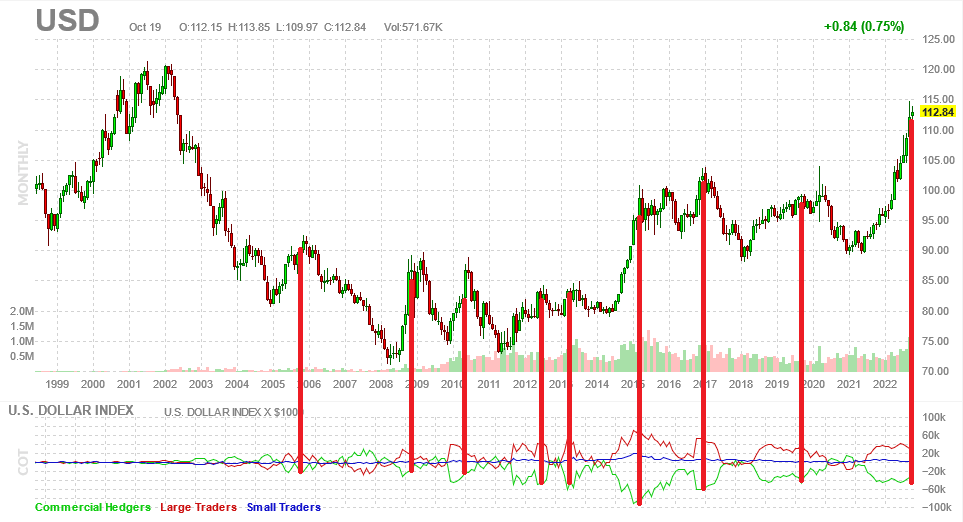
Barchart
Commercial Hedgers (the green line at the bottom of the chart above) are currently short USD – just as they were before the drops in 2019, 2017, 2015, 2013, 2012, 2010, 2009, 2005.
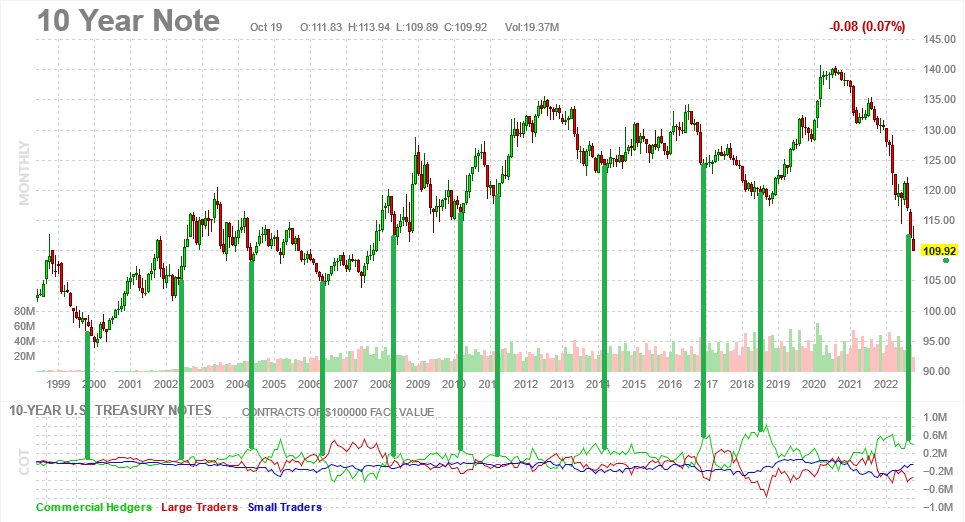
Barchart
Commercial Hedgers (the green line at the bottom of the chart above) are currently long 10 year Treasuries – just as they were before the rallies in bonds (drop in yields) in 2018, 2017, 2014, 2011, 2010, 2008, 2006, 2004, 2002, 1999. Bet against them at your own peril.
Managers Still not positioned for any “White Swans”:
- Interest Rates Falling
- USD stabilizing
- Massive stock buybacks before new 1% tax hits on January 1, 2023
- $750 billion stimulus hasn’t hit economy yet
- Supply Chain Improving
- Freight Rates Dropping
- Collapsing prices: Commodities, Gas, Rents, Used Cars
- Political Gridlock after November 8 election (bullish)
- Millennials (72M) housing/family formation wave JUST BEGINNING
- Less hikes than 150bps more
- A cease fire in Russia/Ukraine (low probability, but odds rise as European winter/protests approach)
Auto Supplier Update
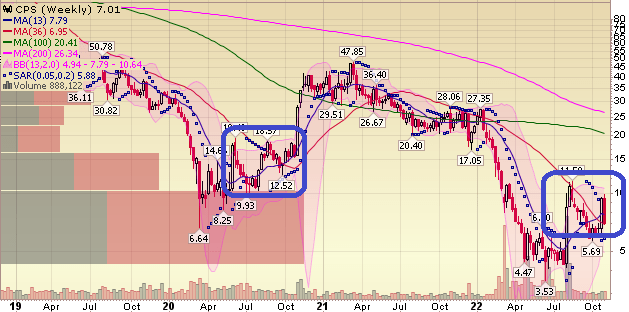
Stockcharts
We will cover this more extensively on the podcast|videocast tonight, but overall, the Cooper Standard earnings results were solid:
Third Quarter 2022 Summary
• Sales totaled $657.2 million, an increase of 24.8% compared to third quarter 2021• Net loss narrowed to $32.7 million or $(1.90) per diluted share compared to a net loss of $123.2 million or $(7.20) per diluted share in the third quarter 2021• Adjusted EBITDA totaled $20.5 million; adjusted EBITDA margin improved by approximately 950 basis points vs. third quarter 2021• Quarter-end cash balance of $231 million; continuing strong total liquidity of $387 million• Net new business awards on electric vehicles of $27 million in the quarter and $72 million year to date; Total net new business awards of $66 million in the quarter and $124 million year to date.
Here’s my takeaway based on the progress: Q2 2022 (-$10M Adj. EBITDA) Q3 2022 (+20M Adj. EBITDA) Q4 2022 GUIDANCE (+35-40M Adj. EBITDA). The operating leverage (hockey stick) is kicking in as the semiconductors finally started rolling into the OEMs this summer.
CEO Jeff Edwards expected volumes to be higher from the OEMs this quarter, but he still made huge progress focusing on the things he could control. The volumes will come.
Why did the stock sell off? No news on the refinancing front other than they were still in discussions with lenders and Goldman Sachs was still their advisor. There will be no news/updates until it’s done. Then one day (not guaranteed) we will see a press release and the impact on the stock as the core catalyst. But if you look at the chart above, it’s acting very similarly to how it behaved at its last bottom. Expect more volatility until we see a resolution in the refinancing (despite meaningful positive underlying business progress).
Just as I said the upside spike in the stock last quarter was meaningless until they get the refinancing done, so is the downside swoon this quarter. When the refinancing is announced, THEN and only THEN will the focus shift to the improving fundamentals and be credited by the market.
Now onto the shorter term view for the General Market:
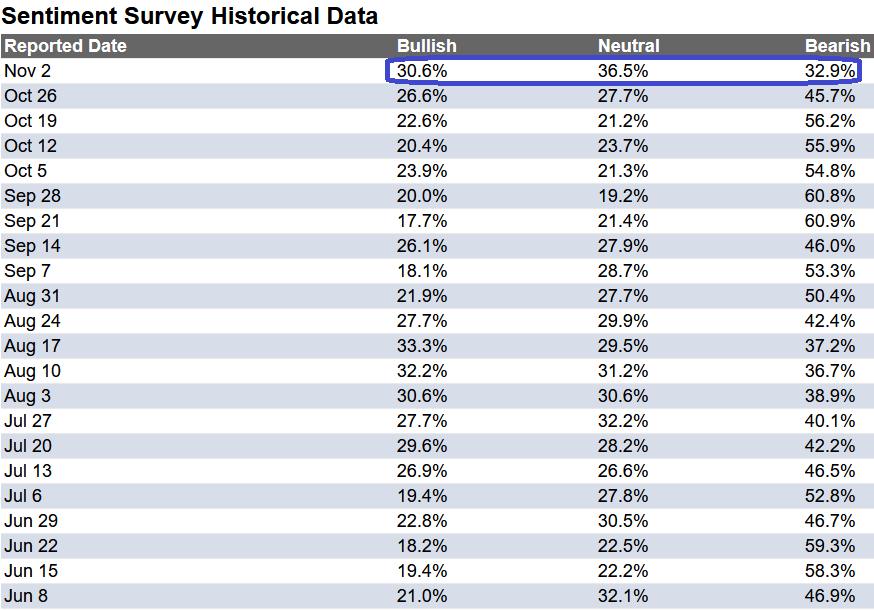
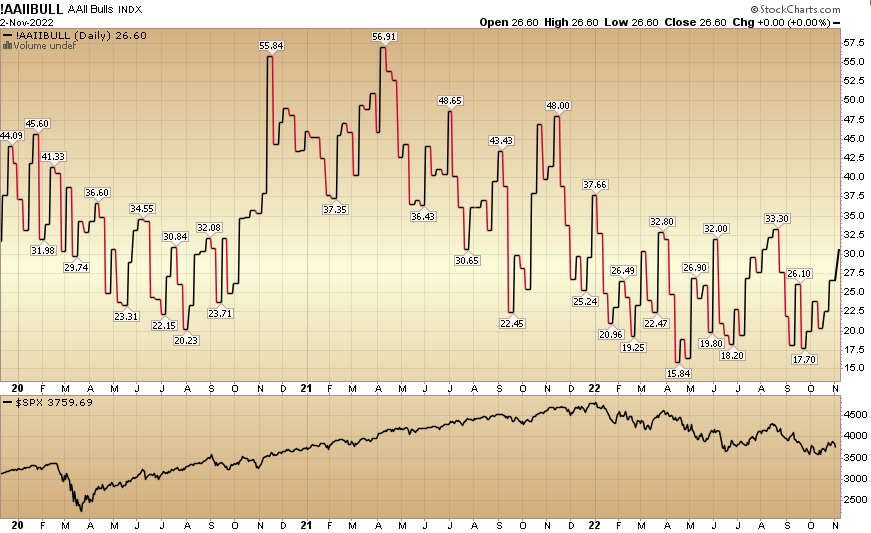
In this last week’s AAII Sentiment Survey result, Bullish Percent ticked up to 30.6% from 26.6% the previous week. Bearish Percent dropped to 32.9% from 45.7%. Retail Sentiment is improving.
AAII
Stockcharts
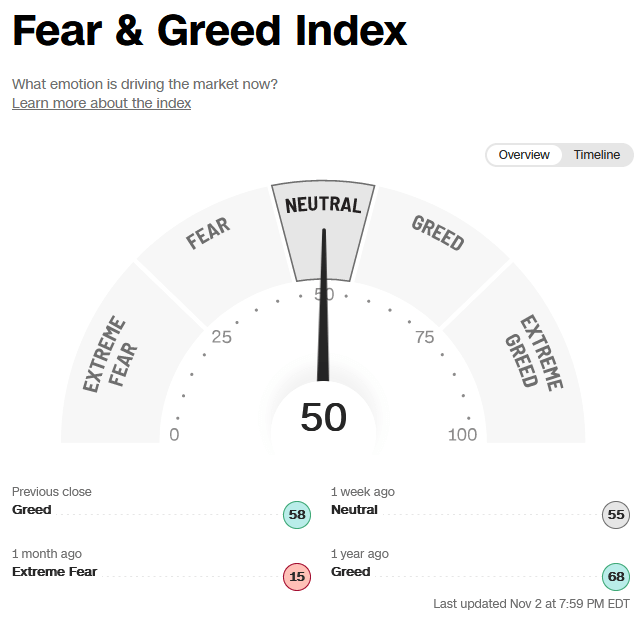
The CNN “Fear and Greed” ticked down from 55 last week to 50 this week. Sentiment is neutral/confused!
CNN
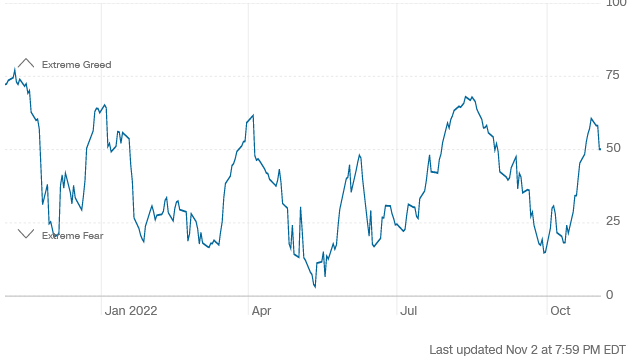
CNN
And finally, the NAAIM (National Association of Active Investment Managers Index) rose to 53.91% this week from 43.28% equity exposure last week.
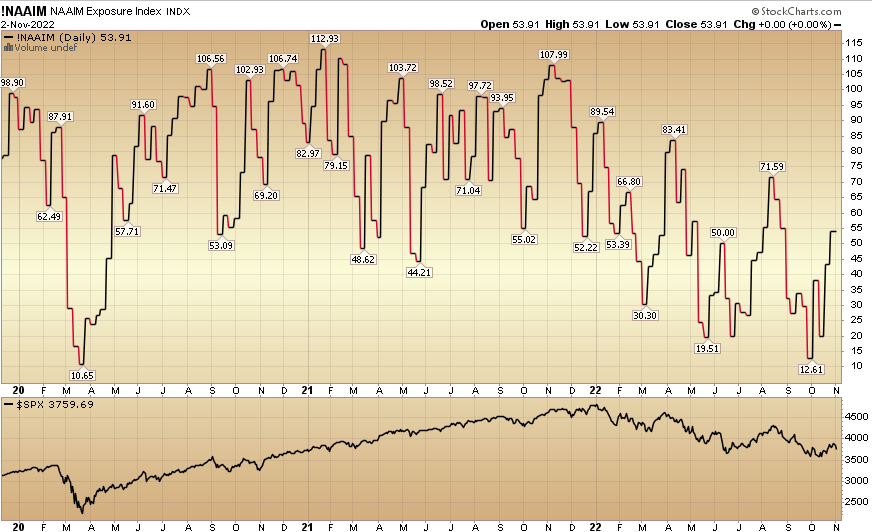
Stockcharts
Author and/or clients may have beneficial holdings in any or all investments mentioned above.
Be the first to comment