

Tempura
Thesis
In our pre-earnings article on STAG Industrial, Inc. (NYSE:STAG) in July, we highlighted that it was close to a Buy. However, we wanted to assess the robustness of its bottoming process first. Therefore, we are pleased to update investors that we believe STAG staged its long-term bottom in July.
As a result, we deduce the recent pullback from its August highs represents a fantastic opportunity for REIT investors to leverage on de-risked entry levels to add exposure.
The company’s Q2 release demonstrated that STAG Industrial observed a near-term impact on acquisitions through H2’22. Furthermore, the increasingly hawkish Fed has also affected its cap rates, narrowing the universe of opportunities available to the company for accretive acquisitions.
Despite that, we believe these headwinds have been adequately reflected in its valuation. Notwithstanding, we need to highlight that the digestion from its 2021 highs is justified, as it was way overvalued, driven by the consumer-driven pandemic boom in e-commerce.
We revise our rating from Hold to Buy and encourage investors to layer in.
STAG’s Premium Valuation Has Been Digested Significantly
STAG valuation metrics (TIKR)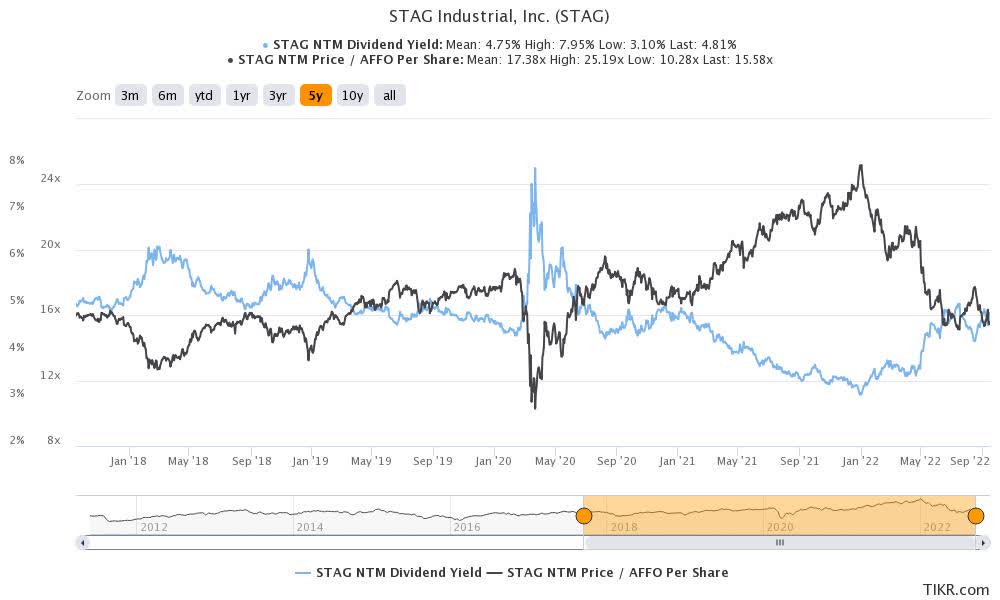
As seen above, STAG’s digestion from its December 2021 highs is justified as it was way overvalued. Given the company’s e-commerce exposure (40% of its portfolio handles e-commerce activity), it also rode the consumer-driven bubble as investors pushed its valuations to unsustainable levels.
At its heights in 2021, STAG traded at an NTM P/AFFO per share of more than 25x, well above its 10Y mean of 17.4x. Moreover, its dividend yield has also improved substantially toward its 10Y mean of 4.75x, as STAG last traded at an NTM dividend yield of 4.8x. Therefore, we are satisfied that the market has de-risked STAG’s valuations substantially to reflect less aggressive entry levels for investors.
STAG’s AFFO Should Bottom Out Moving Forward
Management highlighted that it narrowed its acquisitions volume and increased its cap rates in its Q2 call to reflect the near-term macro uncertainties. However, it also reiterated that it didn’t think these opportunities had disappeared but merely pushed back, given the volatility. Furthermore, internal growth was strong in Q2, as same-store net operating income (NOI) remained robust, undergirding its profitability metrics.
In addition, management highlighted that its tenant credit quality is highly stable, given its focus on single-tenant industrial properties (80%). Management articulated:
That kind of lends itself to larger, more sophisticated tenants. North of 80% of our tenants have revenues greater than $100 million. North of 60% of our tenants have revenues greater than $1 billion. (STAG Industrial FQ2’22 earnings call)
STAG AFFO per share change % consensus estimates (S&P Cap IQ)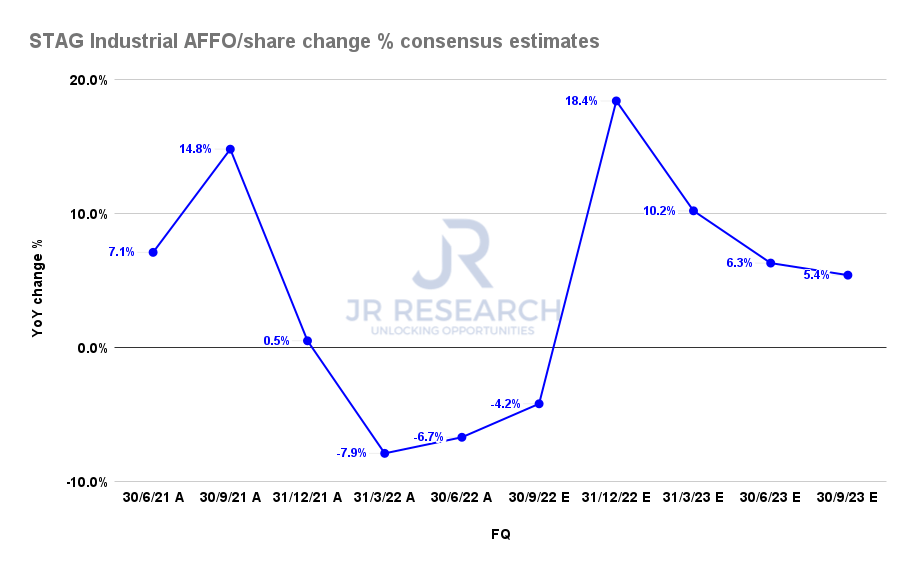
Accordingly, we are confident that the consensus estimates (bullish) seem credible, suggesting its growth could have reached its nadir in Q1/Q2 before recovering through FY23.
Occupancy rates (98.1%) remained robust in Q2, predicated on its total portfolio, despite the worsening macroeconomic stresses. Notwithstanding, we urge investors to continue monitoring its same-store NOI growth and occupancy trends to assess STAG Industrial’s near-term challenges. However, we evaluated that its de-risked valuations have likely reflected these headwinds.
Is STAG Stock A Buy, Sell, Or Hold?
STAG AFFO per share and Dividend per share consensus estimates (S&P Cap IQ)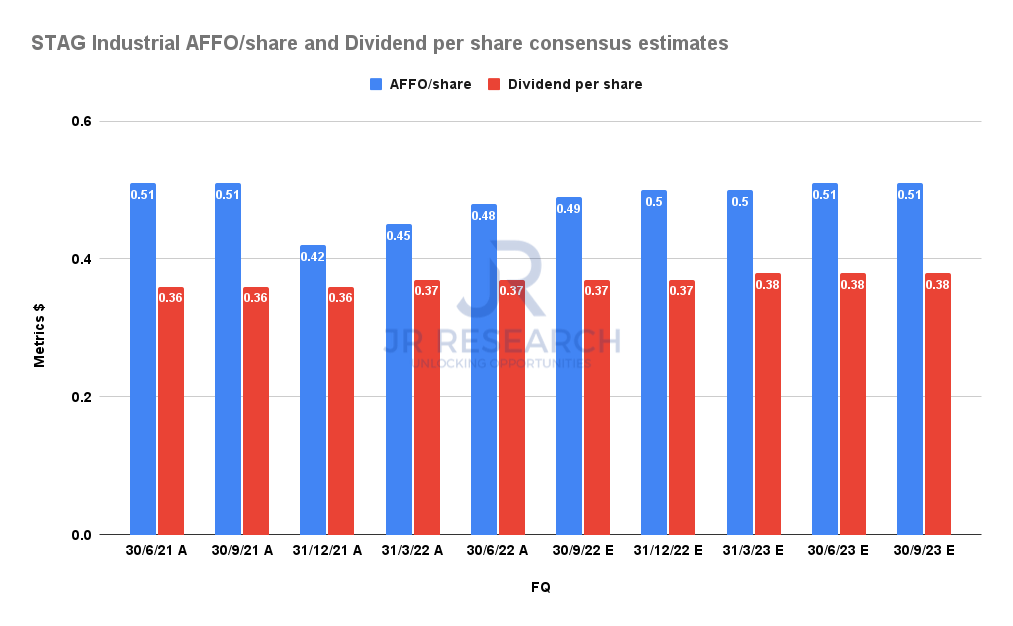
Management maintained its dividend payout for Q3, despite the worsening macroeconomic uncertainties. Furthermore, its payout ratio remains relatively low (77% of AFFO per share), providing clear visibility for income investors.
With the likely improvement of its AFFO moving forward, we believe accretive acquisitions could further lift the potential for its dividend payouts. However, the macro headwinds should continue to put a lid on any marked increase, given management’s prudence.
STAG Industrial NTM Dividend yield % consensus estimates (S&P Cap IQ)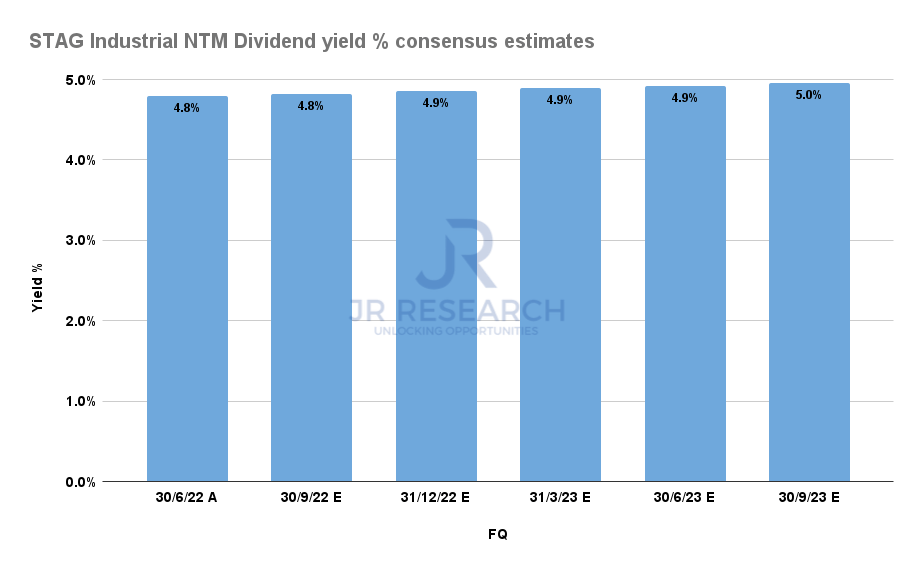
Therefore, we are confident that its NTM dividend yield of 4.9% is robust and should continue to undergird its current valuation. Management could undoubtedly be more aggressive with its payout. However, we believe the current cadence is appropriate and reflects its near-term uncertainties.
STAG price chart (monthly) (TradingView)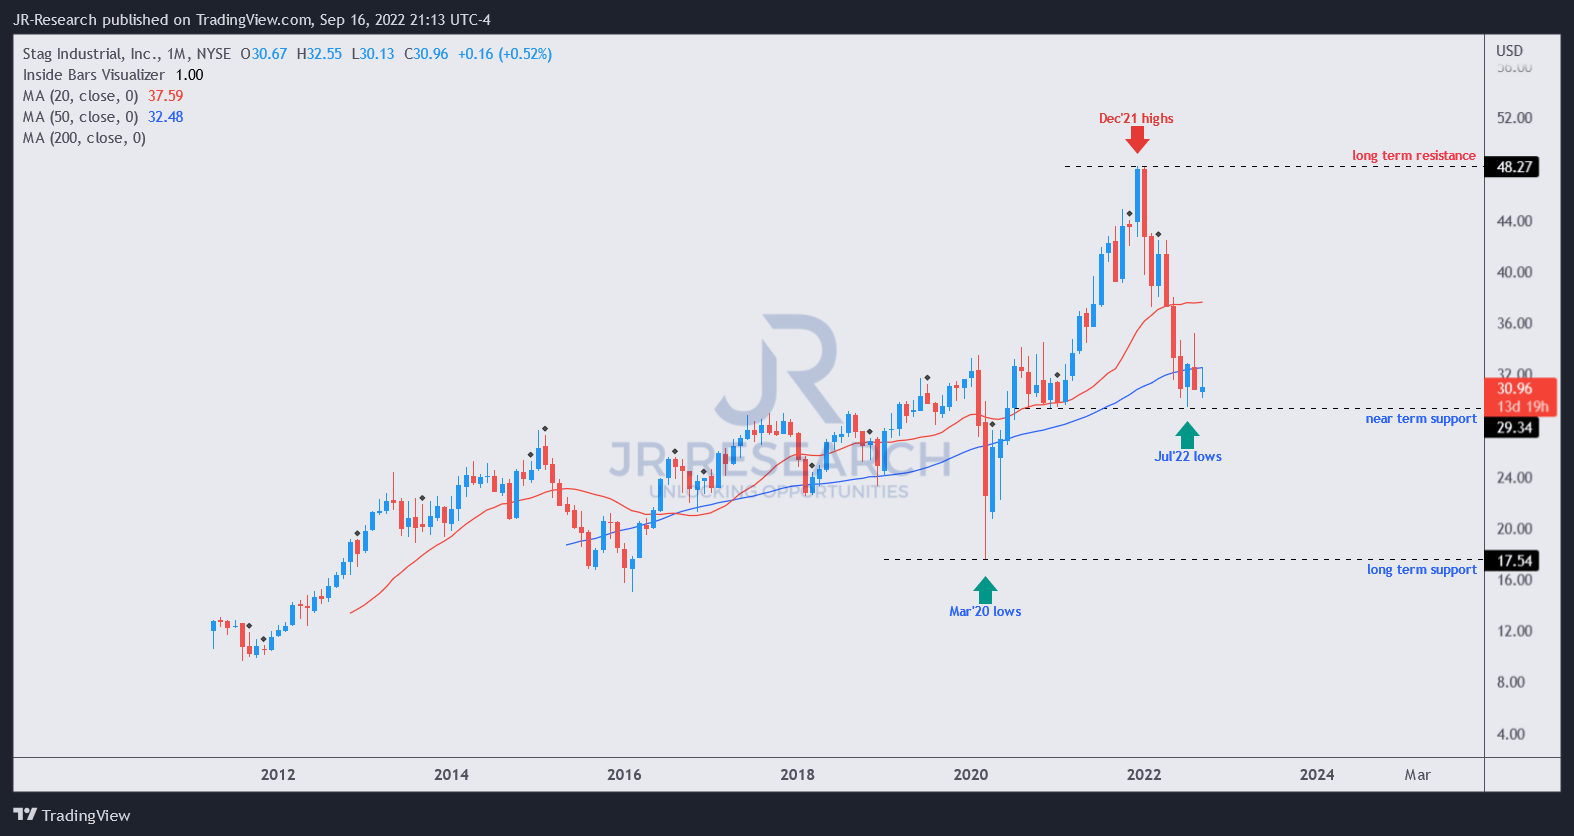
We also gleaned that STAG was robustly supported at its July lows as it closed in on its 50-month moving average (blue line). It has supported STAG’s long-term uptrend robustly over time.
Therefore, we deduce that the bottoming process is credible and view the recent pullback as an opportunity for investors to consider adding more positions.
As such, we revise our rating on STAG from Hold to Buy.
Be the first to comment