

MBPROJEKT_Maciej_Bledowski/iStock Editorial via Getty Images
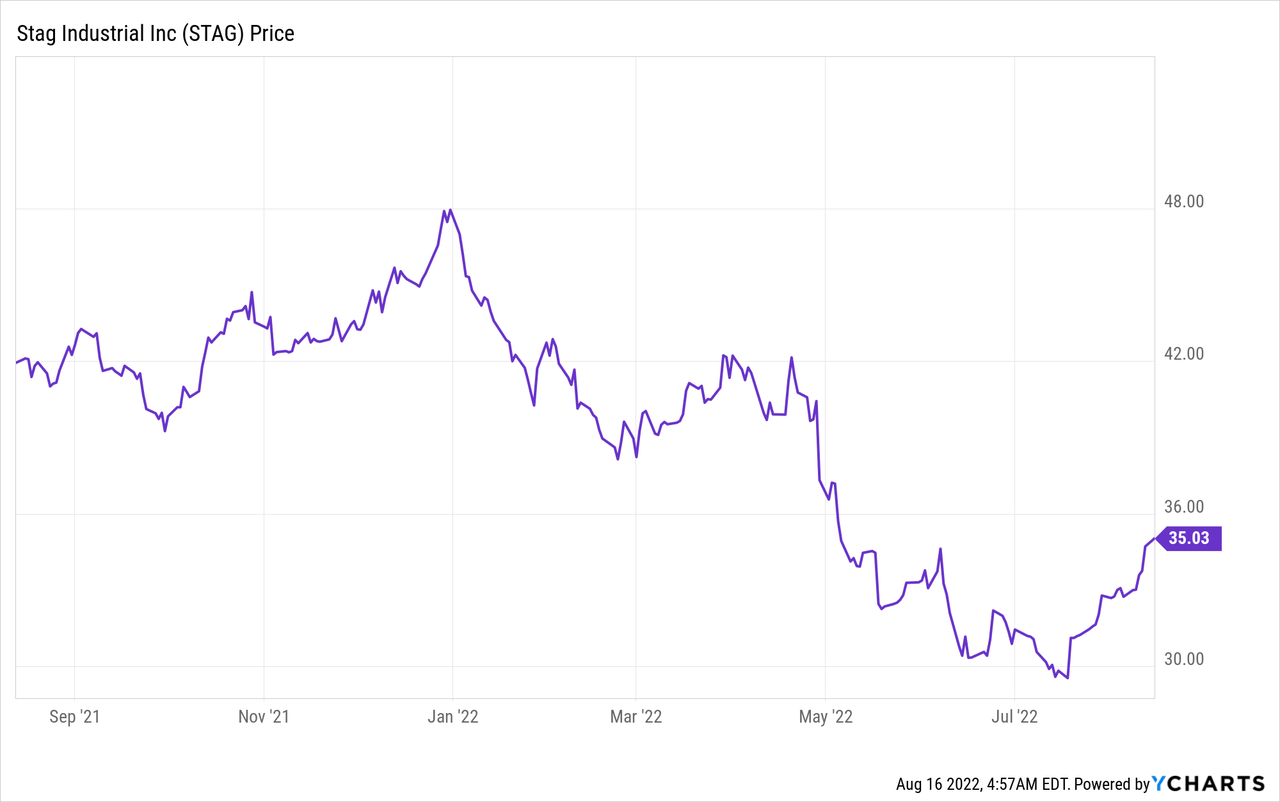
STAG Industrial (NYSE:STAG) is a pure play industrial REIT. It has a portfolio of properties which are widely diversified across tenants, states, industry and lease maturity. The industrial REIT is also poised to benefit from the growth in ecommerce and the importance of a smooth supply chain, which has become prevalent in the news recently. The REIT also acts as an Inflation hedge, given property values have historically risen with inflation. Given all these tailwinds, it was a surprise to see the stock price had plummeted by ~34% between the end of 2021 and mid-July 2022. More recently the stock price has popped by 17% but is still fairly valued relative to the sector and undervalued relative to other industrial REITs. In this report, I’m going to dive into the business model, financials and valuation for the juicy details, let’s do it.
Industrial Business Model
STAG owns, operates and acquires Industrial Real Estate across the United States of America. Since its IPO in 2011 the company has grown the number of Square Feet it owns from 14.2 million to 111.5 million. This was driven by the company’s aggressive acquisition strategy as they have over 5X’d the properties owned from 93 in 2011 to 559 as of the second quarter 2022.
IPO to Q2 ’22 (Earnings Presentation)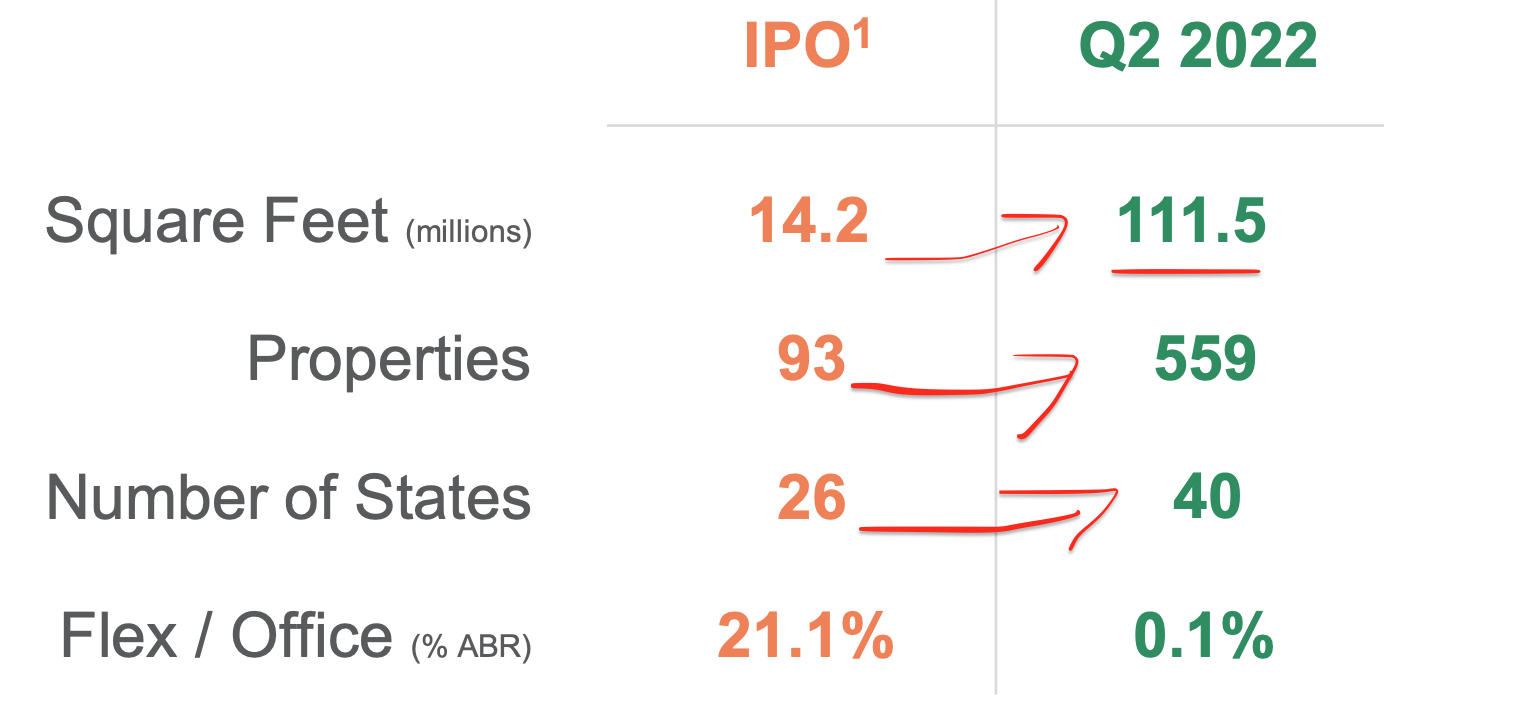
The REIT has also expanded across U.S. states from 26 to 40 and is now well diversified geographically. Its tenant base is also well diversified across 45 industries and the largest tenant, Amazon (AMZN), makes up just 3.1% of Annual Base Rent collected. Other tenants include; Eastern Metal Supply, Inc. (1%), FedEx (FDX) (0.9%), Kenco Logistics (0.8%) and even book publisher (Penguin Random House) (0.7%).
Tenants (Q2 Presentation)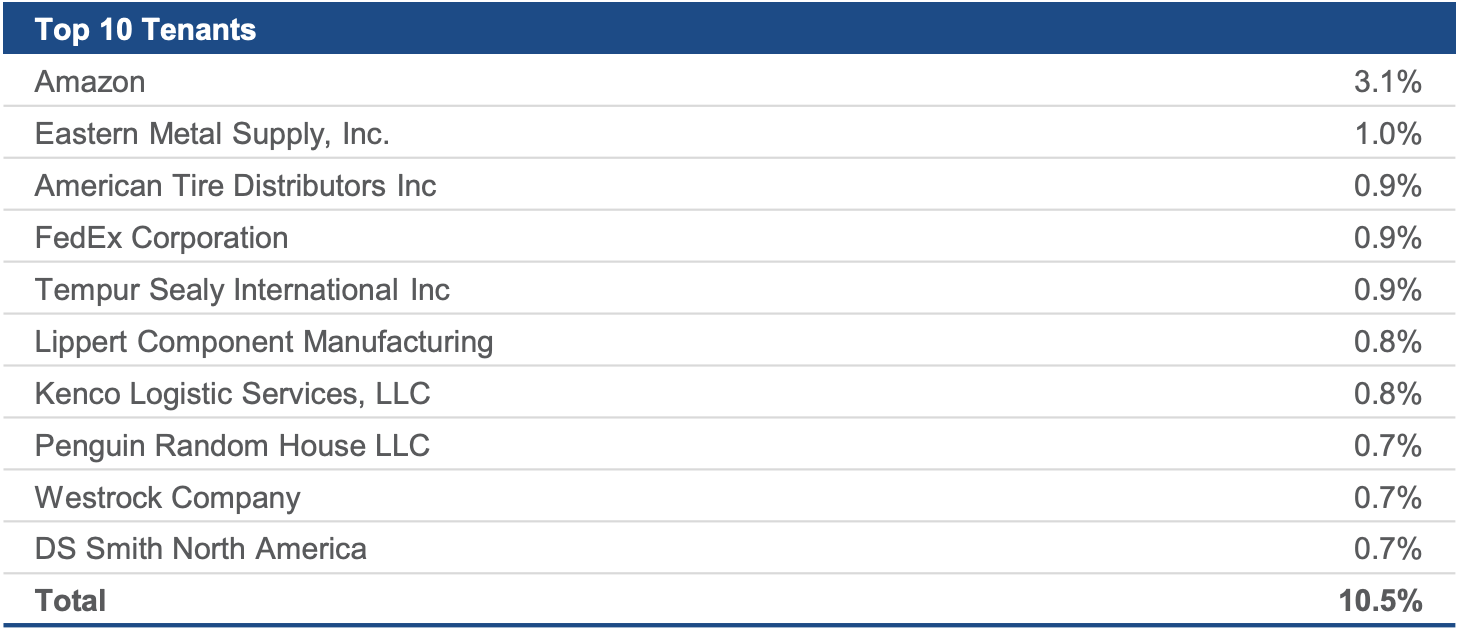
The majority of the REIT’s tenants also generate large revenues, with 83% of tenants having revenue of greater than $100 million and 59% having revenue of over $1 billion. 54% of its tenants are also publicly traded, which means the likelihood of defaulted on rent is minimized as these companies can raise capital from the public markets easily.
Tenant Revenue Exposure (Q2 Presentation)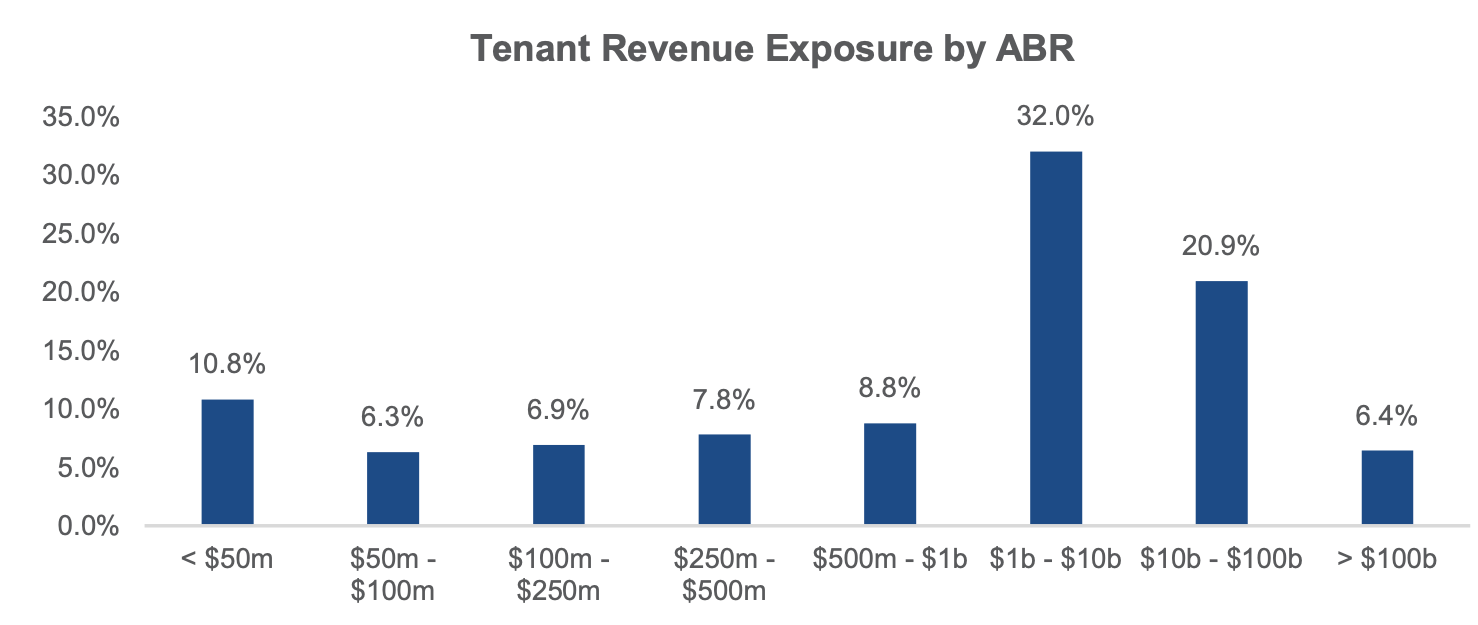
As mentioned prior, the company has grown via an aggressive acquisition strategy. The established REIT benefits from relationships with industrial Real Estate Brokers, which can give them a first look at deals on the market. These brokers will also love the institutional standing of STAG (being publicly traded) and can be rest assured the deal will close with more certainty. Management is very active in these acquisitions and is continuously analyzing deals. For instance, in 2021, STAG had over 1,250 deals pass its first stage of investment consideration. However, only 62 or 5% of these deals were closed, which shows a disciplined approach to investment. STAG doesn’t just acquire “vanilla” properties it looks for areas where it can add value at the asset level, this could be through development work, changing tenants and even creating multiple sites, examples below.
STAG Add Value (Q2 Presentation)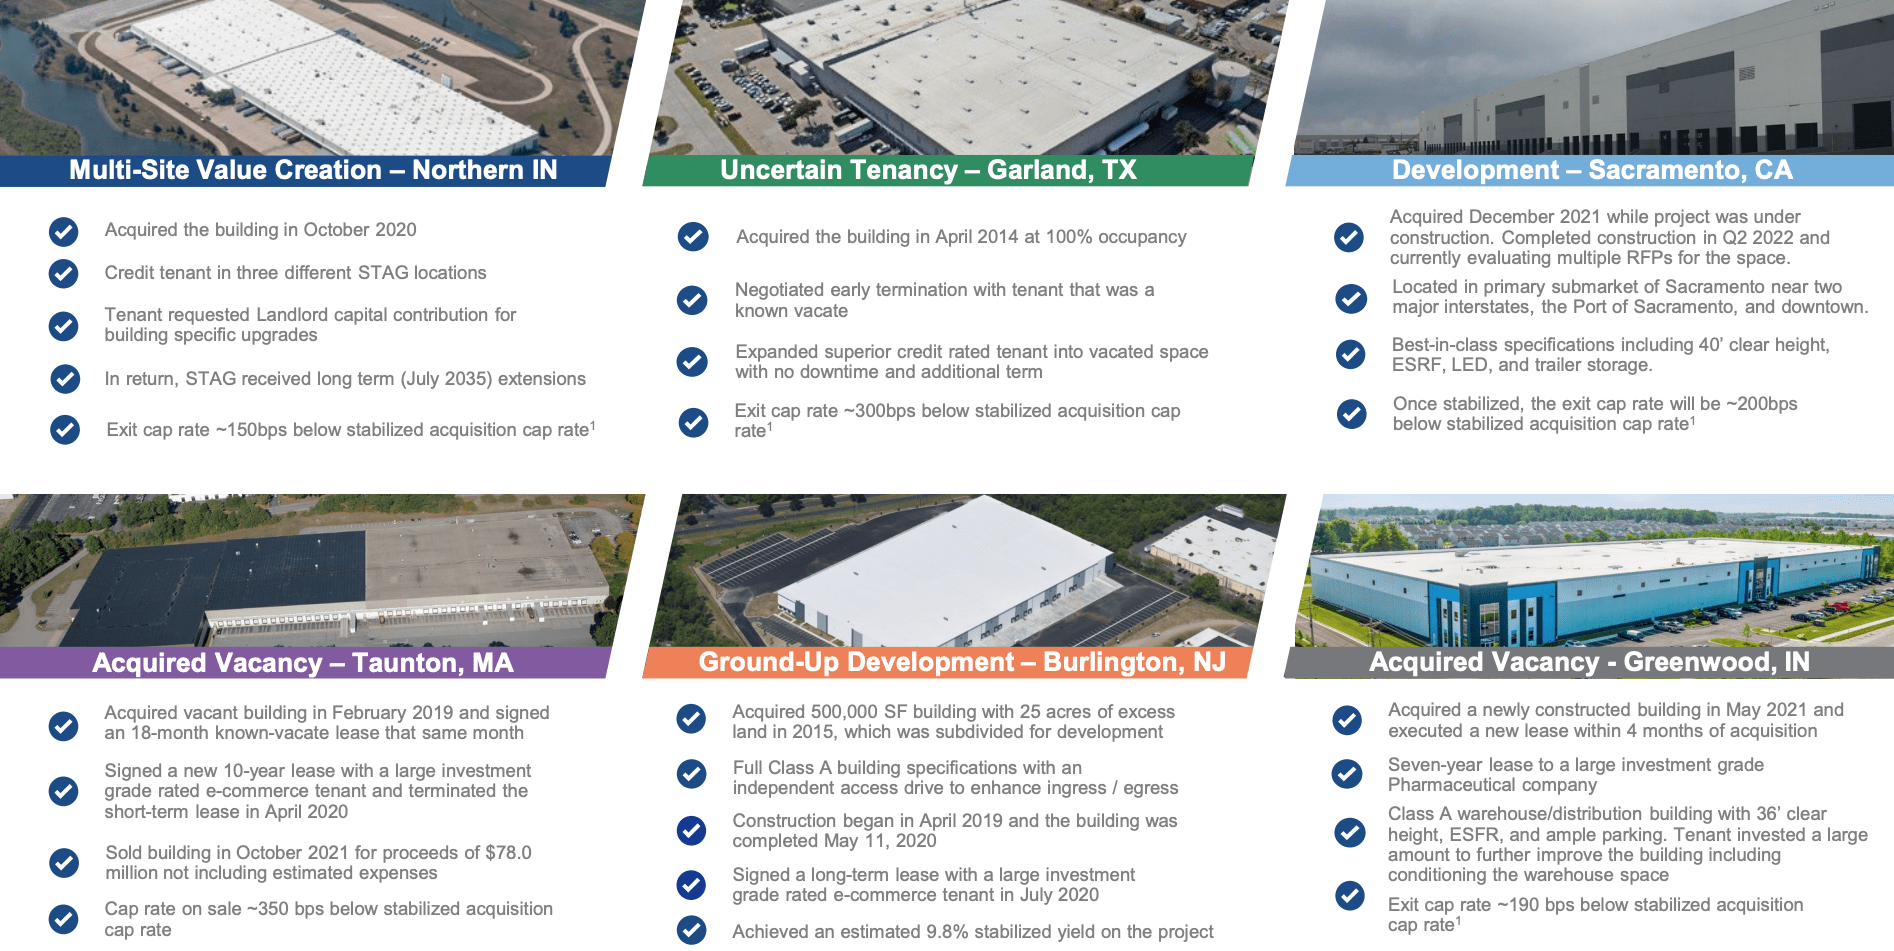
STAG also smartly leverages its vast roof space to install Solar Panels, which is a brilliant idea for a number of reasons. Firstly, this energy can be used to supply tenants or the grid with power and thus act as an extra income source. In addition, it’s great for ESG and could help STAG to receive more inflows from ESG funds and portfolios as a result. STAG currently has twelve installations totaling 25.5 MW. An extra four projects are in progress in 2022 with a total capacity of 2.6 MW. In addition, its team is evaluating 40 solar projects for the next several years, which have the potential to double the existing capacity.
STAG has also installed reflective roofing across nearly half (48.5%) of its portfolio to lower warehouse temperature and energy usage. 90% of its portfolio has energy-efficient lighting systems with Fluorescent or LED lighting installed, with more LED being added over time. Again, more energy-efficient lighting will lower energy costs.
Second Quarter Financials
STAG generated strong financials for the second quarter of 2022. Core FFO (Funds from Operations) per share was $0.56, up 7.7% year over year. This growth was driven by solid same-store NOI (net operating income) of $105.4 million, up 4% year over year. Cash NOI was $129 million, up a blistering 18.6% year over year. Adjusted EBITDA also popped by 20.7% to $119.5 million.
STAG Financials (Q2 Earnings Report)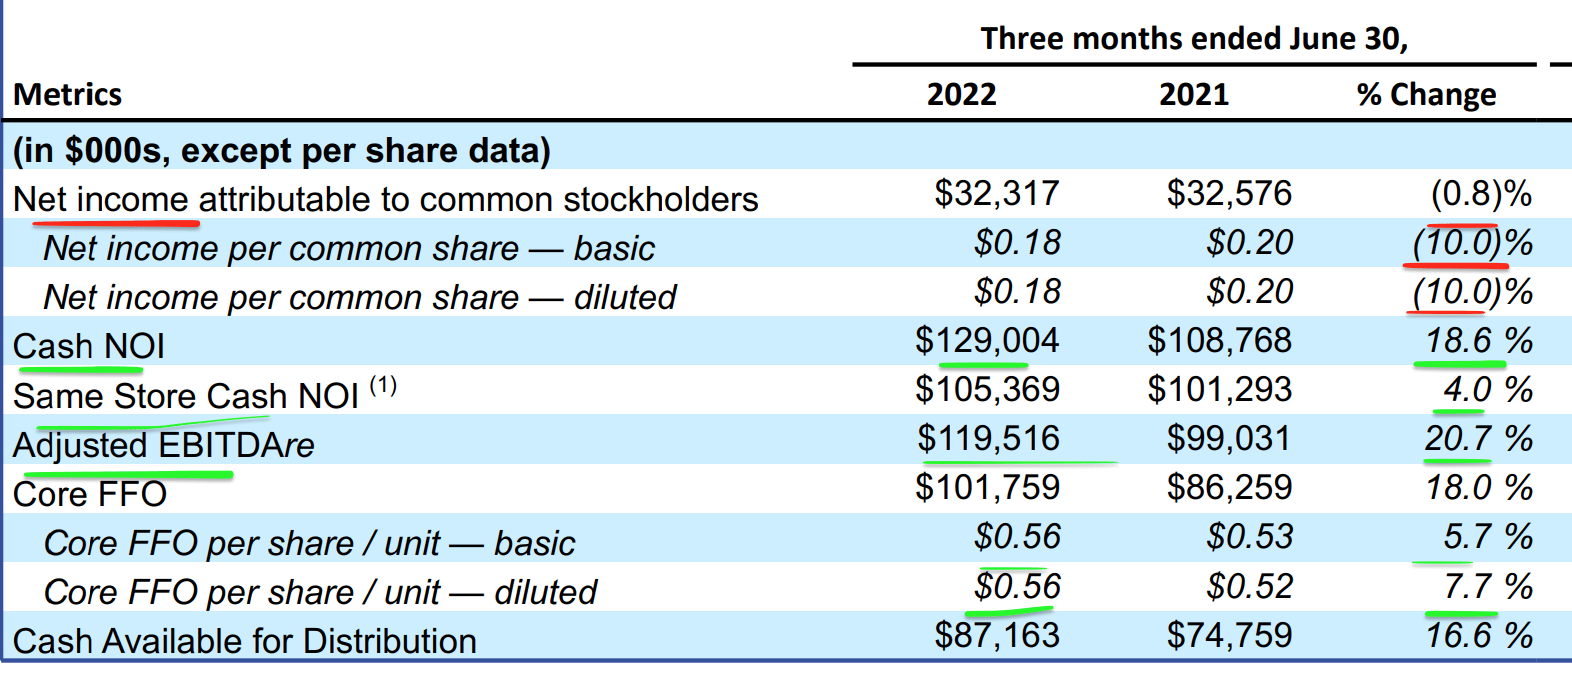
The only red flag was a 0.8% decline in Net Income, but I don’t deem this to be a major issue given strong NOI and FFO, which are the key metrics for a REIT.
The company’s acquisition volume was $165.4 million in the second quarter and consisted of 9 buildings with stable cash flow and a healthy cash cap rate of 5.2%. The “Cap Rate” is defined as the annual NOI divided by the market value of the property. Basically, this gives you the net “yield” over a one-year time horizon. From my experience, investing into real estate >5% is very good, especially for large industrial properties with established tenants.
The REIT’s overall Occupancy Rate was a high 98.1%, which means the majority of its buildings are occupied, which is a positive sign.
STAG generated $87.2 million in cash available for distribution, which was up 16.6% year over year. Its balance sheet is strong, with $5.7 billion in common equity value and $2.391 billion in unsecured debt.
Balance Sheet (Q2 Earnings Report)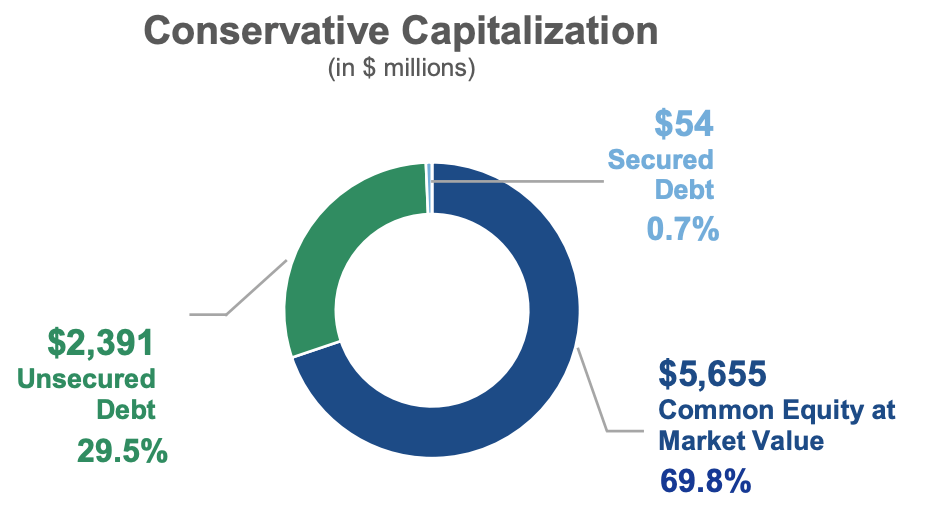
Given the rising interest rate environment, it was fantastic to see the majority (95.3%) of its debt is at a fixed interest rate. Therefore, a large spike in debt servicing costs is unlikely.
Balance Sheet Debt (Q2 Presentation)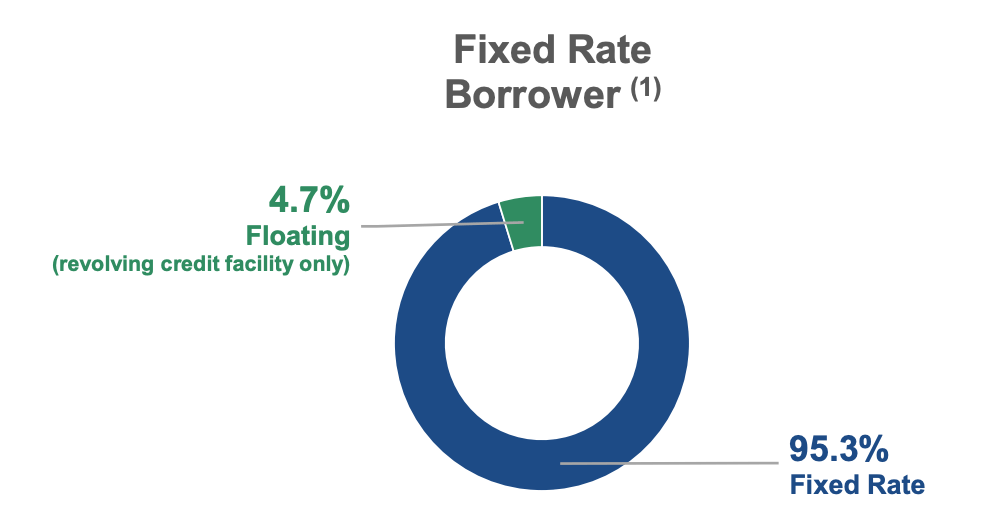
STAG pays a healthy Dividend Yield (FWD) of 4.21%, and they have grown this dividend consistently over the last 10 years.
Dividend (Q2 Earnings)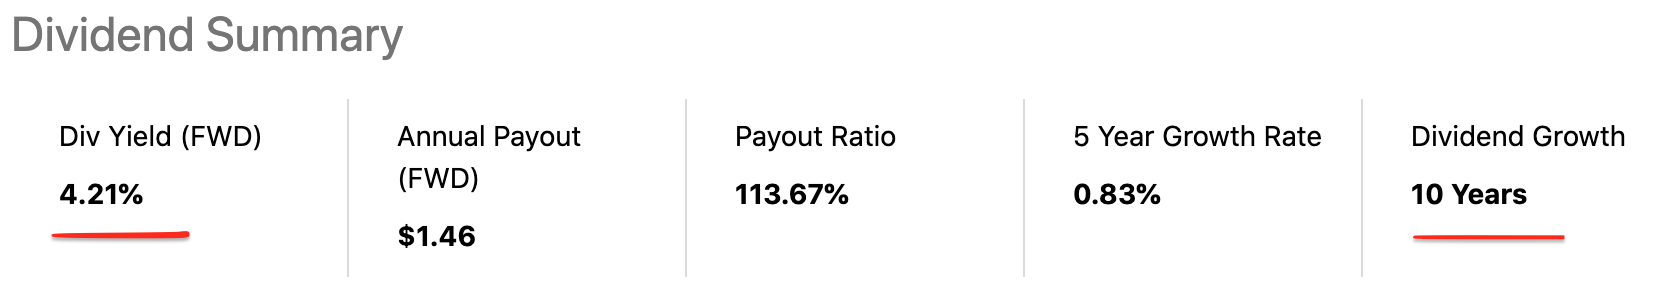
Valuation
A simple measure of valuation for a REIT is to look at the Price to Funds From Operations. In this case, STAG has a P/FFO (FWD) ratio = 15.88 which is average relative to the sector. Therefore, the stock looks to be “fairly valued” at the time of writing.
Valuation (Seeking Alpha)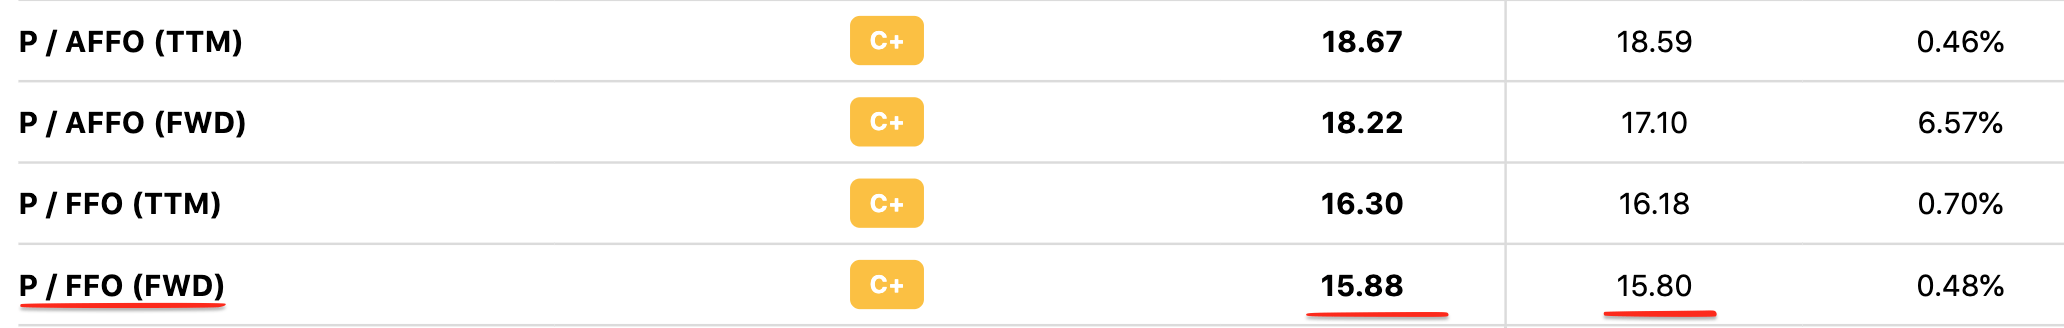
As an extra datapoint, I have compiled together this table of REITs in the industrial sector. STAG is the second cheapest on this list. IIPR is slightly cheaper with a P/FFO (FWD) = 12.83, but this is in the Regulated Cannabis industry, and thus it makes sense that it would trade at a lower valuation.
REIT Valuation 2 (Created by author Ben at Motivation 2 Invest)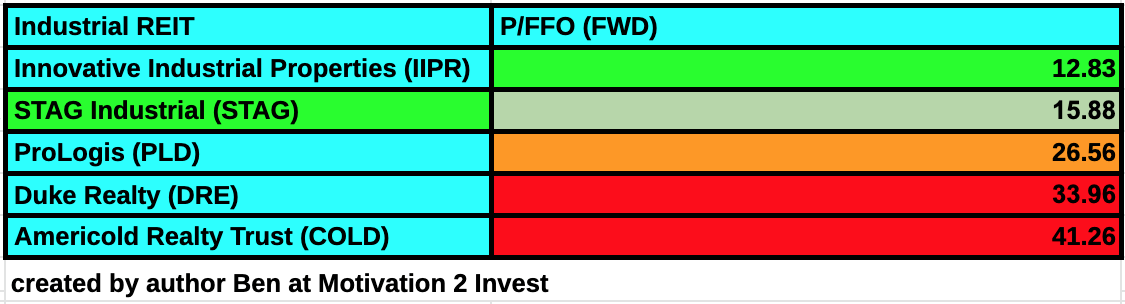
Risks
Recession
The high inflation and rising interest rate environment has caused many analysts to forecast a recession. Both consumers and businesses are seeing input costs squeezed and thus this may result in more tenant defaults or less new lease sign-ups.
Final Thoughts
STAG Industrial is a fantastic REIT which is diversified across industries, tenants and states. Management’s aggressive acquisition strategy is working so far, and the REIT is fairly valued relative to the general sector and undervalued relative to a selection of industrial-focused REITs. Therefore, this stock looks to be a great one for the long-term investor.
Be the first to comment