

Maria Vonotna
Thesis
Leading Industrial REIT STAG Industrial, Inc. (NYSE:STAG) stock has been battered since its December 2021 highs, having declined almost 40% as of July 15’s close. Given its exposure to macroeconomic headwinds, investors shouldn’t be surprised.
Therefore, investors in Industrial REITs are encouraged to pay attention to the cyclicality of their AFFO per share growth, which macro headwinds could impact. Also, investors are urged to pay close attention to price structures, as they could lend helpful insights into the market’s forward intentions.
Our price action analysis indicates that the market formed a double top bull trap (significant rejection of buying momentum) in December 2021. Therefore, it provided early warning signals to investors to cut exposure before the slaughter followed.
Notwithstanding, we believe STAG is likely at a near-term bottom. However, we don’t encourage investors to add exposure until they observe a sustained base. Furthermore, given STAG Industrial’s deceleration in growth moving forward, we believe its valuation is more well-balanced but not undervalued.
Accordingly, we rate STAG as a Hold for now.
Macro Headwinds Are Causing AFFO Per Share Uncertainties
STAG investors must consider macroeconomic headwinds in their modeling, given the exposure of its underlying operating model. STAG Industrial also cautioned in its filings (edited):
Income from and the value of our properties may be adversely affected by a global economic crisis, including periods of economic slowdown or recession, rising interest rates, or declining demand for real estate. Our operating results and financial condition could be negatively affected to the extent that an economic slowdown or downturn is prolonged or becomes more severe. (STAG Industrial FQ1’22 10-Q)
STAG Industrial revenue change % and AFFO/share change % consensus estimates (S&P Cap IQ)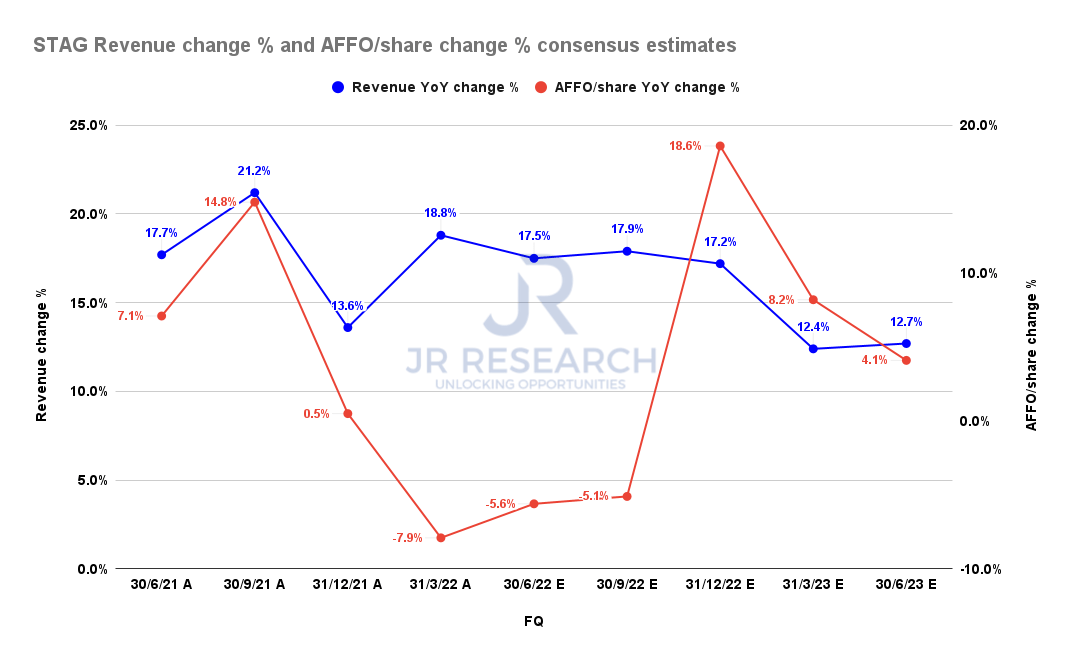
The consensus estimates (bullish) indicate a marked decline in its AFFO per share growth through FQ3’22, as seen above. STAG is projected to post an AFFO per share growth of -5.1% in FQ3 before recovering from its nadir.
Therefore, we believe the Street is not modeling a prolonged recessionary scenario that could impact STAG’s AFFO per share recovery cadence.
STAG Industrial revenue change % and AFFO/share change % consensus estimates (By FY) (S&P Cap IQ)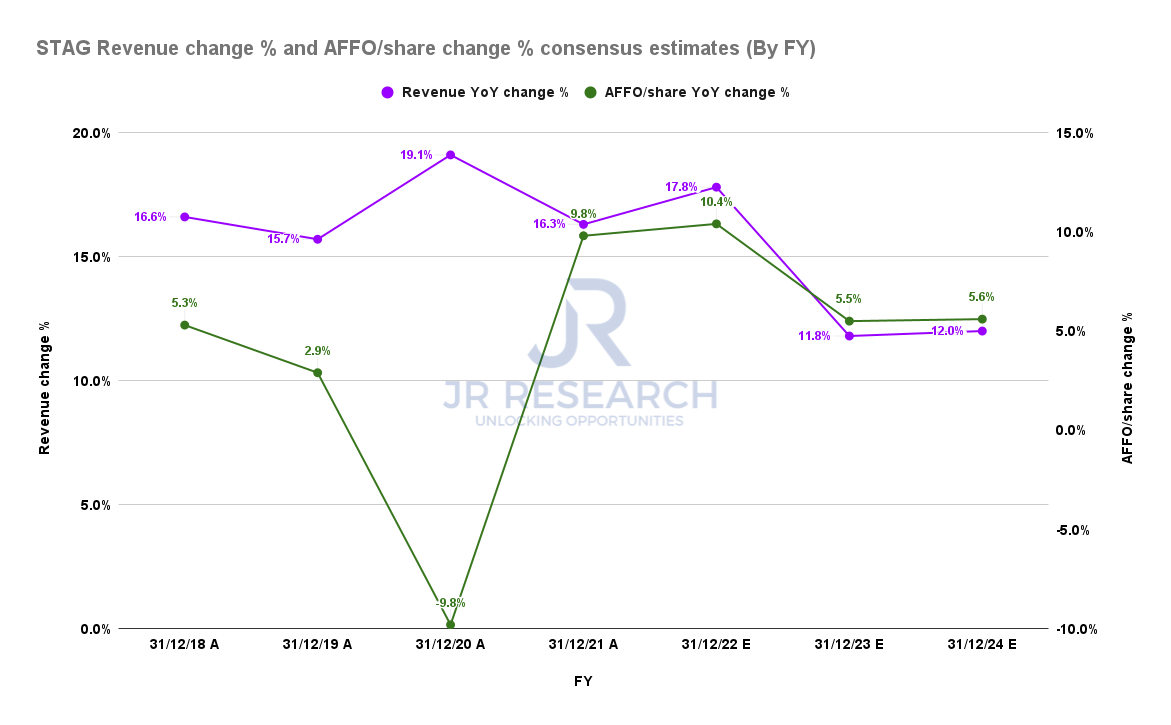
On an FY basis, STAG Industrial’s revenue growth and AFFO per share growth are also projected to normalize through FY24. Notably, STAG is estimated to post revenue growth of 12% in FY24. As a result, we believe even the bullish Street analysts are modeling for a marked weakening in its forward topline performance.
Notably, it’s markedly lower than STAG’s 5Y and 10Y revenue CAGR of 17.6% and 27.7%, respectively. Consequently, its AFFO per share performance is also expected to be impacted moving ahead.
STAG’s Slower Growth Calls For A Larger Margin Of Safety
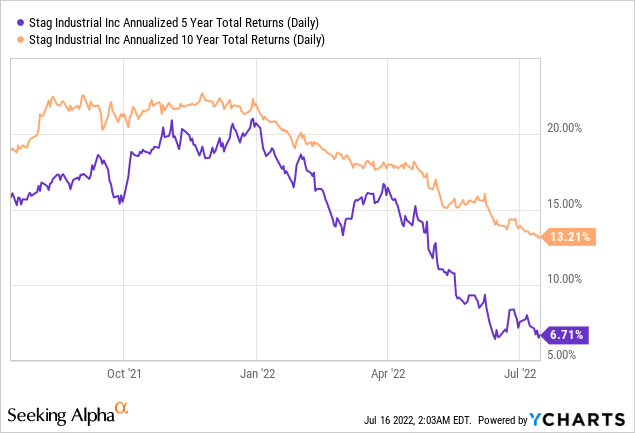
As seen above, STAG delivered a 5Y and 10Y total return CAGR of 6.71% and 13.21% (adjusted for dividends), respectively. We believe the market has priced its revenue growth performance accordingly. Therefore, with a marked deceleration in its topline growth moving ahead, investors should be prepared to ask for a larger margin of safety as compared to its historical valuation metrics.
STAG valuation metrics (TIKR)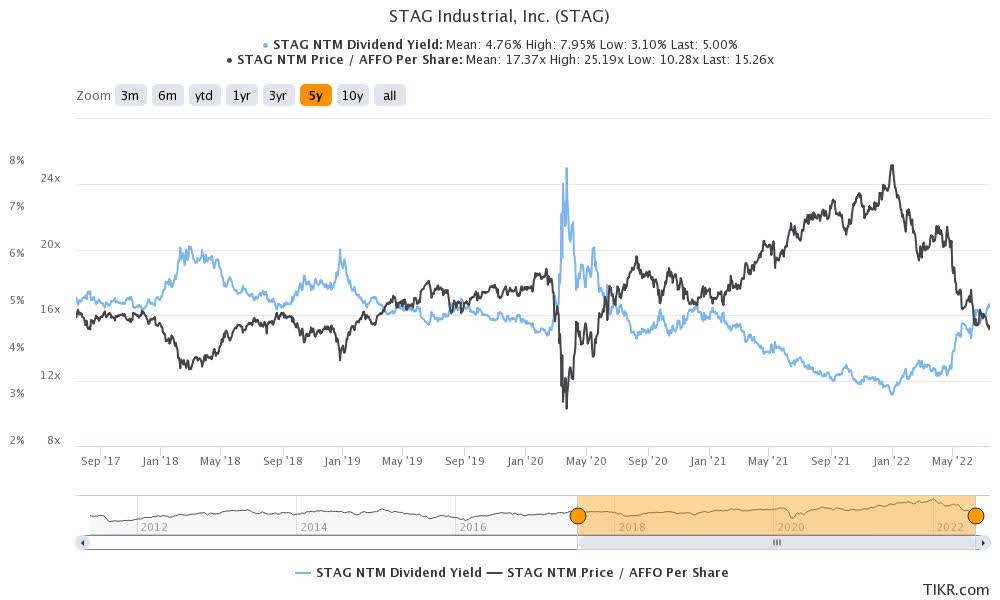
As seen above, STAG last traded at a P/AFFO per share of 15.26x, 12% below its 5Y mean of 17.37x. Therefore, we believe the market has justifiably adjusted for its weaker expected performance over the next few years astutely.
But, the critical question is whether the adjustment has been sufficient. For instance, STAG traded at a P/AFFO per share of as low as 10.28x at its March 2020 bottom. In the December 2018 bear market, STAG also fell to a P/AFFO per share of 13.24x.
As a result, we believe the market could continue to batter STAG if the macroeconomic conditions are expected to deteriorate further, as its valuation still seems slightly elevated. Hence, we don’t think the margin of safety is sufficient at the current levels.
STAG – Price Action Needs To Be More Constructive
STAG price chart (monthly) (TradingView)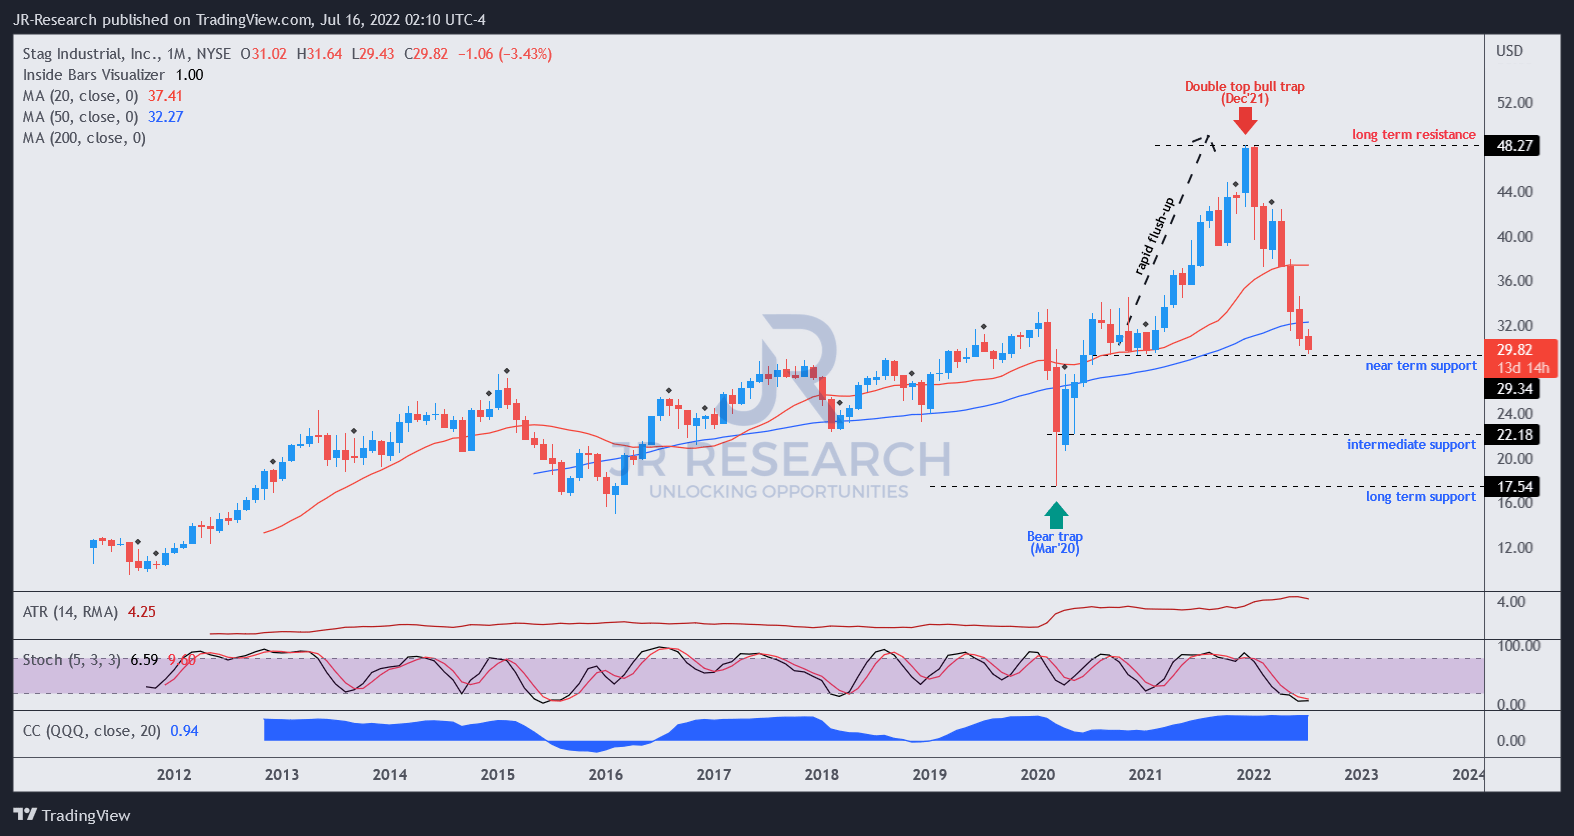
Notwithstanding, we believe STAG is likely at a near-term bottom. Its technicals on its short-, medium- and long-term charts are oversold. Furthermore, it last traded close to its near-term support of $29.34.
Also, STAG has a remarkable long-term uptrend that has consistently attracted long-term dip buyers at its critical support levels.
Notwithstanding, we also noted that STAG had shown tendencies to react to the downside to force capitulation before reversing back up. Therefore, we urge investors to wait for a constructive price structure to discern the market’s intentions on STAG before adding exposure.
Is STAG A Buy, Sell, Or Hold?
We rate STAG as a Hold for now.
We believe that its valuation is more well-balanced now but not undervalued. If the macro headwinds intensify, it could send STAG into a steeper sell-off.
STAG is likely at a near-term bottom, and its technicals are oversold across all critical timeframes. However, we urge investors to await more constructive price action before considering adding exposure.
Be the first to comment