

Getty Images/Getty Images News
Thesis
The tobacco sector has faced major pressure lately. Since they reported their Q1 results about three months ago, two of the major bellwether stocks in the sector have lagged the overall market by a good margin as you can see from the following chart. To wit, Altria (NYSE:MO) suffered a total loss of more than 14% in the past three months and Philip Morris (NYSE:PM) suffered a total loss of more than 9.5%. In contrast, the broader market stayed flat (actually posting a small 0.4% total gain during the same period).
Seeking Alpha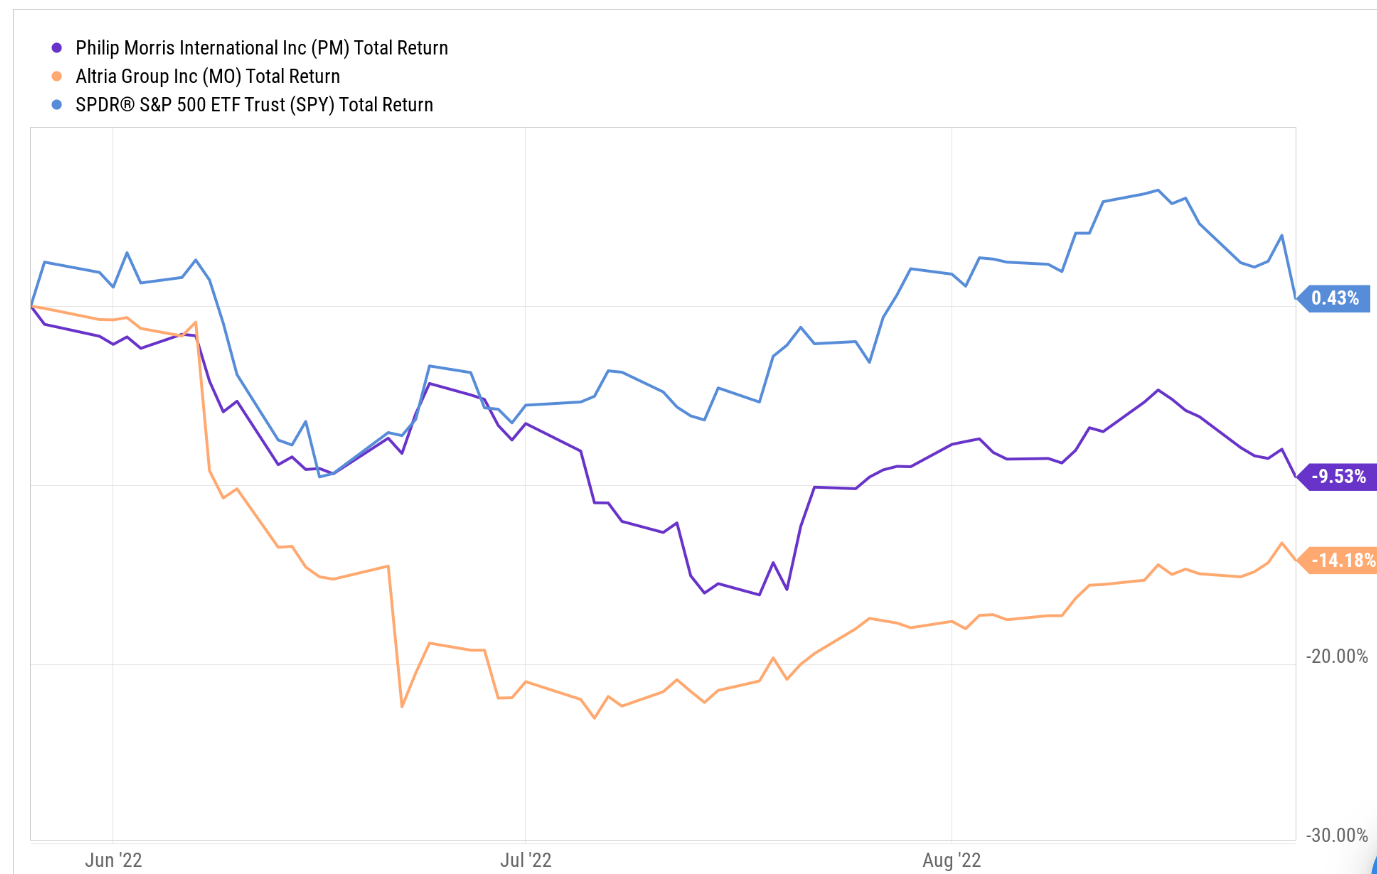
Of course, there are good reasons for the pressure on the sector and also on these leading stocks. The sector has been dealing with the secular demand decline on their traditional cigarette products for decades. As you can see from the following chart, the decline continues as we speak now.
MO reported a 4.5% decline in its smokable segment in Q1 2022 and another 10% in Q2, translating into a 9% decline in 1H of 2022. The picture of the whole industry is quite similar. The whole sector reported a 5% decline in total demand during Q1 2022 and another 8.5% in Q2, translating into a 7.5% decline in 1H of 2022.
MO 2022 Q2 earnings report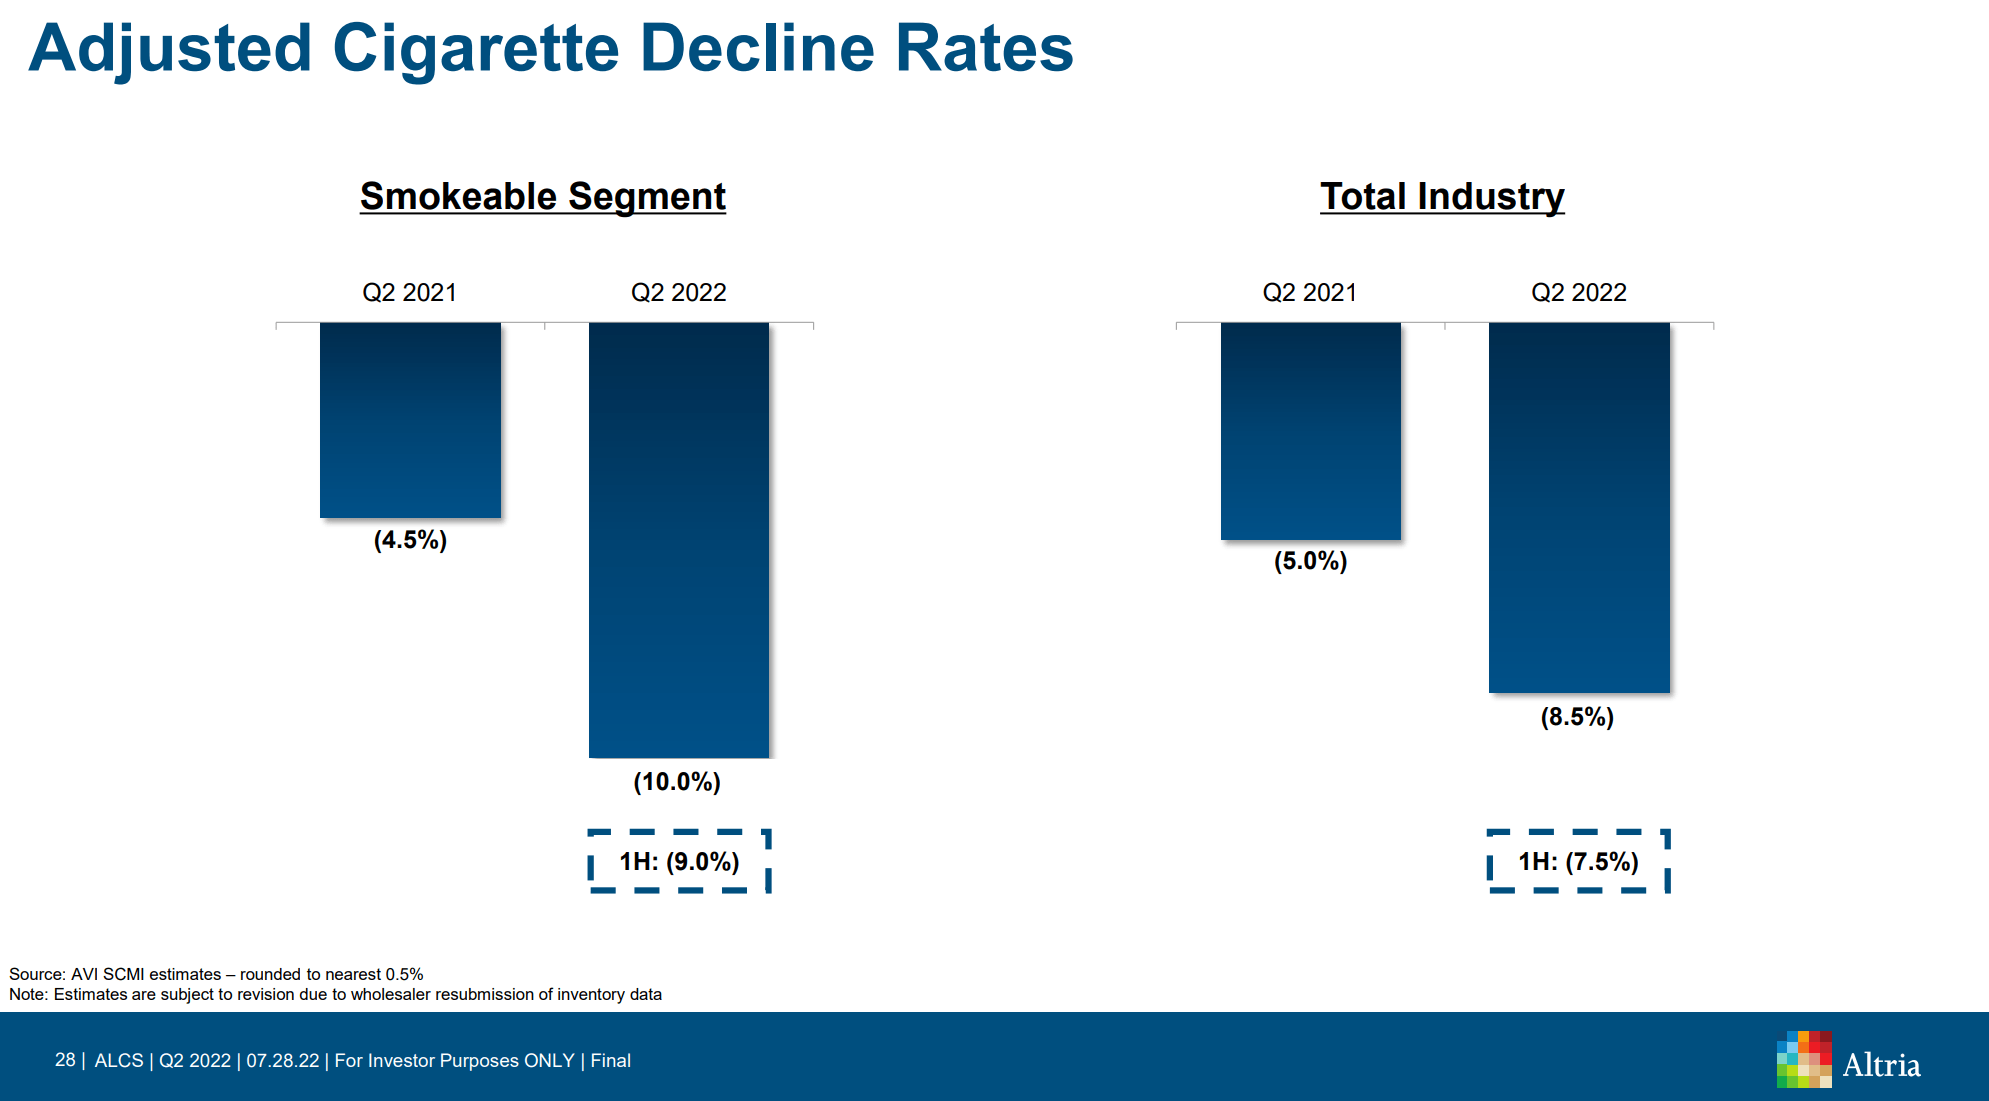
Against this overall backdrop, MO is facing some additional problems, especially on the regulatory front. The U.S. FDA recently announced its plans to ban JUUL from selling its e-cigarettes in the United States. As a result, MO’s JUUL investment has pretty much all vaporized (pun intended). The JUUL investment was acquired around 2018-2019 for $13B, and management now values it only at $450M as of Q2 2022. To make things even worse, the FDA gave the okay for rival British American Tobacco’s (BTI) Vuse e-cigarette, putting MO at a further disadvantageous position in this future segment.
Because of all these problems, some MO investors are beginning to think about the unthinkable – the possibility of a dividend cut. After all, MO is one of the quintessential examples of dividend growth stocks. It has been growing its dividend consecutively for more than 53 years.
Therefore, it is the goal of this article to assess such a possibility. And I will perform a holistic assessment of its dividend safety beyond the common payout ratios. The assessment will consider its cash flow, debt obligations, current cash position, and CAPEX expenses holistically. And you will see from the results that its dividend is still at a very safe level. For better or worse, the JUUL investment never helped or hurt its dividend safety.
To provide more insights and context, a side-by-side analysis will also be performed on PM. And this comparison really helps to elucidate the fundamental reasons for the safety and resilience of the sector: their strong cash flow, extremely light CAPEX requirements, and pricing power.
PM vs MO: dividend safety in focus
The next two charts below show MO and PM’s dividend payouts ratios in term of earnings and also cash flow. As long-term dividend payers, both PM and MO have been doing a consistent job of managing their dividend payouts as seen.
In terms of earnings payout ratios, PM’s long-term average is 89% and MO’s is 68%. And note the consistency here. The payout ratio for PM has oscillated around the mean with little variance most of the time over the past decade, and its current payout ratio of 88% is essentially on par with the mean. MO has demonstrated similar consistency except during 2016 and 2017 when its payout ratio deviated from the mean substantially – but in the good (i.e., lower) direction. Its current payout ratios are about 75%, slightly above the mean but squarely in the normal range of random fluctuations.
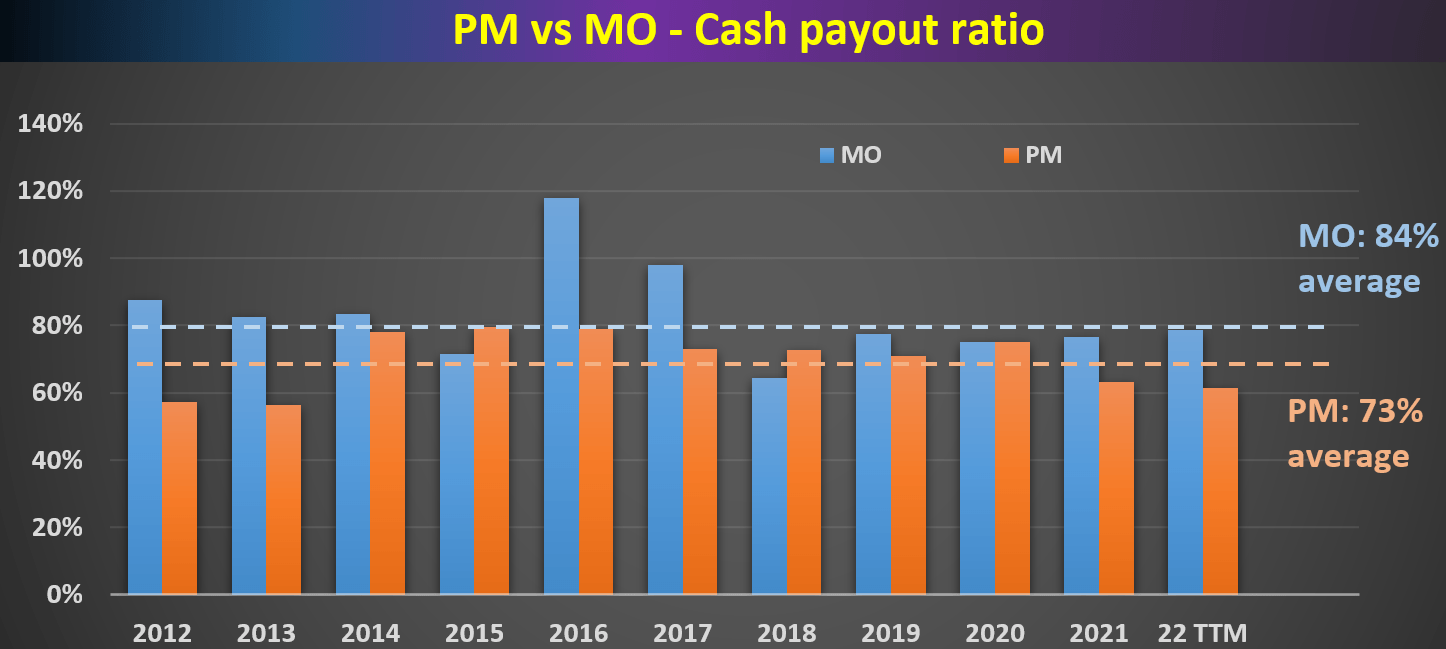
In terms of cash payout ratios, the picture is quite similar. PM’s long-term average is 73% and MO’s is 84%. In this metric, PM’s current ratio of 62% is slightly below the mean by about 11%. And MO’s current payout ratio of 79% is slightly below the long-term mean by about 5%. And again, the deviations are squarely within the normal range of fluctuations, and the deviation is in the good (lower) direction.
Next, we will go beyond such a simple payout ratio and consider their dividend safety holistically together with other factors such as cash position, debt, and CAPEX.
Author Author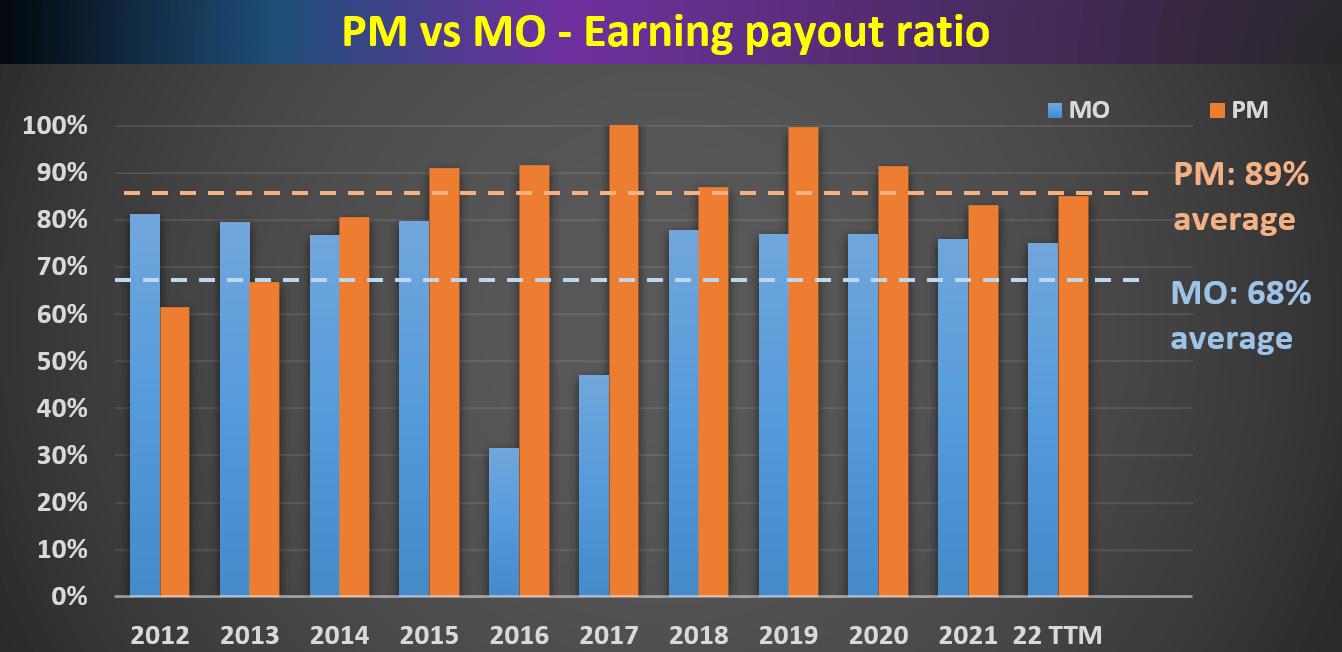
PM vs MO: dividend cushion ratios
As detailed in my earlier article here, the major limitations of the above simple payout ratios are twofold:
- The simple payout ratio ignores the current asset that a firm has on its balance sheet. Obviously, for two firms with the same earning power, the one with more cash sitting on its balance sheet should have a higher level of dividend safety.
- The simple payout ratio also ignores the upcoming financial obligations. Again, obviously, for two firms with the same earning power, the one with a lower level of obligations (pension, debt, CAPEX expenses, et al) should have a higher level of dividend safety.
The above simple payout ratios ignore all these important pieces. For a more advanced analysis of dividends stocks, we find the so-called dividend cushion ratio an effective tool. A detailed description of the concept can be found in Brian M Nelson’s book entitled Value Trap. And a brief summary is quoted below:
The Dividend Cushion measure is a ratio that sums the existing net cash (total cash less total long-term debt) a company has on hand (on its balance sheet) plus its expected future free cash flows (cash from operations less all capital expenditures) over the next five years and divides that sum by future expected cash dividends (including expected growth in them, where applicable) over the same time period. If the ratio is significantly above 1, the company generally has sufficient financial capacity to pay out its expected future dividends, by our estimates. The higher the ratio, the better, all else equal.
Note that our following analysis made one revision to the above method. Instead of subtracting the total long-term debt, we subtracted the total interest expenses over a past five-year period. The reason for this revision is to adjust the status of businesses such as PM and MO. Mature businesses like these probably will never have the need to repay all of their debt at once. But it does need to have enough earnings to service its debt (i.e., cover the interest expenses). With this background, the dividend cushion ratios for PM and MO are calculated and shown below.
As can be seen, PM has been maintaining an average dividend cushion ratio of about 1.42x in recent years, and MO has been maintaining a slightly lower cushion ratio of 1.27x. Both are consistently above 1, which is regarded as the threshold for a safe dividend as mentioned above. And again, consistency is the key observation here. As seen, PM’s cushion ratio over the years has stayed close to the average line of 1.42. And MO’s cushion ratio has actually been gradually improving from about 1.12x in 2016 to the current level of 1.38x despite the large (and struggling) acquisition of JUUL in 2018. Currently, PM’s current cushion ratio is at 1.52, slightly above its historical average of 1.42. And MO’s cushion ratio currently stands at 1.38, also above its historical average.
Also, you can see that for both, their current cushion ratios are near the peak level since 2016. And next, we will see that such safety roots fundamentally in their strong cash flow, extremely light CAPEX requirements, and pricing power.
Author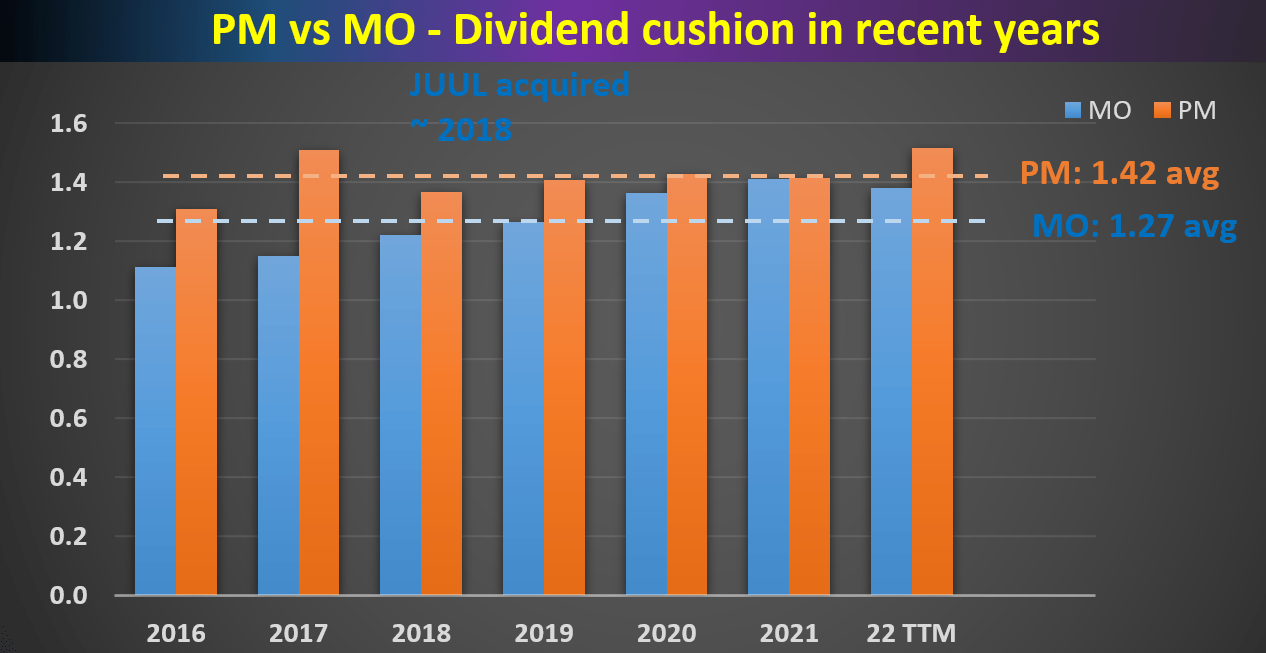
PM vs MO: business outlook
Looking ahead, both MO and PM are anticipating flat or even contracting shipment volume for their traditional products as aforementioned. For PM, thanks to its international exposure, it’s expecting a slight increase in the shipment volume in the range of 1.5% to 2.5%.
However, thanks to the long-term price power that they have demonstrated, both are expecting healthy growth on both lines. In PM’s case, it is expensing Net Revenue Growth in the 6% to 8% range. And at the same time, it is also expensing a Margin Expansion up to 50 basis points. All told, the EPS guidance is in the range of $5.23-$5.34, representing a quite remarkable growth rate of 10-12%.
MO has been demonstrating similar pricing power and margin stability too. During 1H of 2022, shipment volume on its smokeable products declined by about 9% as aforementioned. However, its operating income from the Smokeable Products Segment actually managed to grow by about 2.9% YoY, from $5.16 billion in 1H 2021 to $5.3B in 1H 2022. Its operation margin also expanded slightly by 1.3 basis points from 58.0% in 1H 2021 to 59.3% in 1H 2022.
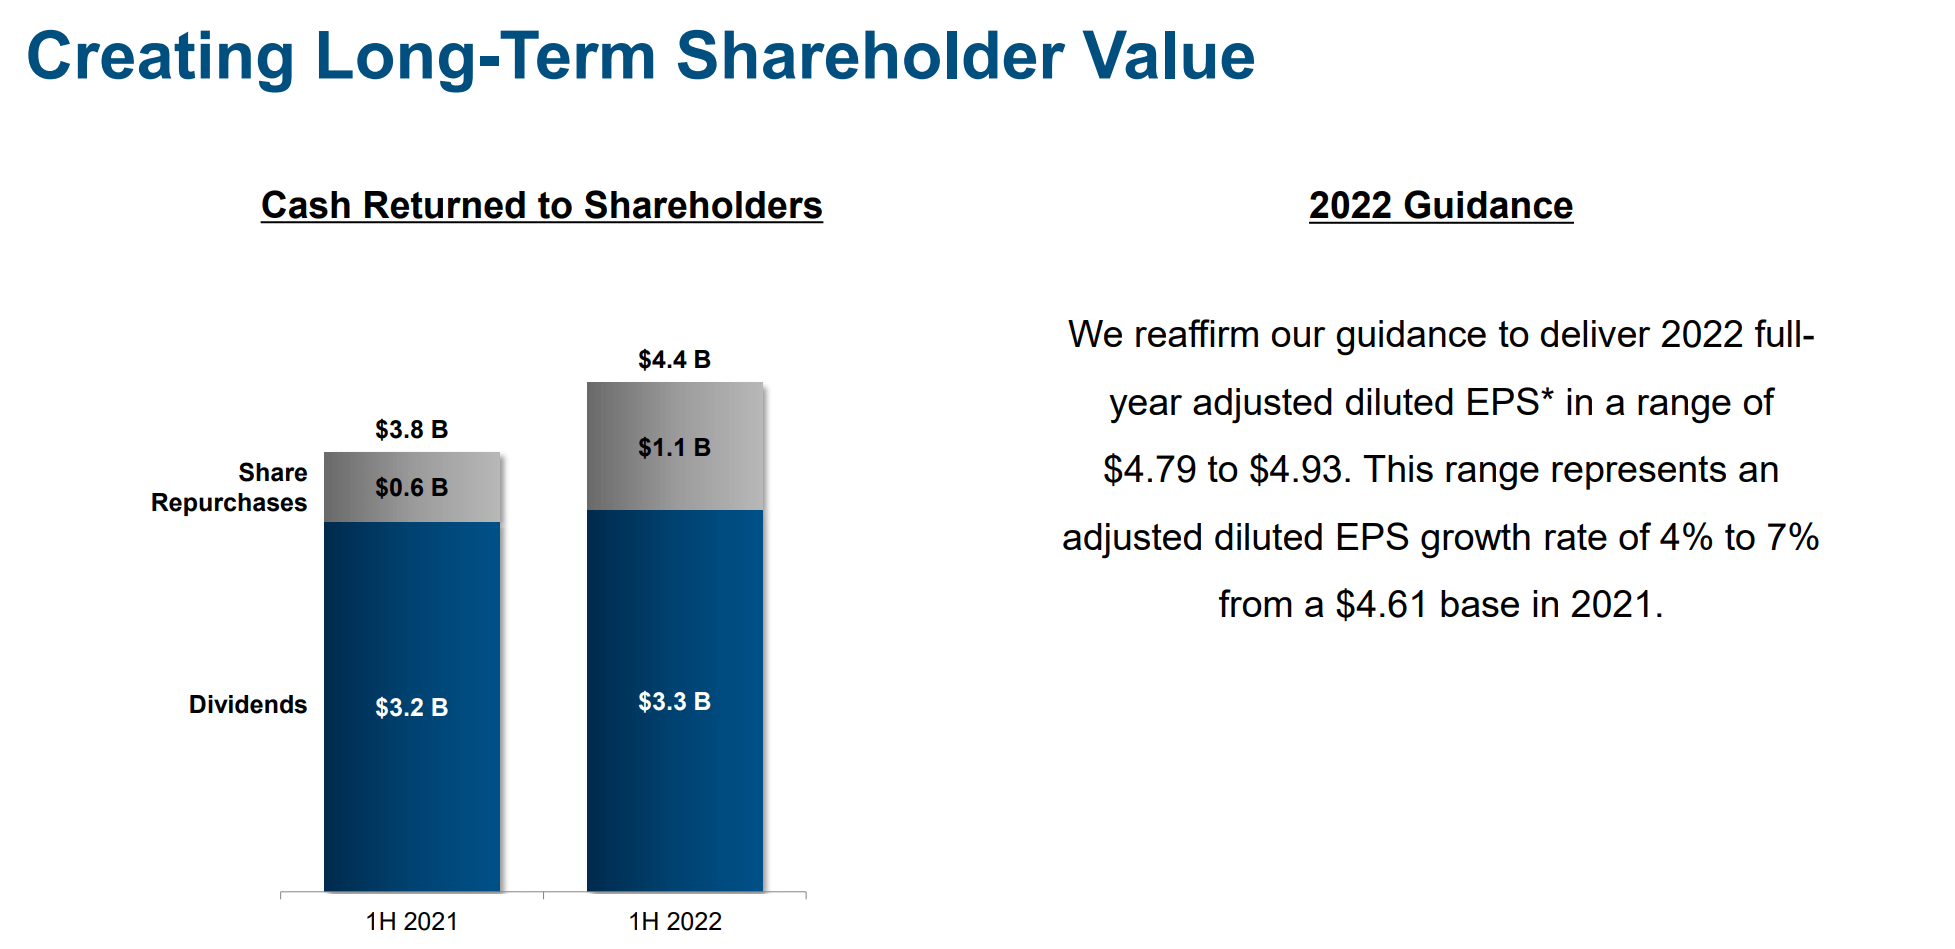
Looking forward, MO reaffirms its EPS guidance for the 2022 full year in a range of $4.79 to $4.93. This range also represents a healthy growth of 4% to 7% from an EPS of $4.61 in 2021.
PM 2022 Q2 earnings report MO 2022 Q2 earnings report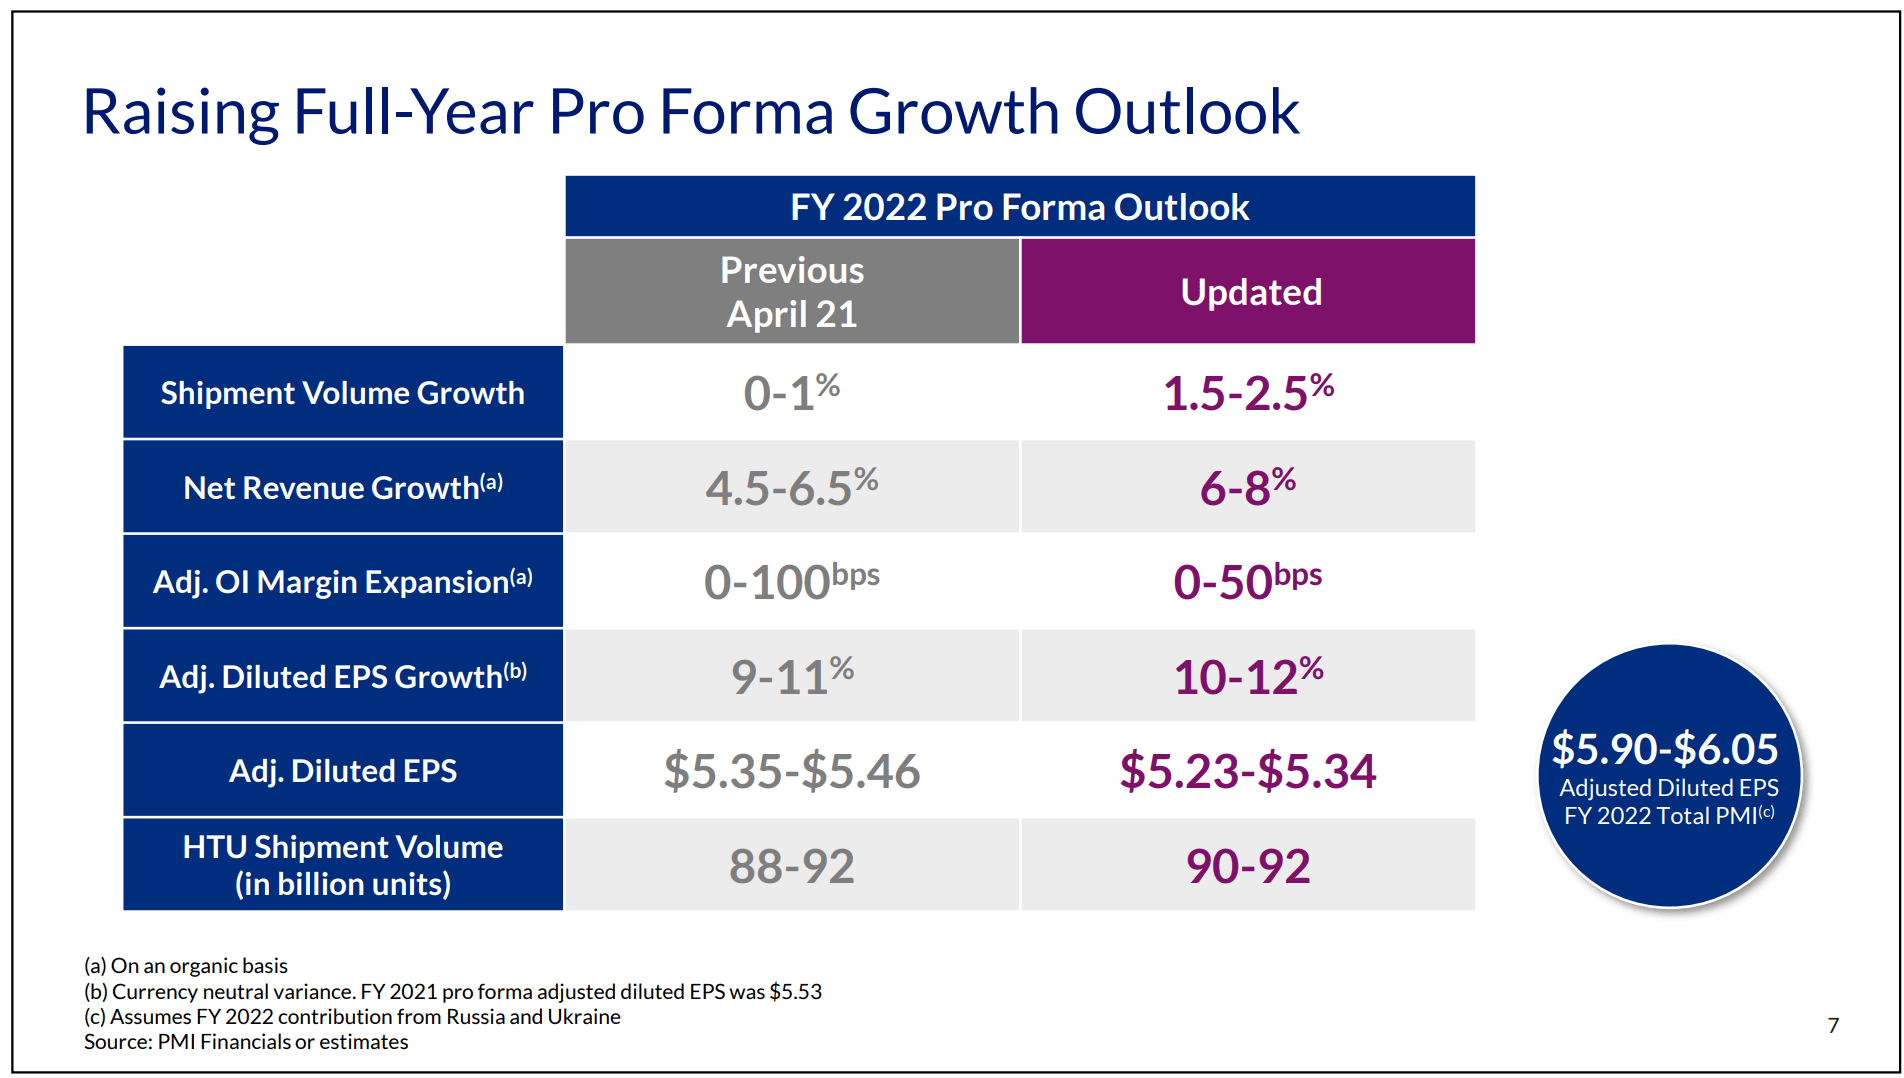
Final thoughts and other risks
Admittedly, MO is facing many setbacks together with the rest of the sector. And its risk profile is a bit higher due to its single market exposure in the U.S. However, I do not see any red flags for dividend investors to worry about its dividend safety. As a matter of fact, its dividend cushion ratio is now near a peak level since 2016 despite the pricy and failed JUUL adventure.
A comparison with PM better contextualizes its dividend safety. From the results, you can see that their dividend safety has been in line with each other in the long term and they are also in line now. Thanks to their extremely light CAPEX requirements and pricing power, I anticipate them to keep growing their earnings at a healthy pace (upper-single-digit to double-digit-range) despite shipment volume declines.
Finally, risks. Besides the secular decline in their smokable products, there are a few other risks facing both MO and PM. As mentioned earlier, MO has a higher geographical concentration risk because its main market is in the U.S. Investors who want to better diversify such risk could consider either PM or British American Tobacco. Both MO and PM have been aggressively investing in noncombustible and more healthy new products. However, the path can be tortuous and the timeline of success remains uncertain at this point. As mentioned earlier, the FDA recently approved BTI’s Vuse e-cigarette, putting MO at a disadvantageous position in this future segment. Lastly, both also face macroeconomic risks. The current Russian/Ukraine geopolitical issues pose a major risk. PM also suffers some disruptions in the global supply chain. It is dealing with semiconductor shortages that may prevent it from fully fulfilling consumer demand for its IQOS product.
Be the first to comment