

plastic_buddha
Introduction
Denver-based SSR Mining (NASDAQ:SSRM) released its second-quarter 2022 results on August 2, 2022.
Important note: This article is an update of my article published on May 10, 2022. I have been following SSRM on Seeking Alpha since 2021.
SSRM Map Presentation (SSR Mining)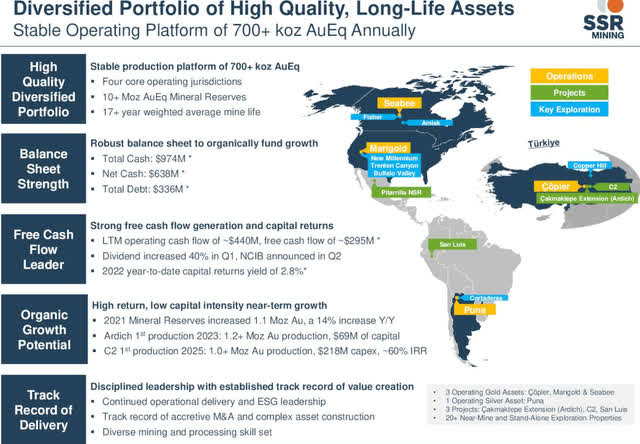
1 – 2Q22 Results Snapshot and commentary
The company reported adjusted earnings of $66.80 million or $0.30 per share, in line with analysts’ expectations compared to $0.47 per diluted share a year ago.
Gold equivalent production dropped to 159,262 GEOs, and the company sold 167,201 GEOs at $1,862 per GEO.
The company said it was on track to meet full-year guidance of 740K GEOs (midpoint) at an AISC of $1,150 per ounce (midpoint).
For the three months ended June 30, 2022, revenue decreased by $57.4 million, or 15.2%, to $319.58 million, compared to $376.95 million for the three months ended June 30, 2021.
SSRM 2Q22 highlights Presentation (SSR Mining)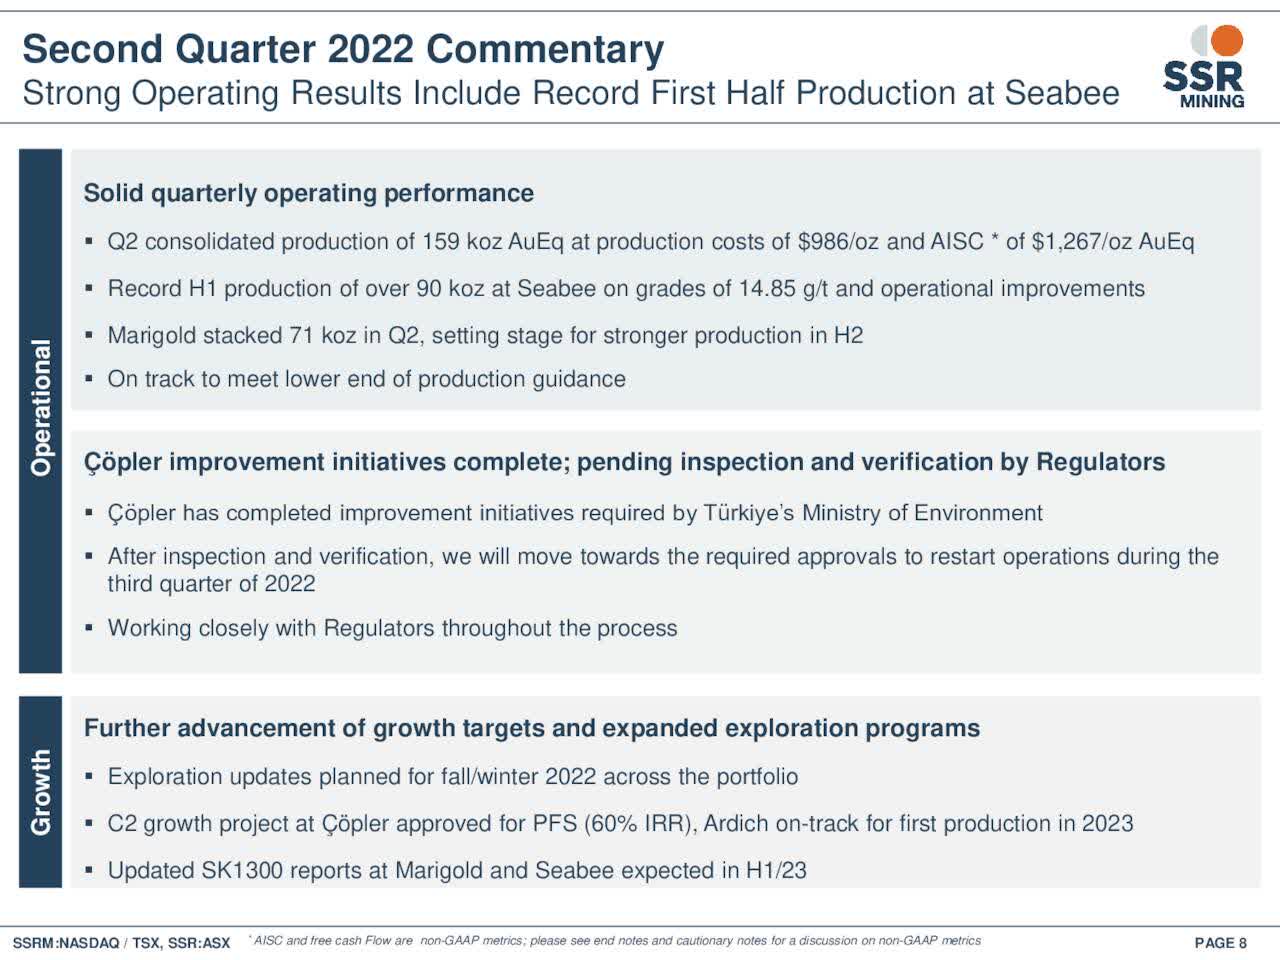
Below is the production per mine 1Q22 versus 2Q22:
SSRM Quarterly production per mine 1Q22 versus 2Q22 (Fun Trading)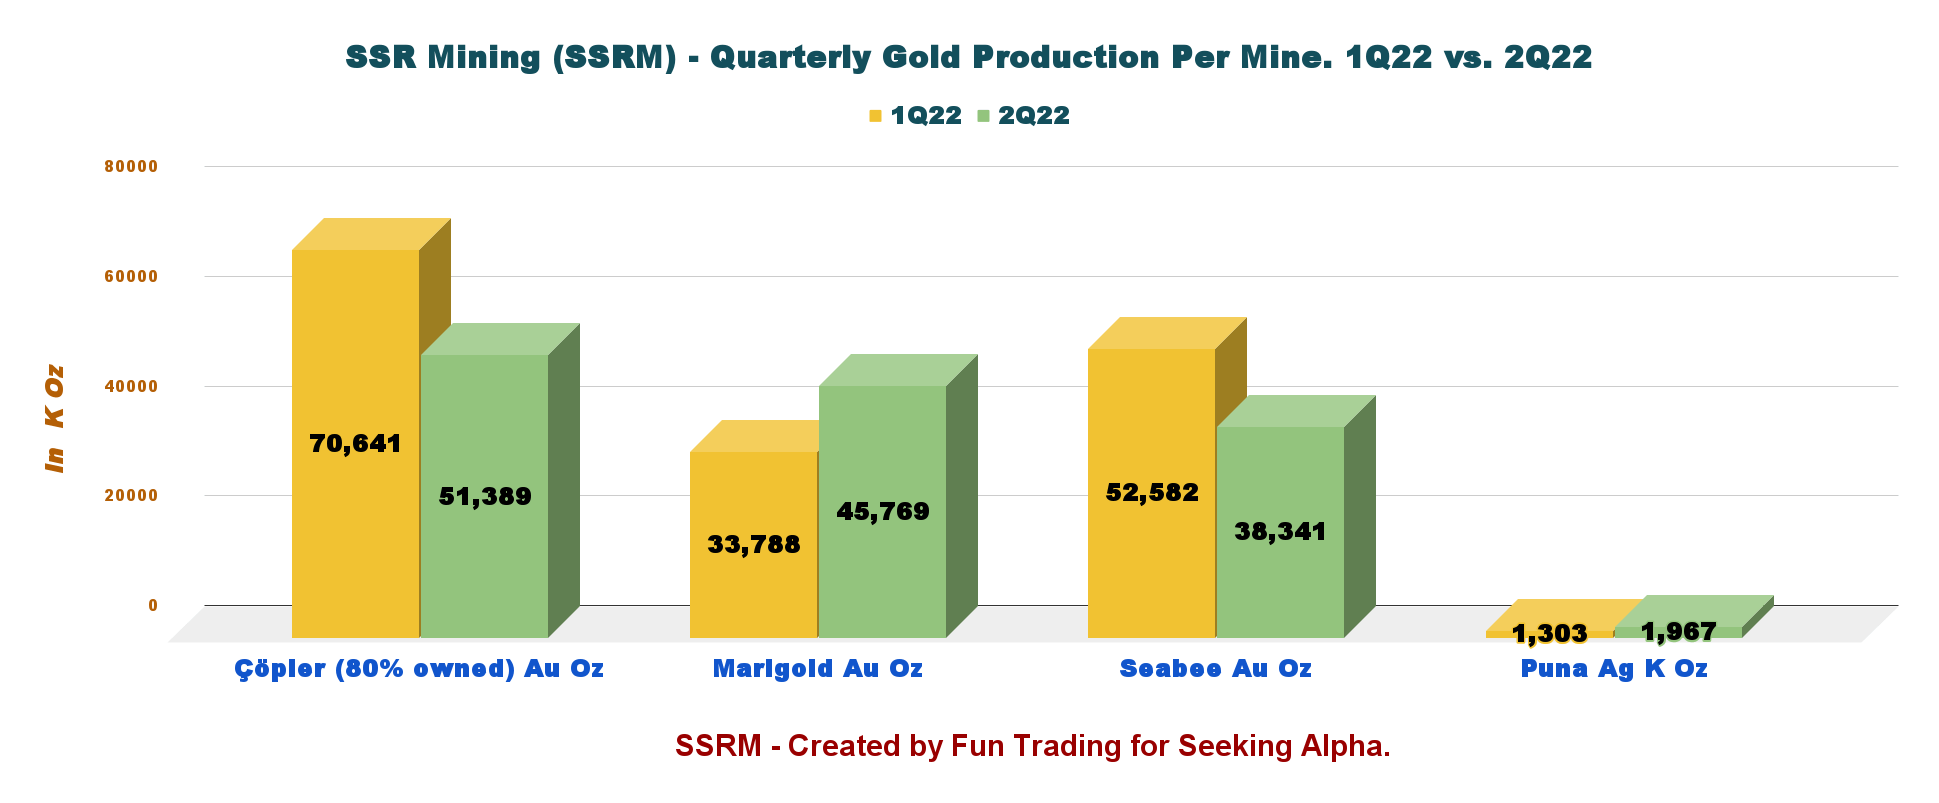
As we see above, Marigold did well this quarter, but Seabee and Çöpler showed a weaker production.
Production costs per ounce sold were 20.2% higher due to higher reagent unit prices and 24.8% fewer gold ounces sold. For Çöpler, the downside was partly due to lower sulfide grade mined. On January 29, 2022, SSRM temporarily closed the Çöpler mine following a cyanide spill the preceding week.
Seabee mine was also down sequentially despite an 11.9% increase of ore tonnes milled, but partially offset by an 8.6% decrease in mill feed grade.
However, 2022 guidance remains at 740K Oz (mid-point), but AISC is raised to between $1,230 and $1,290 per ounce (up $110/Oz) due to inflationary pressure.
On April 14, 2022, SSR Mining closed the Taiga Gold Corp. acquisition, an all-share deal.
With this transaction, SSR Mining has consolidated a 100% interest in the Fisher property contiguous to its Seabee mine, eliminated a 2.5% net smelter return (“NSR”) royalty on the Fisher property, and added five new properties covering over 29,100 hectares to complement the Company’s existing exploration platform in the underexplored and geologically prospective Province of Saskatchewan. SSR Mining’s Saskatchewan assets now cover an area of approximately 131,150 hectares.
The investment thesis remains unchanged from the preceding article. I believe SSRM is a possible candidate for the long term despite the hiccup experienced at Çöpler.
I am impressed with the balance sheet and the quality of the assets. Most of the assets are located in North America, which is extra security.
However, as we can see this quarter, it’s paramount to trade short-term LIFO a minimum of 50% of your SSRM position to take advantage of the sharp gold price volatility that will continue until probably 2023.
CEO Rodney Antal said in the conference call:
The first half of 2022 demonstrated the continued resilience of our business in the face of supply chain constraints and inflation pressures as our consolidated production and cost metrics track well against our year-to-date targets. Our four operating assets produced 333,000 ounces of gold at all-in sustaining costs of $1,177 per ounce, with solid margins and attributable net income of $126 million.
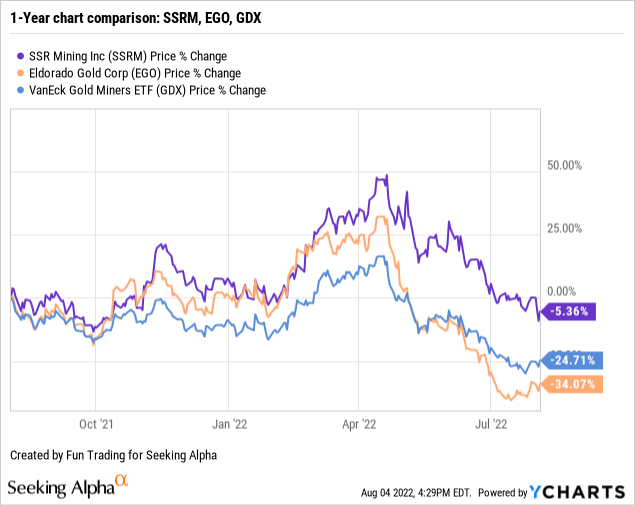
2 – Stock Performance
SSRM has outperformed the VanEck Vectors Gold Miners ETF (GDX) and Eldorado Gold (EGO) which owns two mines in Turkiye. However, it is now down 5% on a one-year basis.
SSR Mining – Financial Snapshot 2Q22: The Raw Numbers
| SSRM | 2Q21 | 3Q21 | 4Q21 | 1Q22 | 2Q22 |
| Total Revenues $ million | 376.95 | 322.85 | 407.92 | 355.45 | 319.58 |
| Quarterly Earnings $ million | 54.01 | 57.18 | 203.91 | 67.56 | 58.49 |
| EBITDA $ million | 170.15 | 154.95 | 149.46 | 170.96 | 116.68 |
| EPS (diluted) $ per share | 0.24 | 0.26 | 0.89 | 0.31 | 0.27 |
| Operating Cash Flow $ million | 148.60 | 187.87 | 127.29 | 62.19 | 32.84 |
| CapEx in $ million | 48.23 | 58.69 | -10.69 | 34.49 | 41.84 |
| Free Cash Flow | 100.37 | 129.18 | 137.98 | 27.70 | -9.00 |
| Total Cash in $ million | 891.11 | 881.57 | 1,057.99 | 1,033.22 | 964.55 |
| Total Debt in $ million | 358.77 | 343.13 | 371.45 | 353.71 | 331.93 |
| Shares Outstanding (diluted) | 232.53 | 226.83 | 220.76 | 224.74 | 225.08 |
| Dividend $/ share | 0.05 | 0.05 | 0.07 | 0.07 | 0.07 |
Source: Company 10-Q
SSR Mining – Gold Production and Balance Sheet Details
1 – Revenues and Trends. Revenues were $319.58 million in 2Q22
1.1 – Revenues
SSRM Quarterly Revenues history (Fun Trading)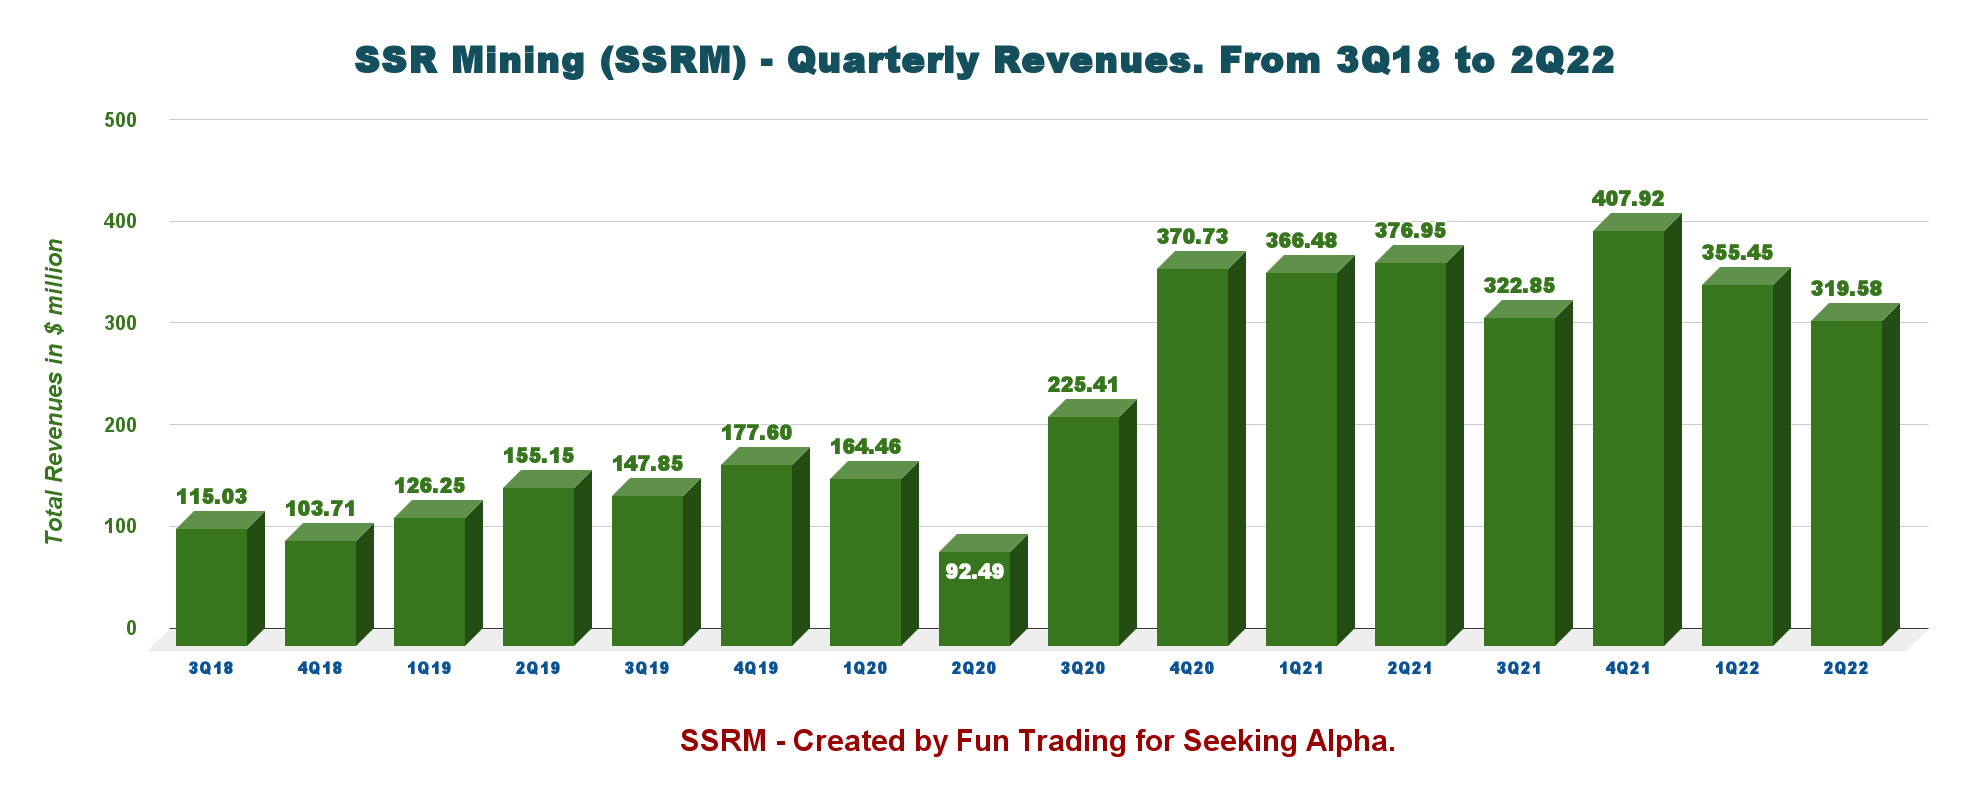
The company posted weak revenues of $319.58 million in the second quarter of 2022, down 15.2% compared to 2Q21 and down 10.1% sequentially.
The adjusted net income was $66.80 million or $0.30 per diluted share ($107.32 million or $0.47 per diluted share in 2Q21).
Revenues from gold represent 85.3% of the total revenues.
SSRM Quarterly revenues per metal in 2Q22 (Fun Trading)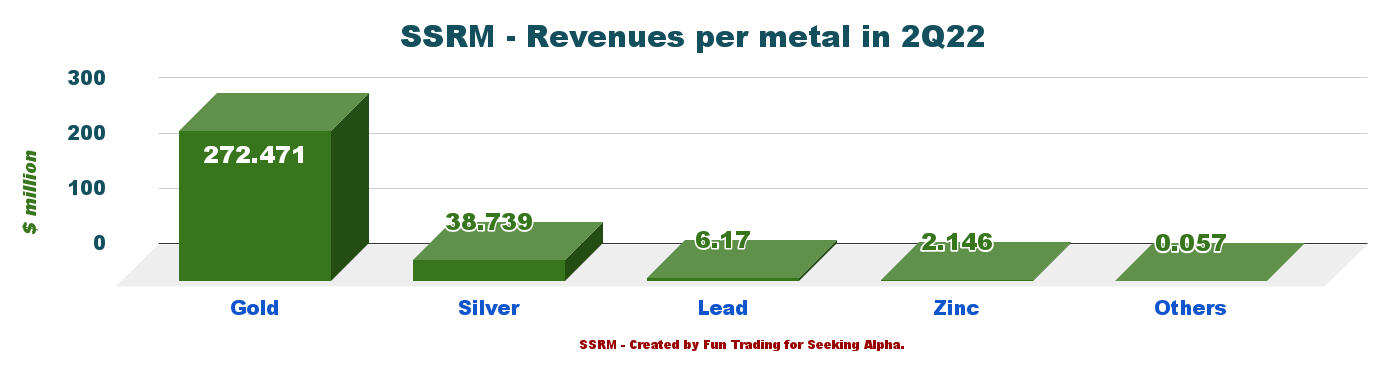
1.2 – Mineral reserves increased 14% over 2020 to 9.2 Moz
SSRM Mineral Reserves 2021 (SSR Mining Presentation)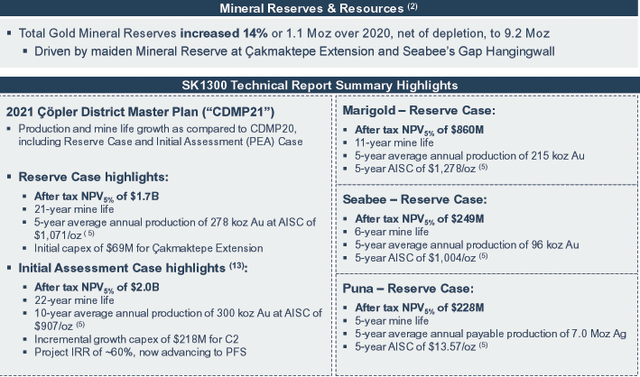
2 – Free Cash Flow was a loss of $9 Million in 2Q22
SSRM Quarterly Free cash flow history (Fun Trading)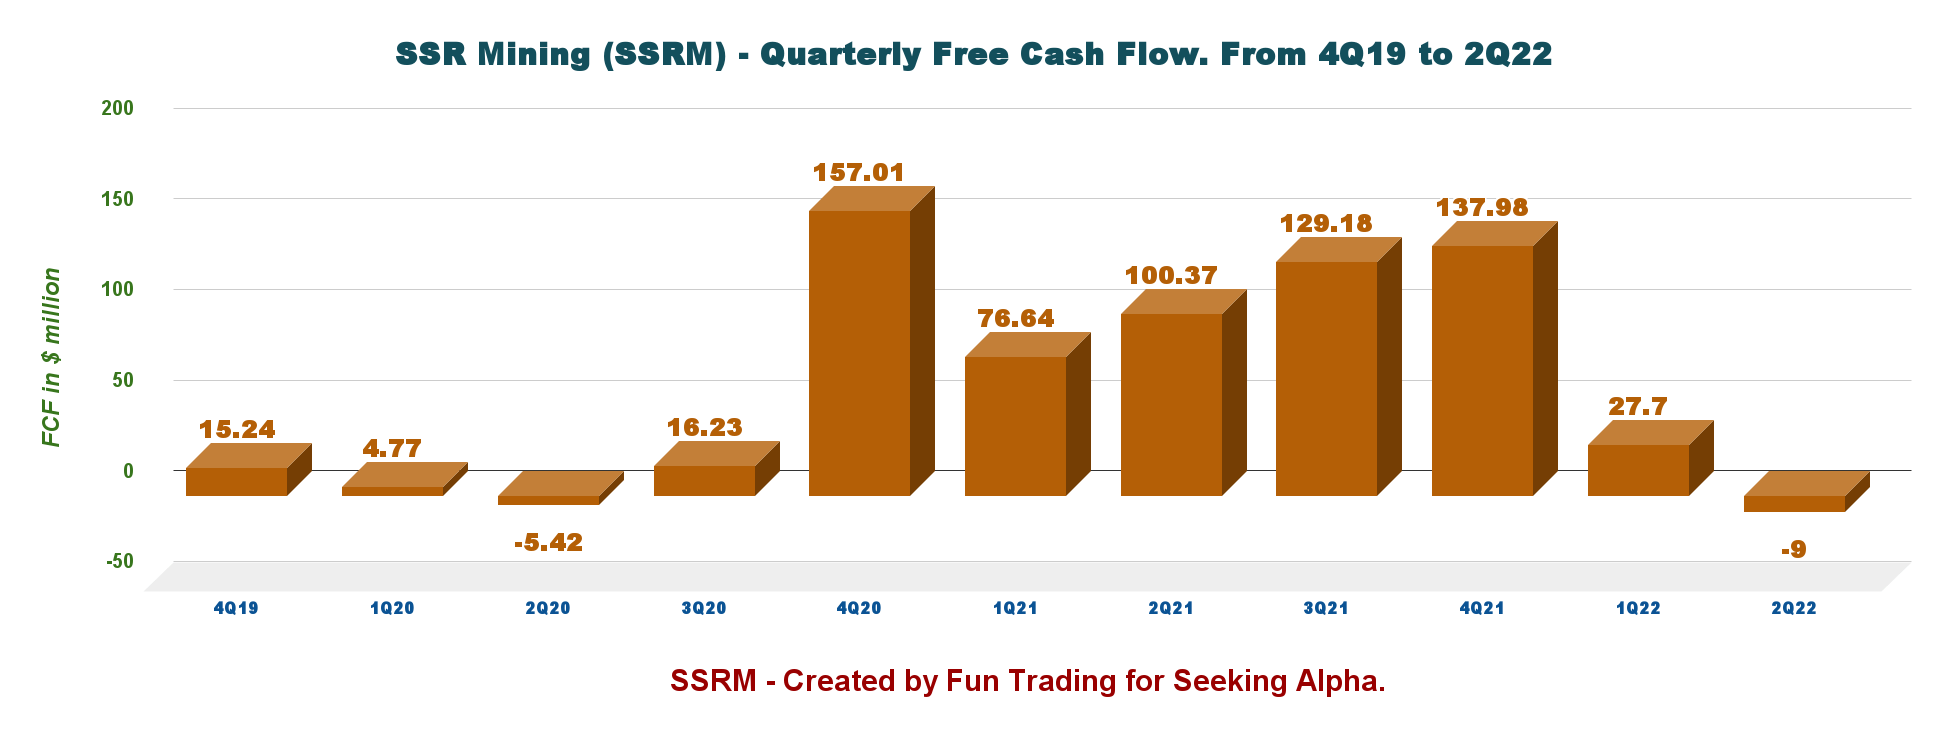
Trailing 12-month free cash flow was $285.86 million, with the second-quarter 2022 free cash flow loss of $9.00 million.
The company declared a quarterly dividend of $0.07 per share or a dividend yield of 1.88%. Also,
On April 20, 2022,… The Company purchased and cancelled 8,800,700 common shares via open market purchases through the facilities of the TSX and the Nasdaq at a weighted average price paid per common share of $16.82 and a total repurchase value of $148.1 million.
During the three and six months ended June 30, 2022, the Company repurchased and cancelled 797,842 common shares for $14.7 million.
3 – An Impressive Debt Profile With No Net Debt
SSRM Quarterly Cash versus Debt history (Fun Trading)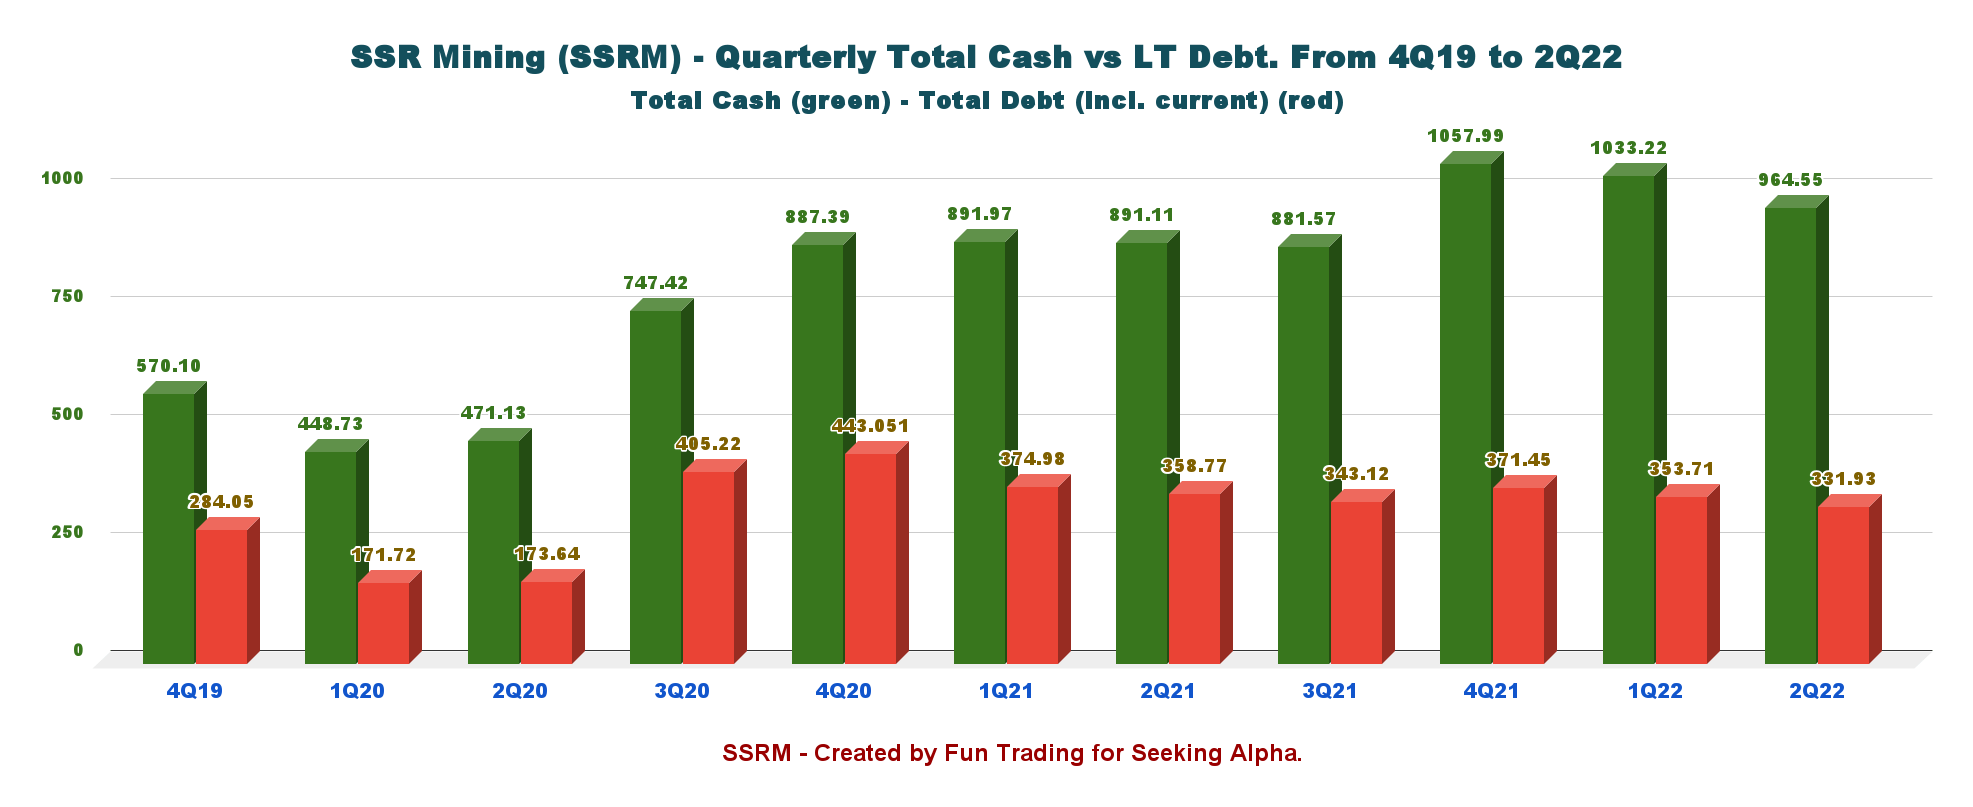
On June 30, 2022, cash and cash equivalents and others were $964.55 million, up from the $891.91 million in 2Q21. Total Debt is $331.93 million-net debt to EBITDA ratio of 1x.
SSRM Financial situation Presentation (SSR Mining)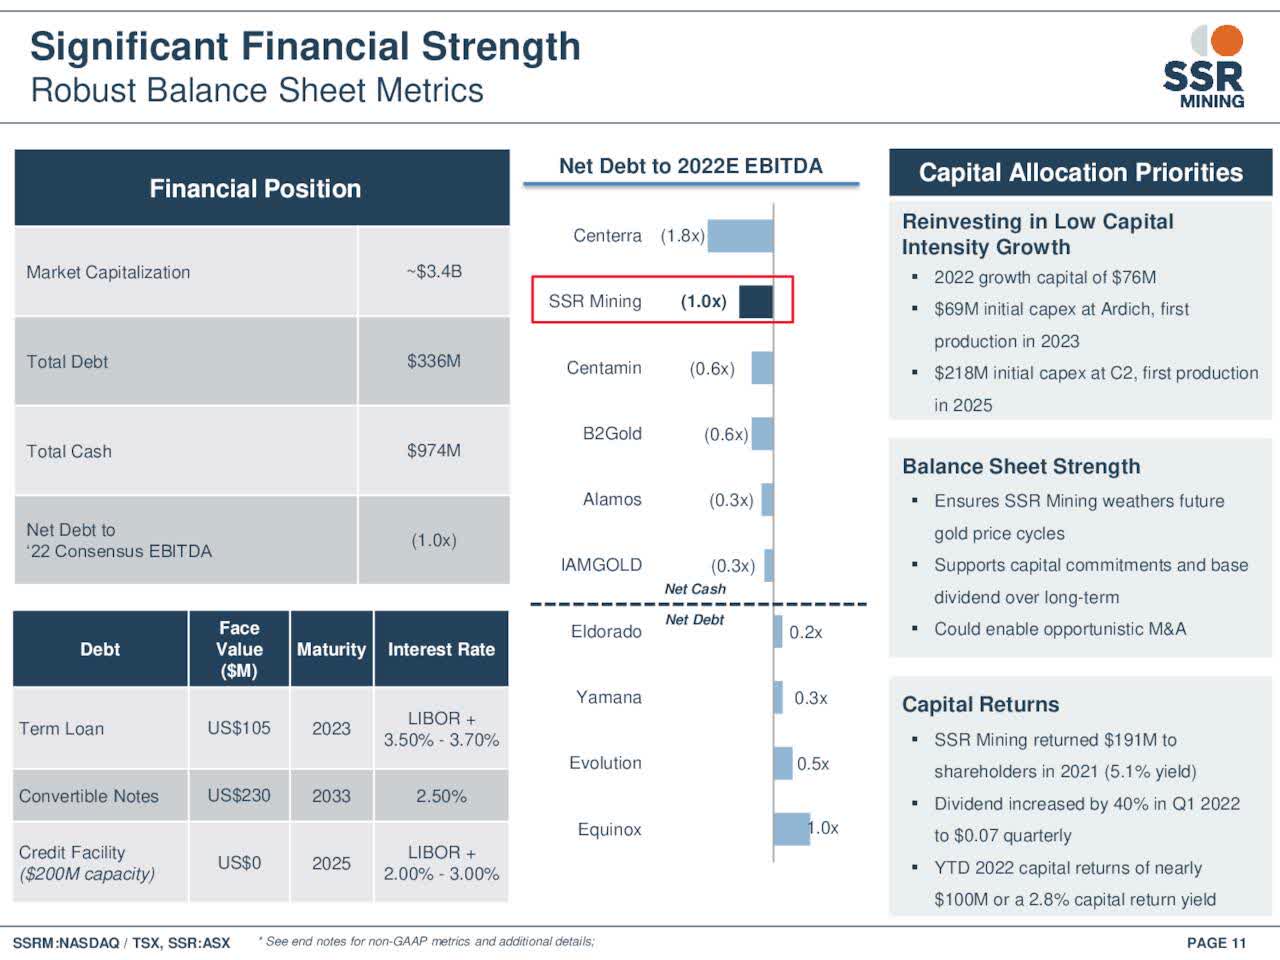
4 – Gold Equivalent Production Details. The Company Produced 159,262 Au Equivalent Oz in 2Q22.
SSRM Quarterly GEO Production history (Fun Trading)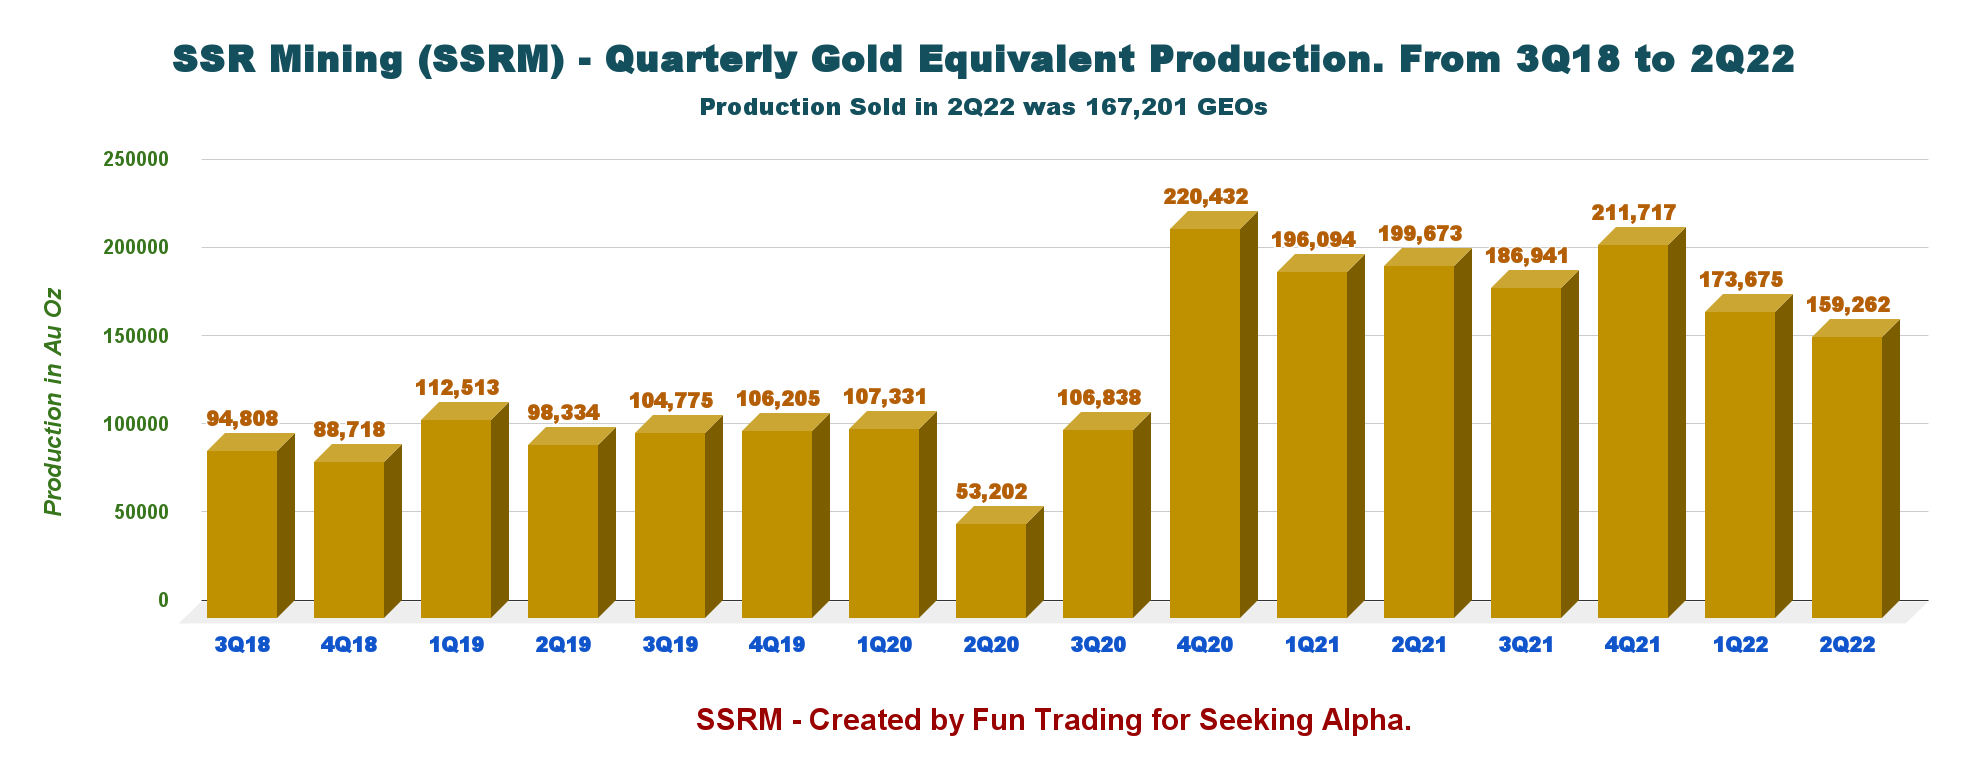
Gold equivalent produced dropped 20.2% year over year to 159,262 oz in the second quarter and was down 8.3% sequentially. Also, the gold equivalent sold was 167,201 GEOs. This quarter was a particularly weak production, with Çöpler and Seabee underperforming.
SSRM Quarterly production per mine in 2Q22 (Fun Trading)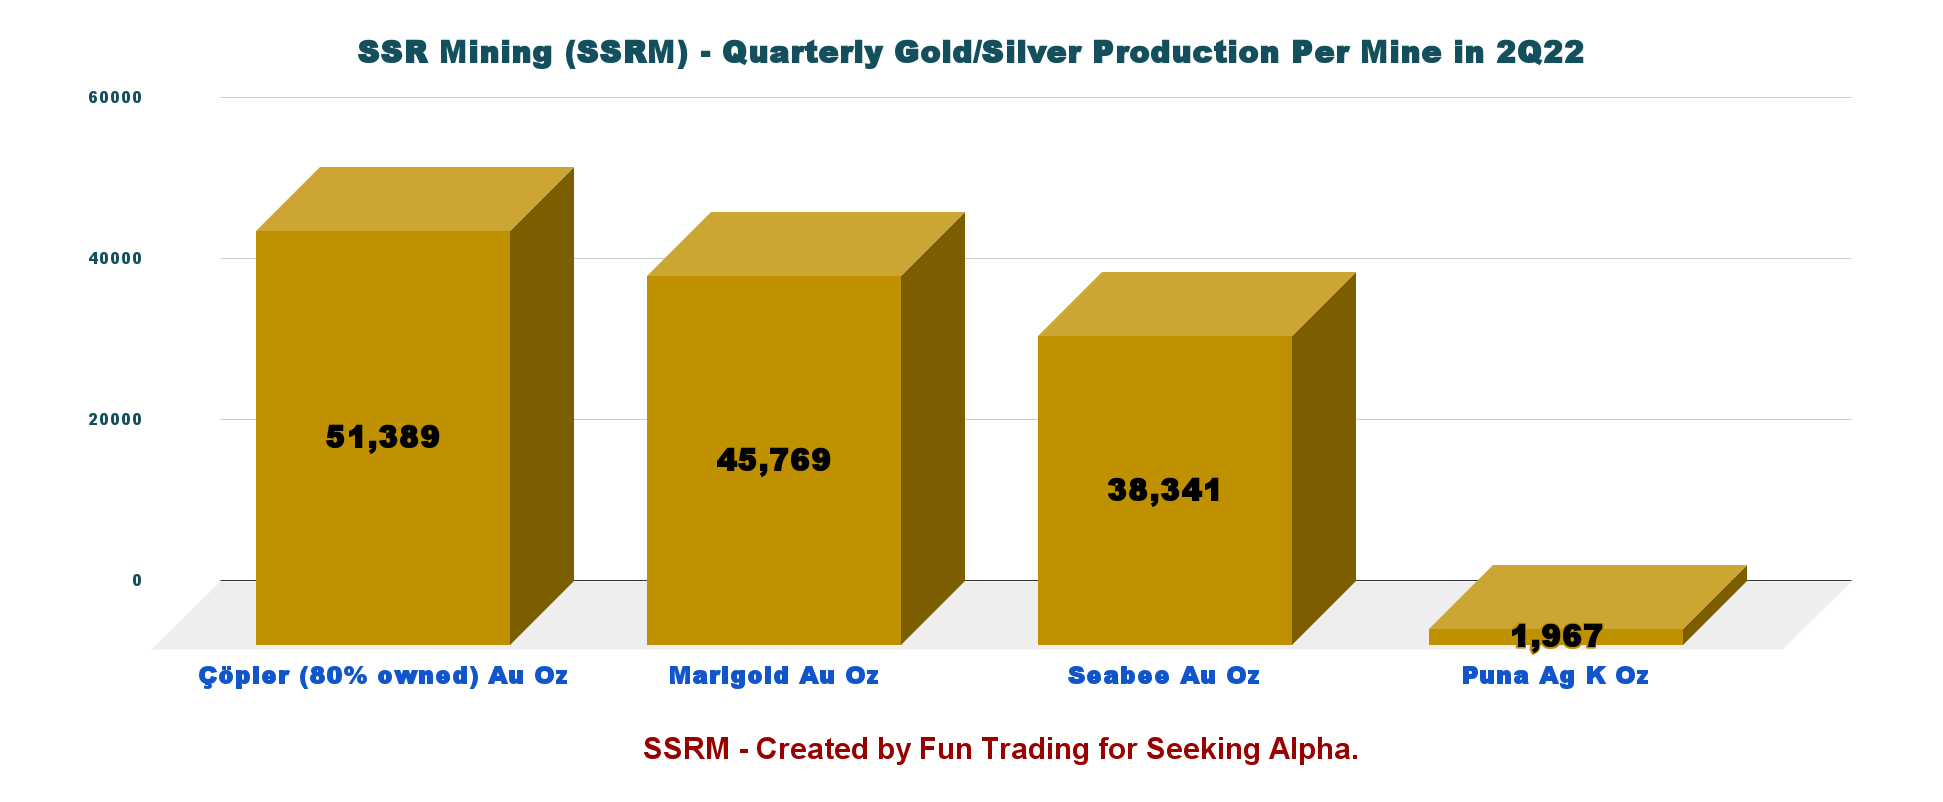
Note: Puna mine in Argentina produces silver only.
SSRM Quarterly gold and silver prices history (Fun Trading)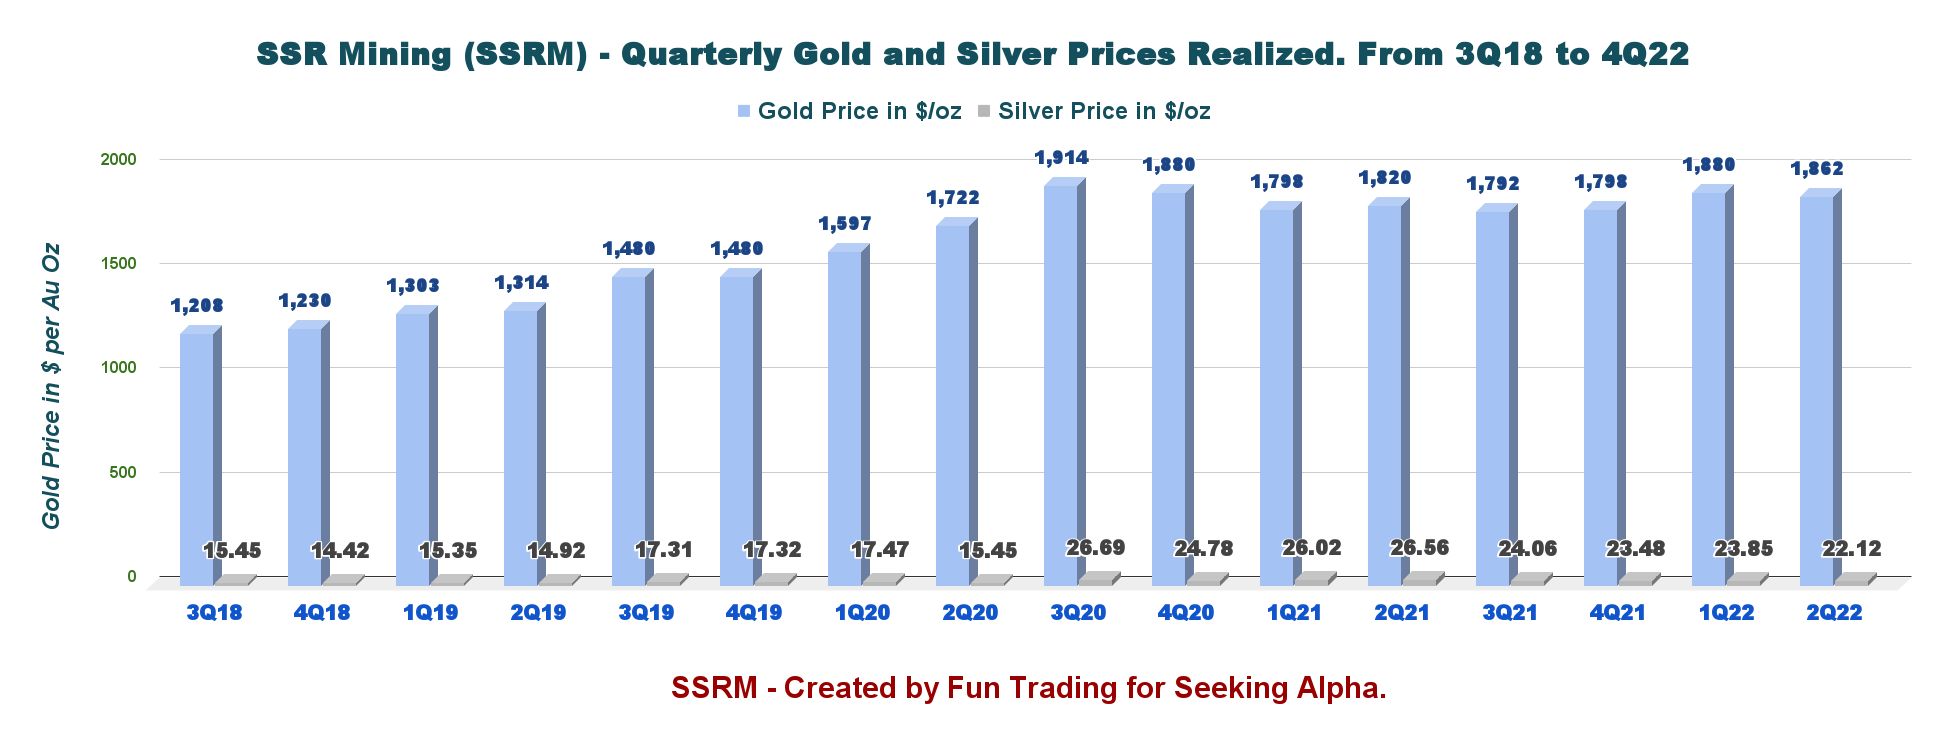
The average realized gold price increased 2.3% to $1,862 per ounce from the year-ago quarter. The average realized silver price was $22.12 per ounce in the quarter, down year-over-year by 16.7%.
5 – All-in Sustaining Costs and Cash Cost
SSRM Quarterly AISC per GEO history (Fun Trading)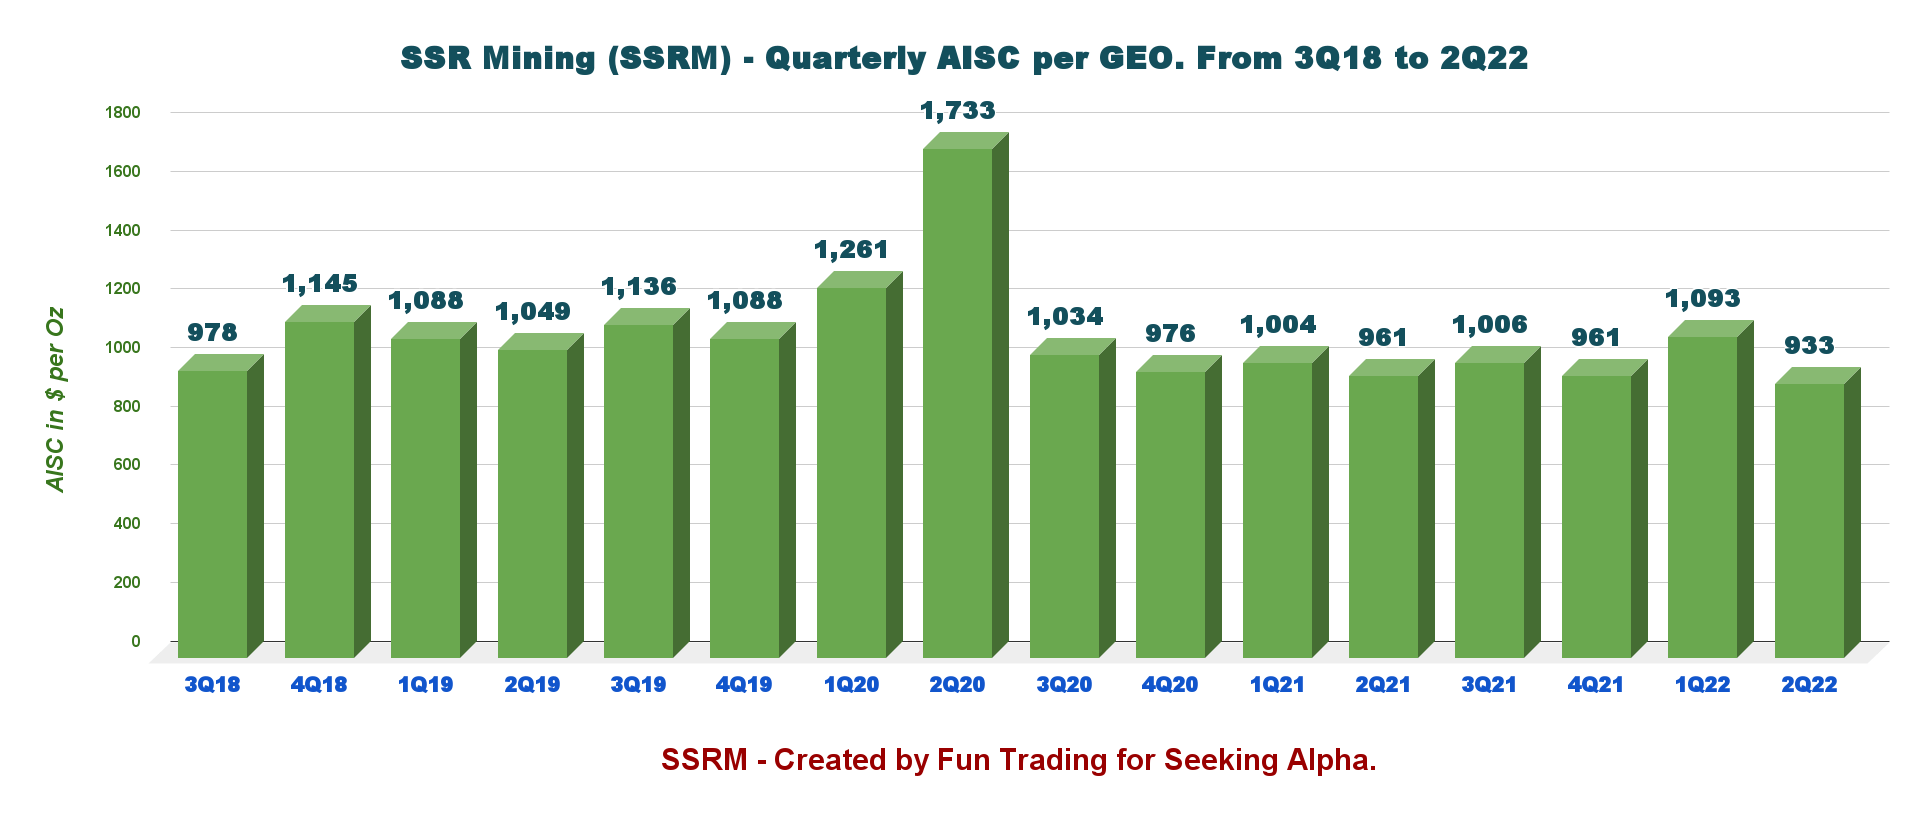
AISC per gold equivalent ounce sold decreased to $933 in 2Q22 from $961, the same quarter a year ago.
6 – 2022 Guidance
The company expects a consolidated production of 700K to 780K Oz. However, the Çöpler mine is expected to produce 220K-250K, down from 255K-285K but compensated by the Seabee mine, which is raised from 115k-125k to 150k-160K. Inflationary pressure is also felt with an increase of $110/oz.
AISC is now between $1,230-$1,290 per ounce, up $110 per ounce due to inflationary pressure.
SSRM Guidance and production Presentation (SSR Mining)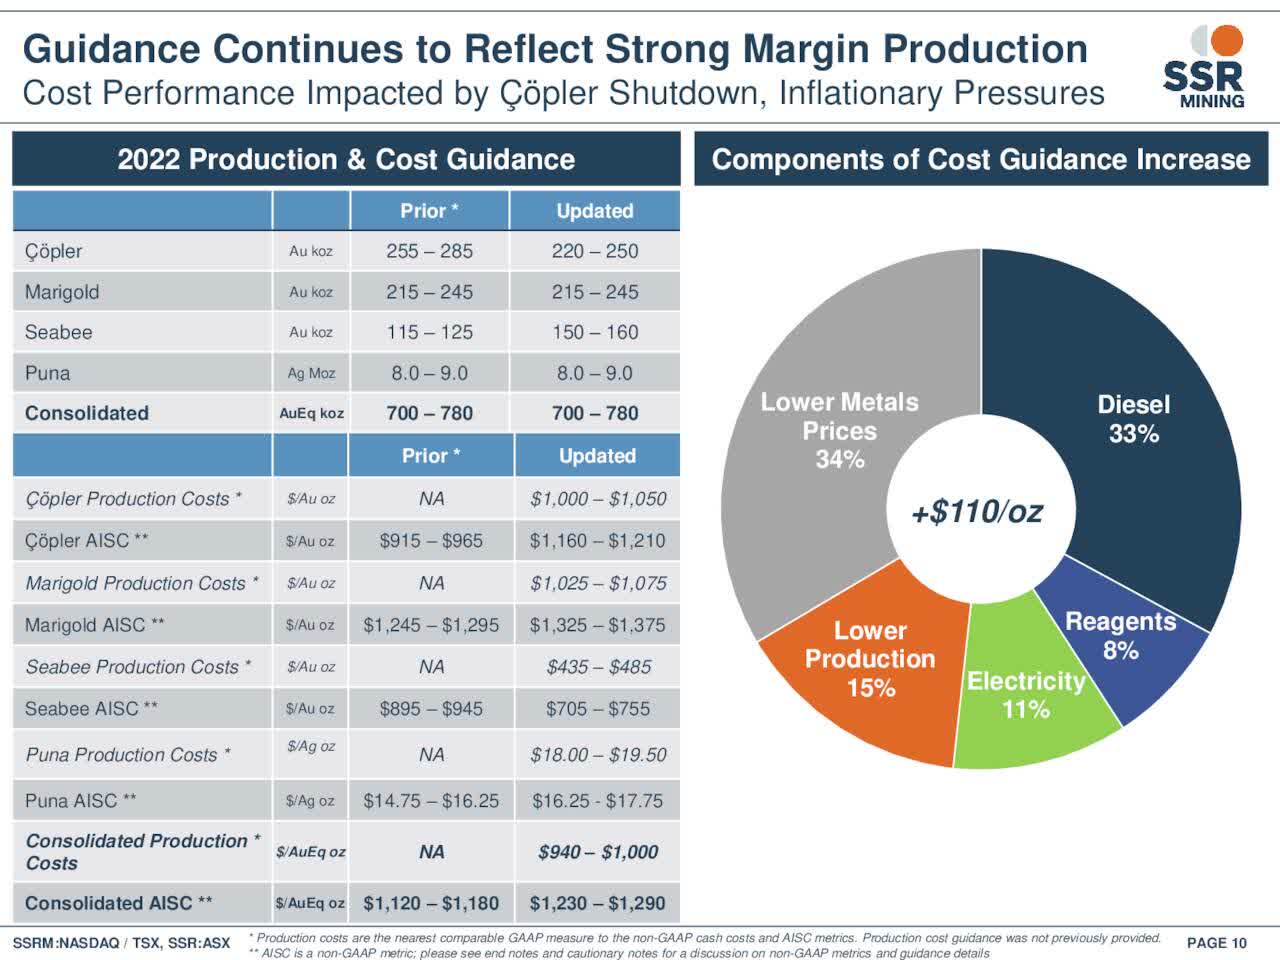
Technical Analysis (short term) and Commentary
SSRM TA Chart short-term (Fun Trading)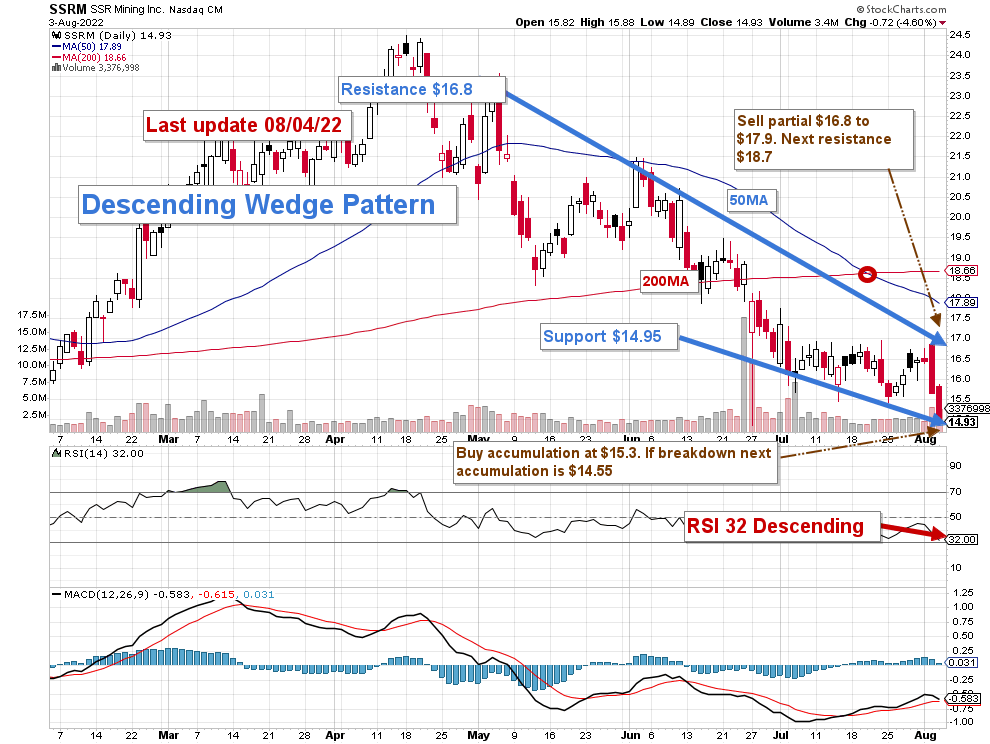
Note: The graph has been adjusted for the dividend.
SSRM forms a descending wedge pattern with resistance at $16.8 and support at $14.95.
The short-term trading strategy has not changed since my preceding article. I suggest trading LIFO (see note below) about 45%-50% of your position and keeping a core long-term amount for a much higher payday.
I suggest selling between $16.8 and $17.9 and waiting patiently for a retracement below $15 with possible lower support at $14.55.
Watch the price of gold like a hawk.
Note: The LIFO method is prohibited under International Financial Reporting Standards (IFRS), though it is permitted in the United States to generally accepted accounting principles (GAAP). Therefore, only US traders can apply this method. Those who cannot trade LIFO can use an alternative by setting two different accounts for the same stock, one for the long term and one for short-term trading.
Warning: The TA chart must be updated frequently to be relevant. It is what I am doing in my stock tracker. The chart above has a possible validity of about a week. Remember, the TA chart is a tool only to help you adopt the right strategy. It is not a way to foresee the future. No one and nothing can.
Author’s note: If you find value in this article and would like to encourage such continued efforts, please click the “Like” button below as a vote of support. Thanks.
Be the first to comment