

JHVEPhoto/iStock Editorial via Getty Images
In this analysis of SS&C Technologies Holdings, Inc. (NASDAQ:SSNC), we analyzed the company following its Q3 2022 earnings and its completed acquisitions in Financial Ops. Historically, the company had a high 5-year average revenue growth of 32.3% and a 10-year average of 32.6% but slowed down to just 8% in 2021. We analyzed the company’s revenue breakdown by its organic revenues and estimated M&A revenue contribution to determine which is the key growth revenue driver. Moreover, we examined the company’s financial position and did a credit analysis to analyze its debt repayment capabilities to forecast our estimated M&A revenue contribution. Finally, we examined the company’s revenue streams and segmented them to forecast its organic revenue growth to derive our total revenue growth outlook for the company.
Acquisition Revenue Contributes to Growth
SS&C Technologies has a strong M&A track record with 25 total acquisitions in the past 10 years according to SS&C Technologies. We compiled the company’s acquisitions and estimated M&A revenue contribution from its acquisitions in the table below to determine its organic revenue growth and M&A revenue contribution as a % of total revenue.
|
Revenue Breakdown ($ mln) |
2012 |
2013 |
2014 |
2015 |
2016 |
2017 |
2018 |
2019 |
2020 |
2021 |
Average |
|
Organic Revenue |
351 |
503 |
706 |
578 |
796 |
1,669 |
772 |
3,602 |
4,644 |
4,975 |
|
|
Growth % |
43.1% |
40.5% |
-18.2% |
37.8% |
109.7% |
-53.7% |
3.0% |
28.9% |
7.1% |
22.0% |
|
|
Estimated M&A Revenue |
200.5 |
210 |
61.8 |
422.8 |
685.45 |
6 |
2648.7 |
1,031 |
24 |
77 |
|
|
Total |
552 |
713 |
768 |
1,000 |
1,481 |
1,675 |
3,421 |
4,633 |
4,668 |
5,051 |
|
|
Growth % |
48.7% |
29.2% |
7.7% |
30.3% |
48.1% |
13.1% |
104.2% |
35.4% |
0.8% |
8.2% |
32.6% |
|
M&A Revenue Contribution |
36.3% |
29.5% |
8.0% |
42.3% |
46.3% |
0.4% |
77.4% |
22.3% |
0.5% |
1.5% |
26.4% |
Source: Company Data, Zippia, Tracxn, Zoom Info, Khaveen Investments
Based on the table above, the company had an average 10-year organic revenue growth of 22% while its total revenue growth had a higher average growth of 32.6%. Additionally, we estimated its M&A revenue contribution as a % of its total revenue to have an average of 26.4% in the past 10 years.
|
Revenue Breakdown ($ mln) |
2012 |
2013 |
2014 |
2015 |
2016 |
2017 |
2018 |
2019 |
2020 |
2021 |
Average |
|
Number of Acquisitions |
4 |
1 |
1 |
3 |
4 |
2 |
4 |
2 |
3 |
1 |
2.5 |
|
M&A Revenue |
200.5 |
210 |
61.8 |
422.8 |
685.45 |
6 |
2648.7 |
1,031 |
24 |
77 |
|
|
Revenue Per Acquisition |
50.1 |
210.0 |
61.8 |
140.9 |
171.4 |
3.0 |
662.2 |
515.7 |
7.9 |
76.5 |
189.9 |
Source: SS&C Technologies, Khaveen Investments
Furthermore, we calculated the company’s average M&A revenue per acquisition in the table above with an average of $189.9 mln. Overall, we believe that the company’s revenue growth has been driven by organic revenue growth as its main growth driver at an average of 22% compared to the total revenue growth of 32.6%. Notwithstanding, we believe that M&A revenue has contributed to its growth with an average M&A revenue contribution of 26.4%.
Financial Position and Credit Supports Future M&A Activities
Moreover, we did a credit analysis of the company based on its interest coverage and EBITDA to debt ratios in the table below to examine its debt repayment capabilities.
|
Credit Analysis |
2012 |
2013 |
2014 |
2015 |
2016 |
2017 |
2018 |
2019 |
2020 |
2021 |
Average |
|
EBIT interest coverage |
4.2x |
4.4x |
7.9x |
2.1x |
2.2x |
3.7x |
2.2x |
2.3x |
4.1x |
6.3x |
3.9x |
|
EBITDA interest coverage |
6.5x |
6.8x |
11.7x |
4.0x |
4.0x |
5.9x |
4.1x |
4.2x |
6.9x |
9.3x |
6.3x |
|
CFO interest coverage |
4.1x |
5.0x |
9.9x |
3.0x |
3.3x |
4.4x |
2.4x |
3.3x |
4.8x |
7.1x |
4.7x |
|
FCF interest coverage |
-26.4x |
4.4x |
5.6x |
-32.7x |
-0.8x |
3.6x |
-24.1x |
2.7x |
3.8x |
6.1x |
-5.8x |
|
EBITDA/Total Debt |
0.2x |
0.3x |
0.3x |
0.1x |
0.1x |
0.2x |
0.1x |
0.1x |
0.2x |
0.2x |
0.2x |
|
EBITDA/Net Debt |
0.2x |
0.3x |
0.4x |
0.1x |
0.2x |
0.2x |
0.1x |
0.1x |
0.2x |
0.2x |
0.2x |
Source: SS&C Technologies, Khaveen Investments
Based on the table, the company’s interest coverage ratios have improved in the past 10 years despite the increase in its debt. Its EBIT interest coverage ratio increased from 4.2x to 6.3x in 2021, its EBITDA interest coverage improved from 6.5x in 2012 to 9.3x in 2021 and its CFO interest coverage increased from 4.1x to 7.1x. In addition, both its EBITA/debt ratios have remained the same at 0.2x in 2012 and 2021.
Furthermore, we analyzed the company’s financial position to examine whether the company could continue its M&A activities to support its growth.
SS&C Technologies, Khaveen Investments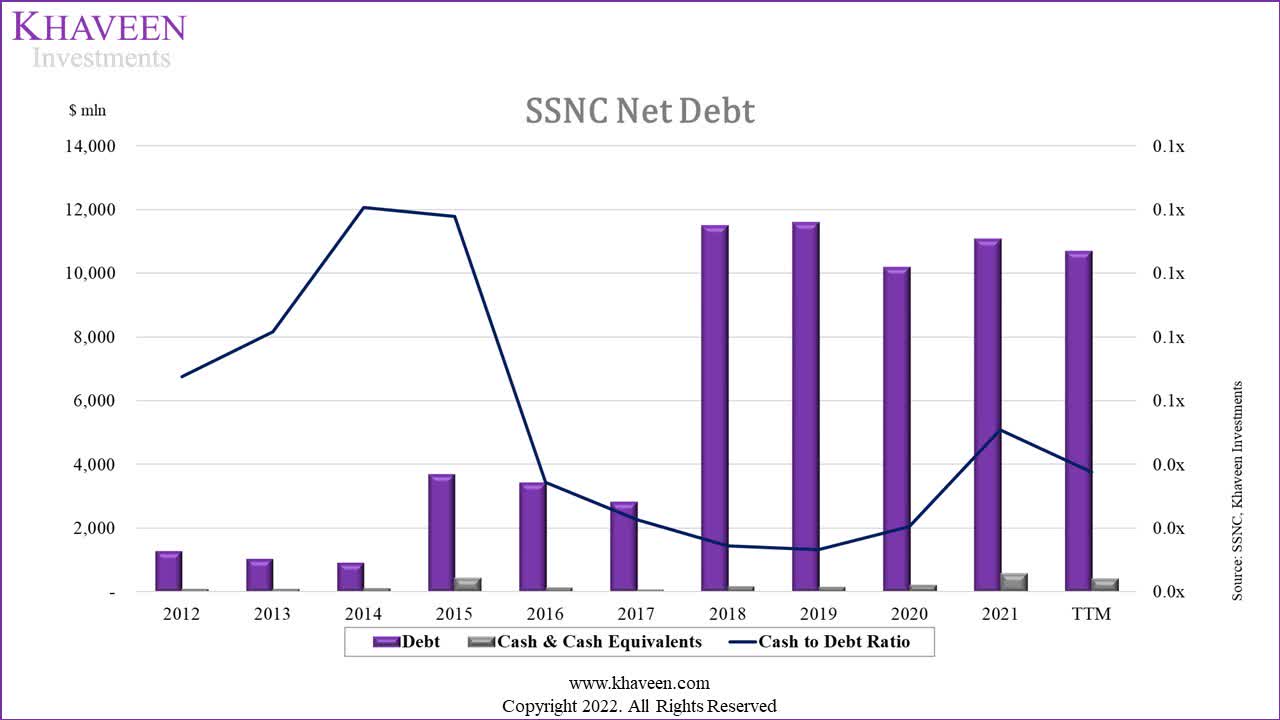
|
Net Debt ($ mln) |
2012 |
2013 |
2014 |
2015 |
2016 |
2017 |
2018 |
2019 |
2020 |
2021 |
TTM |
|
Debt |
1,277 |
1,035 |
908 |
3,685 |
3,432 |
2,826 |
11,486 |
11,588 |
10,179 |
11,081 |
10,680 |
|
Cash & Cash Equivalents |
86 |
85 |
110 |
434 |
118 |
64 |
167 |
153 |
209 |
564 |
402 |
|
Net Debt |
1,191 |
951 |
798 |
3,251 |
3,314 |
2,762 |
11,319 |
11,435 |
9,970 |
10,517 |
10,278 |
|
Cash to Debt Ratio |
0.07x |
0.08x |
0.12x |
0.12x |
0.03x |
0.02x |
0.01x |
0.01x |
0.02x |
0.05x |
0.04x |
Source: SS&C Technologies, Khaveen Investments
Based on the chart above of the company’s net debt, its net debt had increased in the past 10 years driven by higher debt as it fueled its M&A spending from $1.28 bln in 2012 to $11 bln in 2021. Also, its cash-to-debt ratio decreased from 0.07x to 0.05x in the period. Notwithstanding, we modeled the company’s cash to increase to $1.7 bln by 2026 supported by its strong profitability with a 5-year forward FCF margin of 13.2%.
|
M&A Revenue Forecast ($ mln) |
2017 |
2018 |
2019 |
2020 |
2021 |
2022F |
2023F |
2024F |
2025F |
2026F |
|
Number of Acquisitions |
2 |
4 |
2 |
3 |
1 |
5 |
3 |
3 |
3 |
3 |
|
Revenue Per Acquisition |
3.0 |
662.2 |
515.7 |
7.9 |
76.5 |
38.6 |
189.9 |
189.9 |
189.9 |
189.9 |
|
M&A Revenue |
6 |
2,648.7 |
1,031 |
24 |
77 |
193.1 |
474.9 |
474.9 |
474.9 |
474.9 |
|
Acquisition Spending |
17.4 |
7,066.7 |
94.1 |
116 |
-7.3 |
642 |
803 |
803 |
803 |
803 |
|
Acquisition Cost per deal |
8.7 |
1,766.7 |
47.1 |
38.7 |
-7.3 |
321 |
321 |
321 |
321 |
321 |
Source: SS&C Technologies, Khaveen Investments
We forecasted the company’s M&A revenue based on its past 10-year average number of acquisitions per year to forecast its acquisitions through 2026. We also calculated its average revenue and cost per acquisition which we multiplied with its 10-year average acquisitions per year to obtain our M&A revenue and costs through 2026. As seen in the table above, we estimated an average M&A revenue contribution of $474.9 mln from 2023 to 2026.
Stable Organic Revenue Growth Outlook
According to the company’s annual report, it offers financial software to the Finance and Healthcare sectors ranging from…
securities accounting, front-to-back-office operations, performance and risk analytics, regulatory reporting and healthcare information processes.
Based on the company’s earnings presentation, it broke down its organic revenue in 2021 in the following table.
SS&C Technologies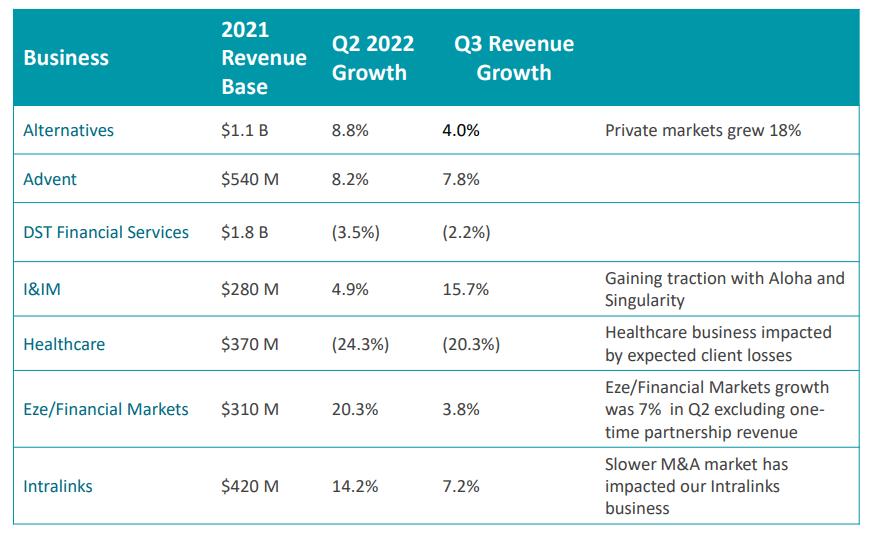
According to the company, its Alternatives business segment includes its GlobeOp product serving 1,300 clients and 12,000 funds with offerings including investor services, middle and back office solutions, NAV production, tax services, audit support, regulatory solutions and managed services. Moreover, the company’s Advent business serves 4,300 clients with accounting, trading and reporting solitons for investment management. Additionally, its DST Financial Services is part of its DST Systems acquisition which serves mutual fund clients with SaaS solutions. Furthermore, its Institutional & Investment Management business also “provides software and services to investment management firms”. The company’s Eze/Financial Markets segment provides solutions ranging from portfolio management, trading, operations, compliance and accounting.
We categorized the company’s segments into their markets in the table below and forecasted its growth based on the market forecast CAGR.
|
SS&C Technologies Revenue ($ mln) |
2021 |
2022F |
2023F |
2024F |
2025F |
2026F |
|
Portfolio Management, Investor Services, Compliance, Accounting (Investment Management Subindustry) |
4.03 |
4.28 |
4.54 |
4.81 |
5.11 |
5.42 |
|
Growth % |
6.10% |
6.10% |
6.10% |
6.10% |
6.10% |
|
|
File Data Storage (Financial Sector) |
0.42 |
0.48 |
0.55 |
0.63 |
0.73 |
0.83 |
|
Growth % |
14.70% |
14.70% |
14.70% |
14.70% |
14.70% |
|
|
Record Processing (Healthcare Sector) |
0.37 |
0.41 |
0.46 |
0.51 |
0.57 |
0.63 |
|
Growth % |
11.30% |
11.30% |
11.30% |
11.30% |
11.30% |
|
|
Other |
0.231 |
0.231 |
0.231 |
0.231 |
0.231 |
0.231 |
|
Total |
5.051 |
5.40 |
5.78 |
6.19 |
6.63 |
7.12 |
|
Growth % |
6.9% |
7.0% |
7.1% |
7.2% |
7.3% |
Source: SS&C Technologies, DataIntelo, Grand View Research, Data Bridge Market Research, Khaveen Investments
Based on the table, the company’s investment management software revenue accounts for its largest revenue segment at 80% of total revenue. This is followed by wealth management, virtual data room and healthcare information processing. Overall, we forecasted its organic revenue growth at a 5-year forward average of 7.1%.
Risk: High Debt Could Limit its Ability to Pursue Larger Deals
One of the risks of the company is its high debt levels with net debt of $11 bln in 2021 and its net debt as a % of market cap was 77.8%. We believe this could limit its ability to pursue large acquisitions as it did in the past such as Intralinks and EZE Software which were acquired by the company for a cost of $1.5 bln and $1.45 bln respectively.
Verdict
|
Revenue Forecast ($ bln) |
2021 |
2022F |
2023F |
2024F |
2025F |
2026F |
|
Organic Revenue |
5,051 |
5,400 |
5,779 |
6,188 |
6,633 |
7,115 |
|
Growth % |
6.9% |
7.0% |
7.1% |
7.2% |
7.3% |
|
|
M&A Revenue |
193.1 |
474.9 |
474.9 |
474.9 |
474.9 |
|
|
Growth % |
145.9% |
0.0% |
0.0% |
0.0% |
||
|
Total Revenue |
5,051 |
5,593 |
6,253 |
6,663 |
7,108 |
7,590 |
|
Growth % |
10.7% |
11.8% |
6.6% |
6.7% |
6.8% |
Source: Khaveen Investments
All in all, we see the company’s total revenue growth at a 5-year forward average of 8.5% driven by organic revenue growth at a 5-year forward average of 7.1% and M&A revenue contributions which we forecasted based on its past 10-year average number of acquisitions per year and average estimated revenue per acquisition for an average M&A revenue contribution of $474.9 mln from 2023 to 2026. However, this is lower than its past 5-year average revenue growth of 32.3% and a 10-year average of 32.6% which we determined to be driven by strong organic growth and large acquisitions but we believe its high debt could limit the company’s ability to pursue large deals going forward.
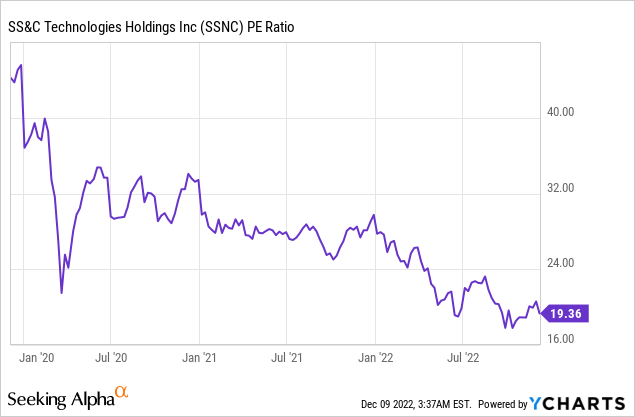
However, we believe the company’s valuations are attractive following the decline of its stock price by 35% in the past year. Furthermore, its P/E ratio had continued to decline since 2020 and stood at 19.36x which is 22% lower than its 3-year average of 24.91x. Based on analyst consensus, the company has a price target of $63.88 which is an upside of 26%, translating to a Buy rating.
Be the first to comment