

undefined undefined/iStock via Getty Images
Investment thesis: The (NASDAQ:SQQQ) offers investors a solid hedging option for portfolios that are primarily comprised of broad-exposure ETFs.
At the beginning of the year, the overall tone of the market changed. The 6-month charts illustrate this observation:
6-Month SPY, QQQ, DIA, and IWM (Stockcharts)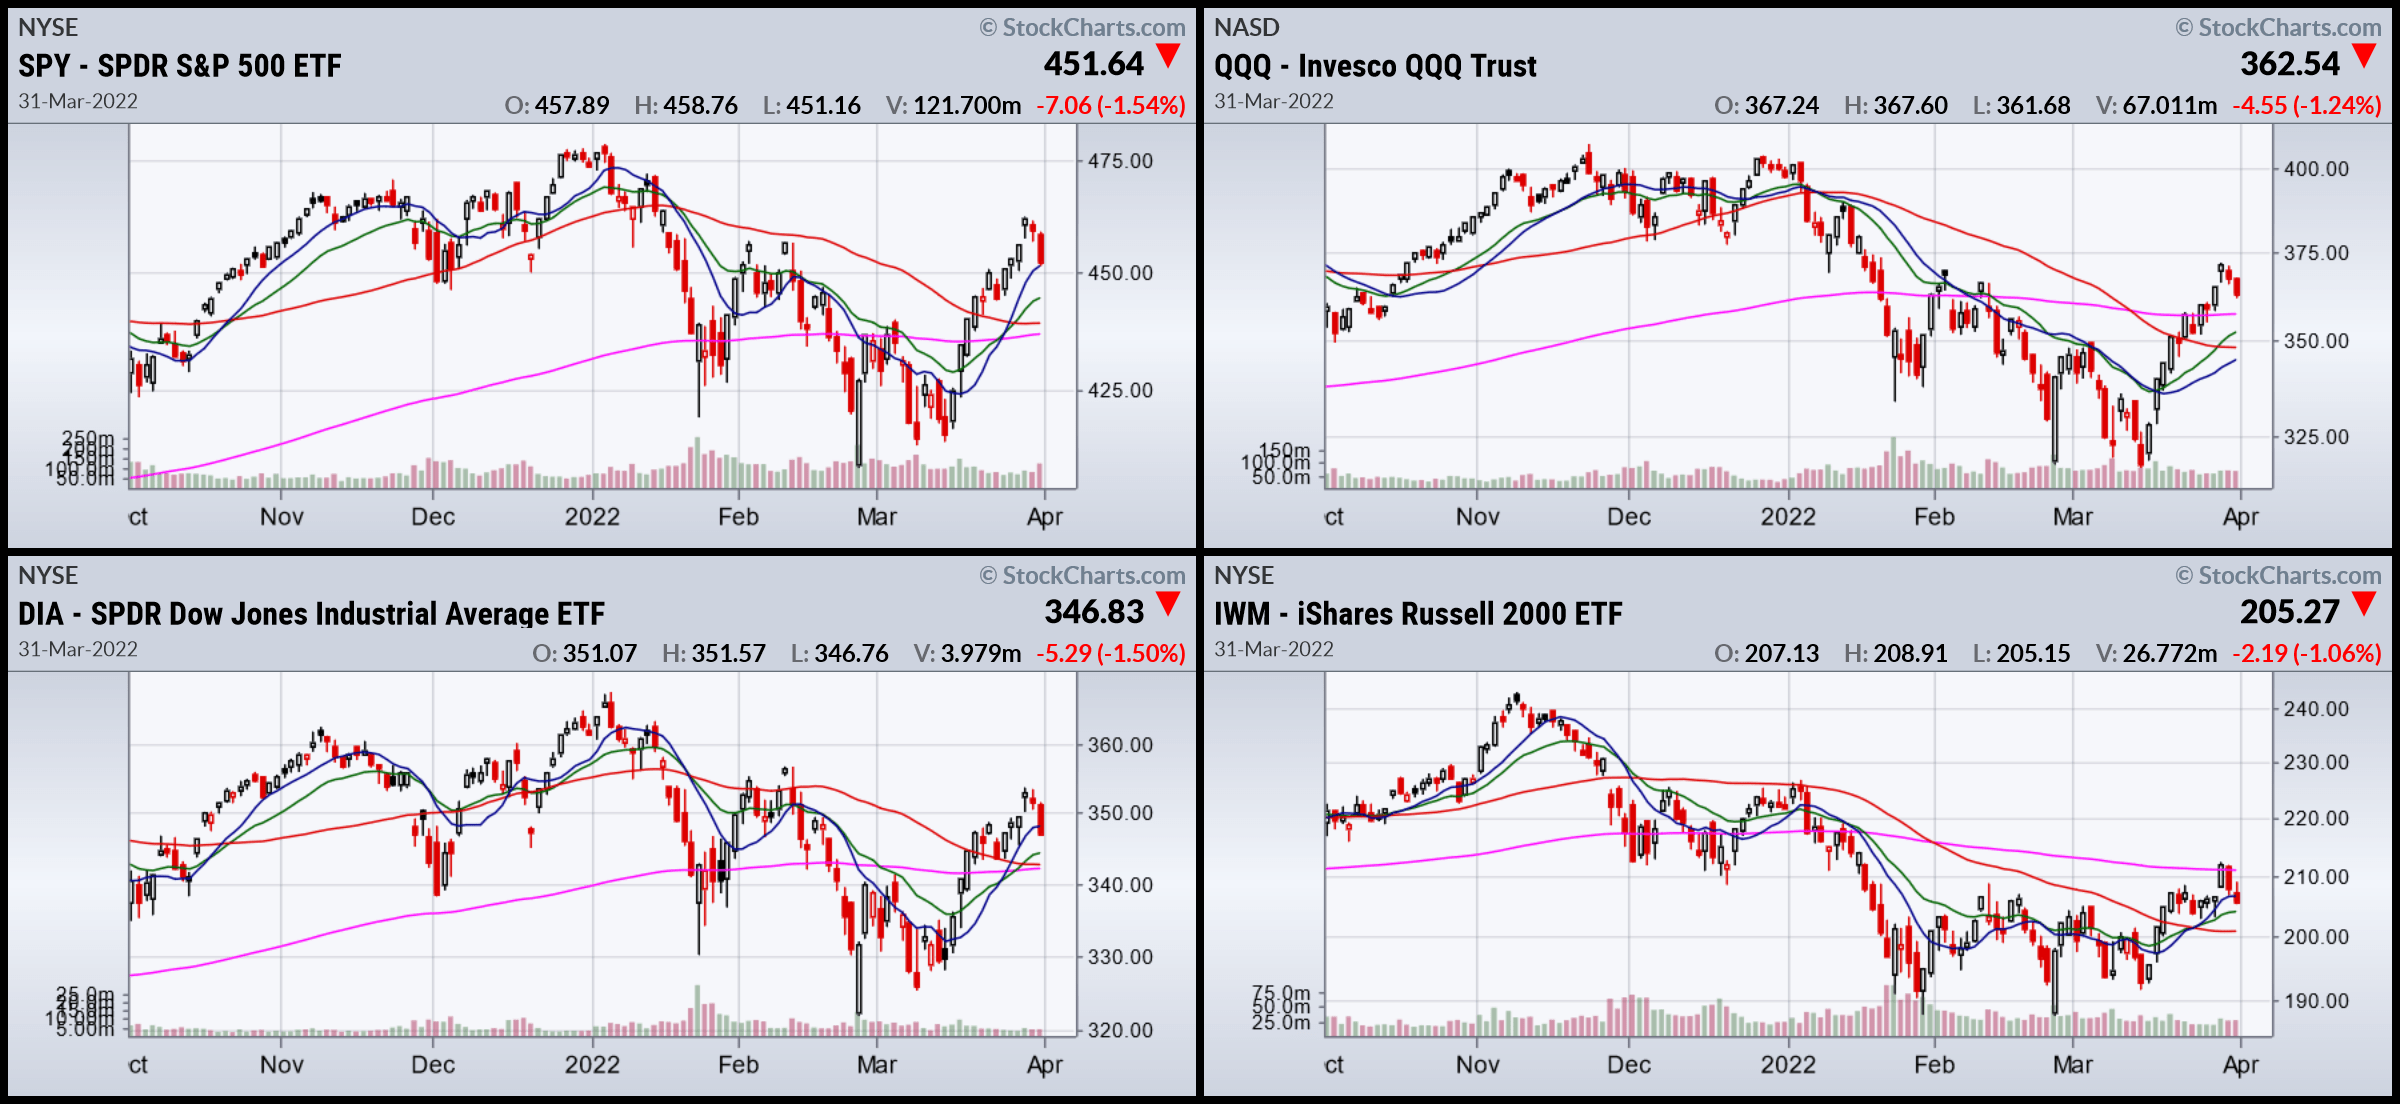
The IWM (lower right; this is a good proxy for the market’s risk appetite) started to drop at the beginning of November. At the beginning of the year, the SPY, QQQ, and DIA followed suit and had fairly sharp drops.
Several factors caused this shift. Probably the most important was the Fed’s policy shift. For most of the last few years, the Fed believed that inflation was transitory. Fed presidents mostly argued that COVID-caused supply disruptions would naturally dissipate as the production came back online. This hasn’t materialized. In fact, the problem has become more pronounced:
Various averages of the Y/Y percentage change in core and total PCE price indexes Various averages of the Y/Y percentage change in core and total PCE price indexes (Data from the FRED system; author’s calculations)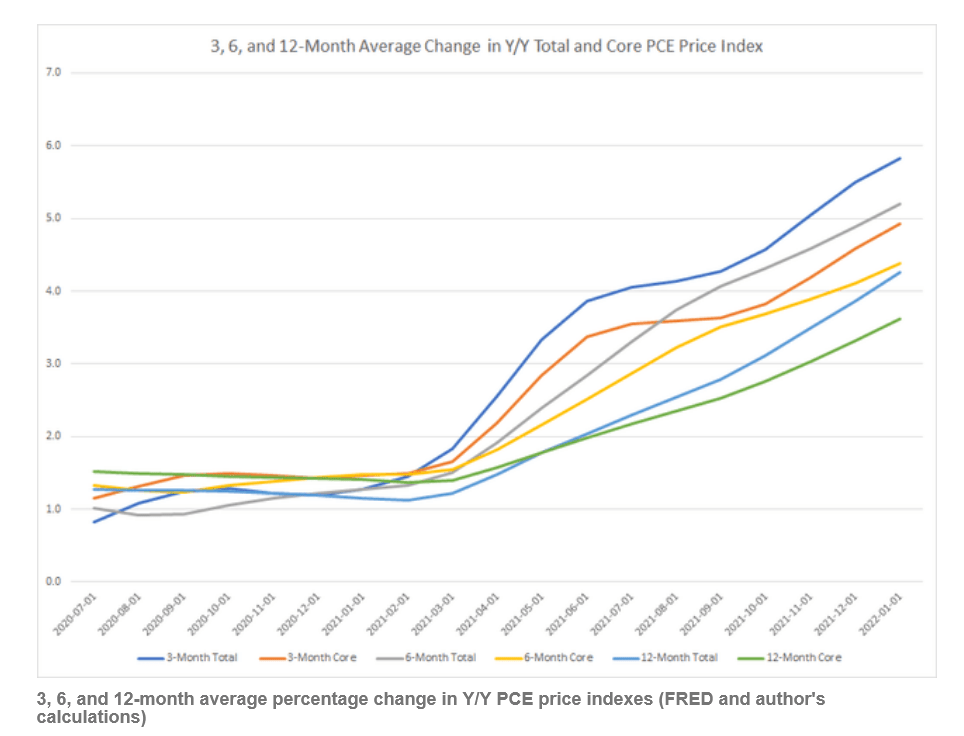
The 3, 6, and 12-month moving averages of the Y/Y percentage change in the PCE price indexes continue to rise. The shorter are above the longer, and none are showing any sign of plateauing. This means that price increases are baked into the data for the next few months at a minimum.
As a result, the Fed has turned far more hawkish.
Dot Plot from December 2021 Meeting (Federal Reserve)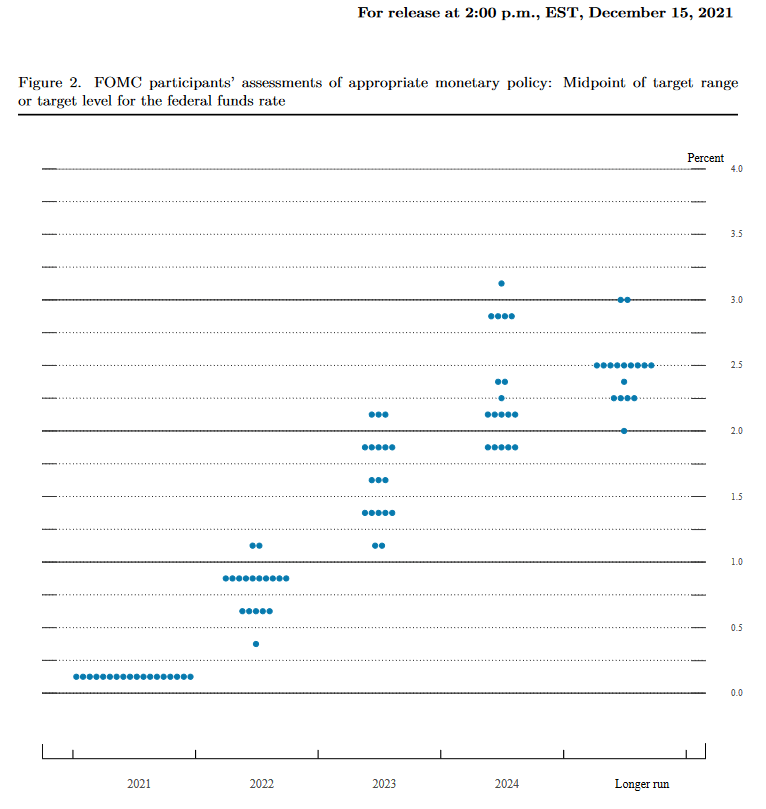
At December’s meeting, a majority of Fed presidents were projecting that rates would be .75%-1% by the end of this year.
Dot Plot from March 2022 Meeting (Federal Reserve)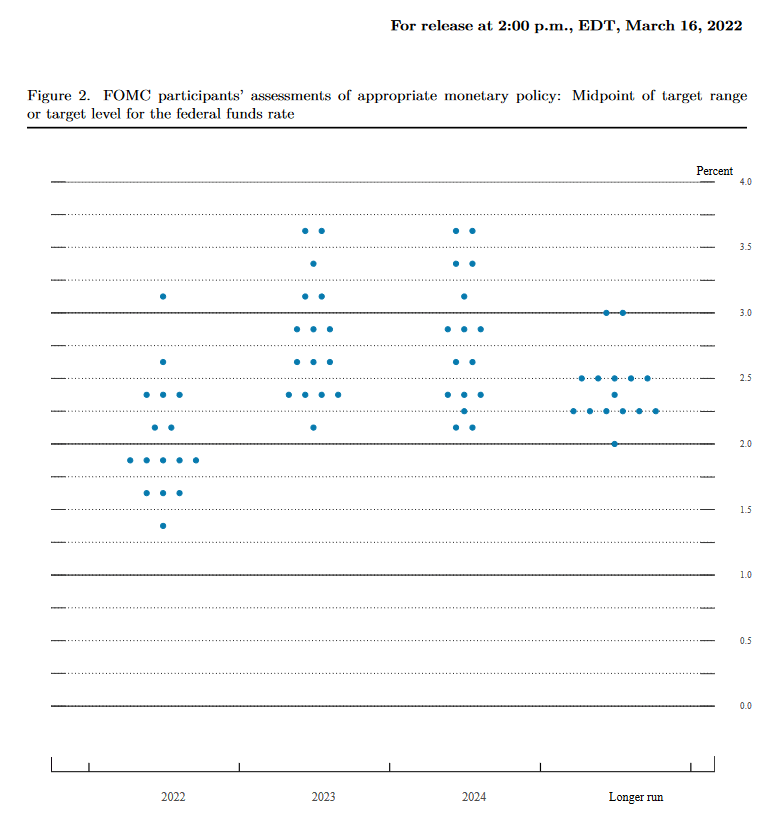
At March’s meeting (three months later), the rate expectations for the end of this year had risen by at least 100 basis points, and, in some cases more.
Moreover, a number of Fed presidents are now advocating for at least one 50 basis point hike in the coming months:
On Wednesday, both Cleveland Fed President Loretta Mester and San Francisco Fed President Mary Daly said they would be open to rate hikes as high as half a percentage point, which is sharper than the quarter-point hike Fed officials announced just last week.
…..
The comments come after Federal Reserve Chair Jerome H. Powell said earlier this week that the Fed could raise rates by 0.50 percentage points in the coming months, if it decided more forceful action was necessary to control inflation. The remarks marked a tougher stance from Powell.
…..
In a matter of months, Fed officials went from penciling in zero interest rate hikes in 2022, to forecasting three, then seven. As recently as February, when St. Louis Fed President Jim Bullard called for a more aggressive approach in the first half of the year, he was generally considered an outlier among his peers.
This is occurring against a backdrop in which financial market indicators are flashing yellow.
Author’s spreadsheet of long-leading, leading, and coincidental indicators (Data from Fred; author’s calculations)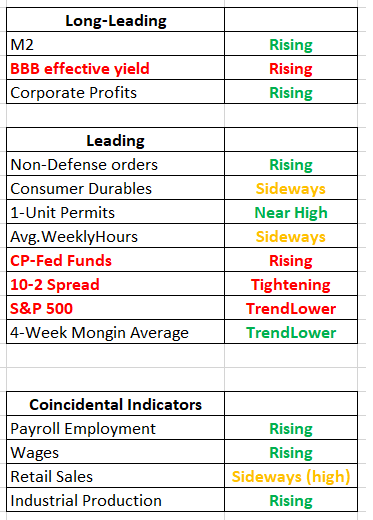
The above table shows that key long-leading and leading indicators are showing a potential recession.
This leads us to a discussion of the (SQQQ) (link for text):
ProShares UltraPro Short QQQ seeks daily investment results, before fees and expenses, that correspond to three times the inverse (-3x) of the daily performance of the Nasdaq-100 Index®.
The (SQQQ) is a hedging ETF. It is designed to rise when the market falls and fall when the market rises.
SQQQ and QQQ performance (Stockcharts)
The blue line is the QQQ, while the black line is the SQQQ. Notice they move in near opposite unison.
Here’s the same data expressed in chart format:
SQQQ’s performance (Proshares)
As this data from Proshares notes, the index has a -.99 correlation.
How should an investor use the SQQQ? Its purpose is to balance out a portfolio composed of broad-based ETFs. For example, if an investor has a standard 60/40 (QQQ/TLT) portfolio, he could add the SQQQ as a way to minimize the impact of declines in the QQQ.
This column will not recommend a specific allocation. That is entirely dependent on the make-up of each specific portfolio. The reader is strongly encouraged to seek the advice of an investment professional who has the tools to calculate specific percentage allocations. For those of you who are doing it yourself, consider a website such as PortfolioVisualizer.
Be the first to comment