


tumsasedgars
Investment Thesis
This year, I’ve cautioned readers about investing at the extremes. That means avoiding ultra-low-volatility and low-growth ETFs in case of a market rebound, keeping profitability reasonably high by sticking with large-cap stocks, and being careful with high-dividend portfolios that may be value traps. That brings me to the SPDR Portfolio S&P 500 High Dividend ETF (NYSEARCA:SPYD), a staple for many high-yield investors due to its affordable 0.07% expense ratio and 3.98% trailing dividend yield. SPYD has excelled this year, declining just 0.75% on total returns compared to 16.24% for the SPDR S&P 500 ETF (SPY).
While dividends are the draw, you may wonder how SPYD compares against other high-dividend ETFs like the Schwab U.S. Dividend Equity ETF (SCHD) and the Vanguard High Dividend Yield ETF (VYM). SPYD has its fair share of “extremes,” including low growth, below-average profitability, and a disappointing long-term track record. Today, I mainly want to inform readers of these shortcomings and discuss who should and shouldn’t be investing in this ETF.
ETF Overview
Strategy
SPYD tracks the S&P 500 High Dividend Index and follows a simple strategy. The 80 highest dividend-paying companies in the S&P 500 Index are held in equal weight, with rebalancings occurring on the last business day of January and July. SPYD has a 0.07% expense ratio, manages $7.89 billion in assets, launched over seven years ago, and has a 3.98% trailing dividend yield. Furthermore, its 0.02% median bid-ask spread indicates it’s an efficient and liquid ETF, especially since it only holds large-cap securities.
Sector Exposures and Top Holdings
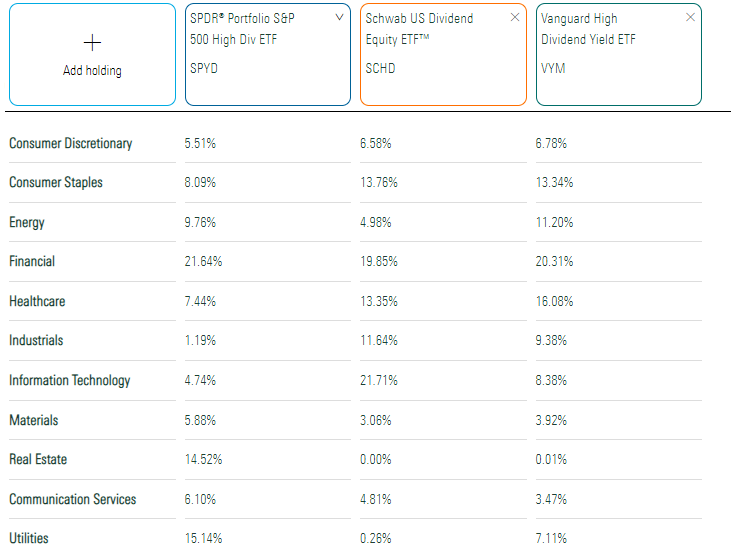
SPYD is unique in that its Real Estate exposure is nearly 15%. Iron Mountain (IRM) is the only one currently in the top ten, but there are 11 others across the Retail, Specialized, Health Care, and Office REIT industries. Investors may appreciate the simplicity of always owning the highest-yielding large-cap REITs rather than managing an additional ETF.
Morningstar
SPYD also holds 12 Utility stocks totaling 15.14%. Specifically for SCHD shareholders, it’s clear that SPYD is a solid complement, at least from a diversification perspective.
SPYD’s top ten holdings are below, though this may not be very helpful because it’s equal-weighted. These holdings are only the best performers since the last rebalancing date, and as mentioned previously, they will change in less than two months. Gilead Sciences (GILD) trades 25.51% above its 100-day moving average and is approaching its 52-week high price. Cardinal Health (CAH), another low-beta stock, has seen its forward dividend yield reduce to just 2.56% after a 60% price return over the last year. Finally, Chevron (CVX), Exxon Mobil (XOM), and Phillips 66 (PSX) lead the Energy sector and have done an excellent job this year as inflation hedges.
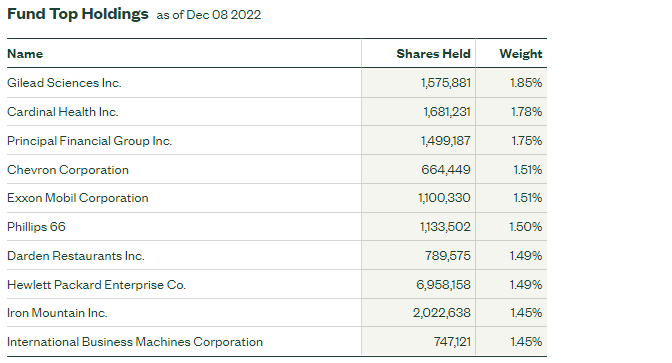
State Street
Performance
While not crucial to my analysis, it’s worth noting that SPYD’s track record isn’t strong. Since November 2015, SPYD gained an annualized 8.68% compared to 10.23% and 13.28% for VYM and SCHD. Somewhat surprising is SPYD’s 19.01% annualized standard deviation, leading to poor risk-adjusted returns (Sharpe and Sortino Ratios).
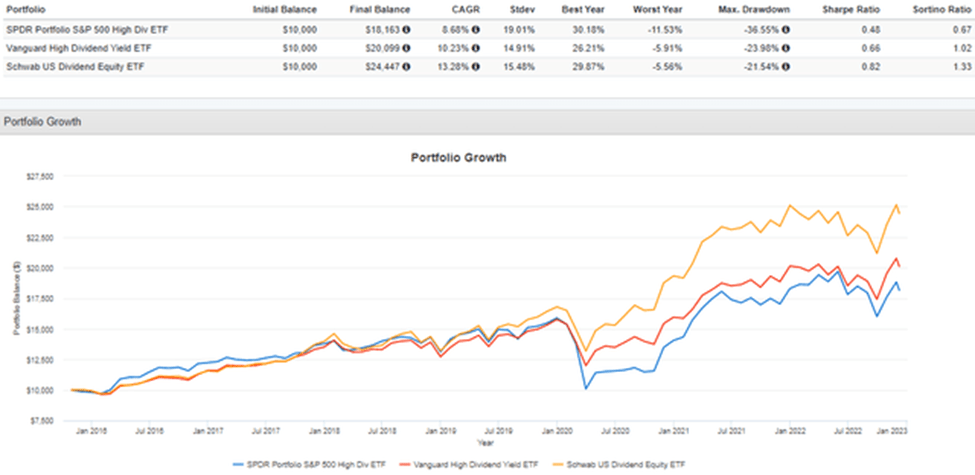
Portfolio Visualizer
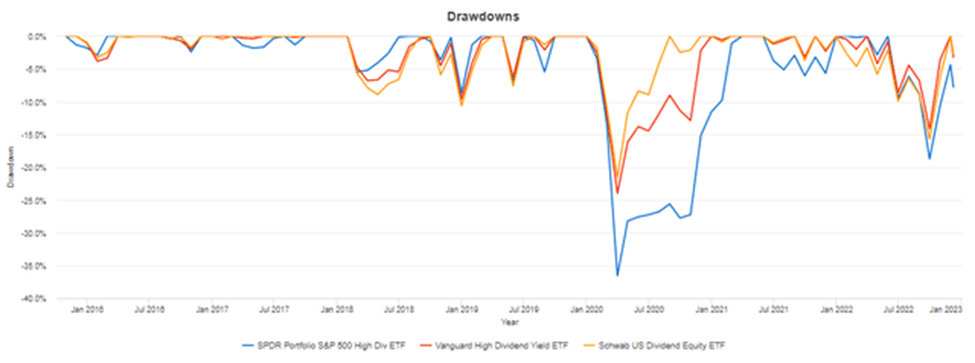
To alleviate concerns about cherry-picking the comparators, I compared SPYD’s three- and five-year risk-adjusted returns with 100 large-cap dividend and value ETF peers. SPYD ranked just 95th and 81st best on those two metrics. The terrible 36.55% Q1 2020 drawdown and subsequent slow recovery depicted in the graph above is the primary source for these results. To learn more about this ranking system, please read my analysis on SCHD.
I don’t rely much on long-term charts because market conditions change. Except for this year and Q1 2020, SPYD has traded in a mainly bullish market, for which it’s not well-designed. As market sentiment declined and it was clear the most richly-valued stocks were the primary targets, SPYD and other high-dividend ETFs were excellent alternatives. Despite my February warning about SPYD’s low growth problem, it’s held remarkably well this year. The graph below shows a decline of 3.10% compared to 10.82% for SPY. Meanwhile, SCHD and VYM realized small gains.
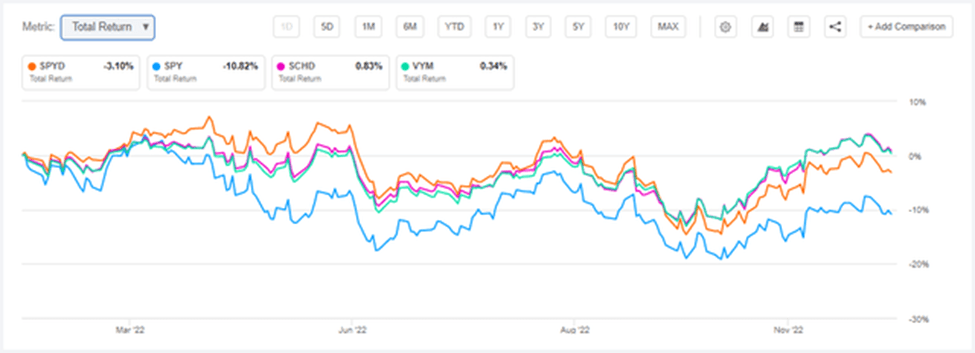
Seeking Alpha
ETF Analysis
Ranking SPYD
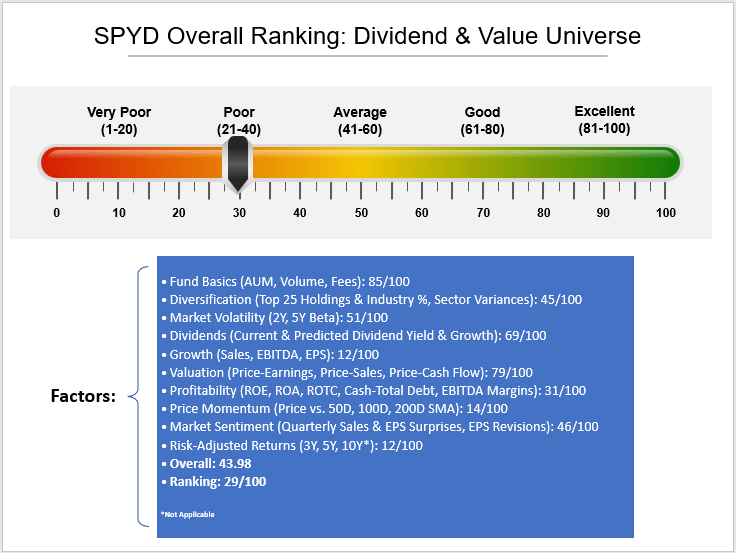
I’ve preferred high-dividend ETFs nearly all this year, but I want to emphasize that there’s much more to a portfolio than how much it yields. My favorite ETFs score well on several features and, thus, are better prepared for various market conditions. In February, I underestimated how little the market cared about growth rates, but that will not last indefinitely. High-dividend investors should also care about the factors their funds don’t screen for, and that’s why I developed a comprehensive ranking system for the ETFs I track. Below is an overview of how well SPYD scores on 30+ factors across ten categories.
The Sunday Investor
This analysis reveals SPYD’s main strengths compared to its dividend- and value peers are that it’s a large, liquid, and cheap fund. Its dividend ranking is good at 69/100, meaning that only 31 ETFs have better dividend yield and growth features. Valuation is also strong at 79/100, so as long as markets favor that factor, SPYD should continue to do well. However, this analysis also reveals some weak points. I’ve mentioned weak growth (12/100) and poor historical risk-adjusted returns, but SPYD also has a profitability problem (31/100) and potentially a price and market sentiment problem. The average score is 43.98/100, which is only the 29th best. Let’s look closely at the fund by industry to see what else we can learn.
Industry Snapshot
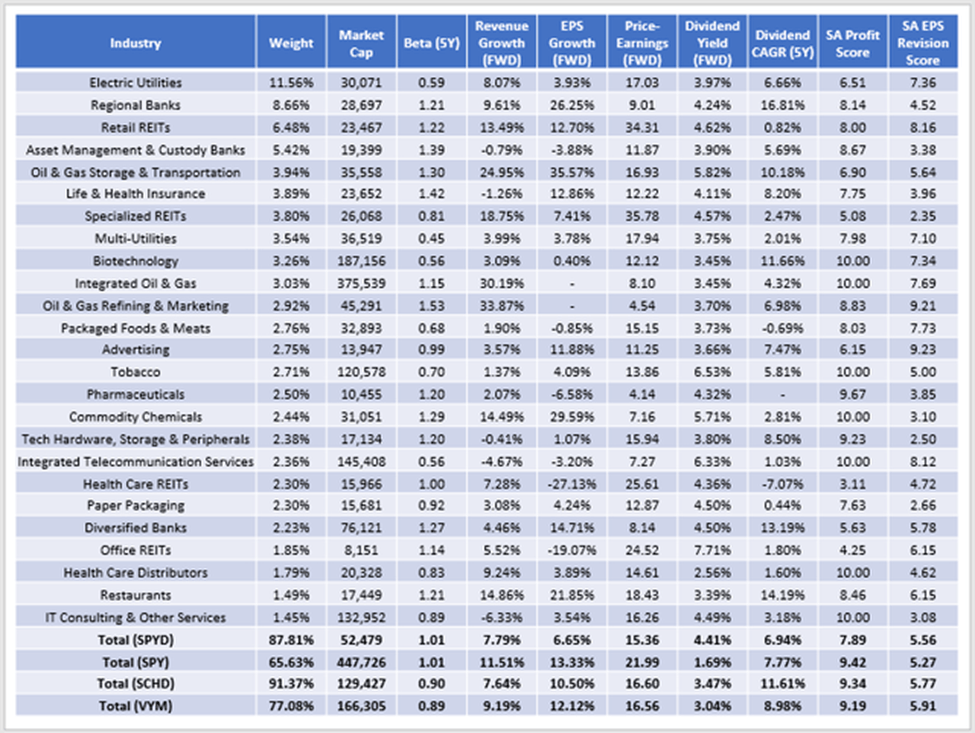
The following table highlights selected fundamental metrics for SPYD’s top 25 industries. For easy comparison, the summary metrics are in the bottom rows for SPYD, SPY, SCHD, and VYM.
The Sunday Investor
I want to link SPYD’s relatively low $52 billion market capitalization with its poor 7.89/10 Profitability Score. Seeking Alpha measures this score in various ways, but one example is SPYD’s 8.67% weighted-average return on total capital. The difference is stark compared to the 16.85% and 13.72% figures for SCHD and VYM, which also have higher overall Profitability Scores of 9.32/10 and 9.19/10. If you go the high-dividend route, you should be selective with low-profit industries like Electric Utilities, which make up 11.56% of the portfolio. Holdings like Southern Company (SO) and Duke Energy (DUK) yield around 4% and have “A” Seeking Alpha Profitability Grades. In contrast, Entergy (ETR) and Pinnacle West Capital (PNW) are some less-profitable examples.
A downside to SPYD is that its five-year beta is 1.01, suggesting no downside protection benefits over the medium term. REITs and Energy add to the overall risk. These additions serve a purpose and aren’t necessarily a bad thing. However, high-dividend investors often have lower risk tolerances. A significant decline may occur in a bear market, like early 2020.
Next, I’d like to turn to growth. SPYD’s estimated sales and earnings growth rates are 7.79% and 6.65%. In particular, the earnings growth is even behind SCHD’s, which was one of my criticisms of that top-performing dividend ETF. Low growth is an issue because, without it, dividend growth is (or at least should be) limited. If you have companies raising dividends at an irresponsible rate, eventually, it will show up in the share price. Low growth also means low participation in a market rebound. The following drawdowns chart shows how SPYD is usually slower to recover than SCHD and VYM. SPYD’s 12/100 growth ranking is why.
Portfolio Visualizer
Finally, SPYD’s 15.36x forward earnings valuation is a strong point. I think valuation will continue to matter next year, so there’s a good chance the ETF will perform relatively well. SCHD and VYM are slightly more expensive at 16.60x and 16.56x, but the balance is better with these funds.
Dividend Analysis
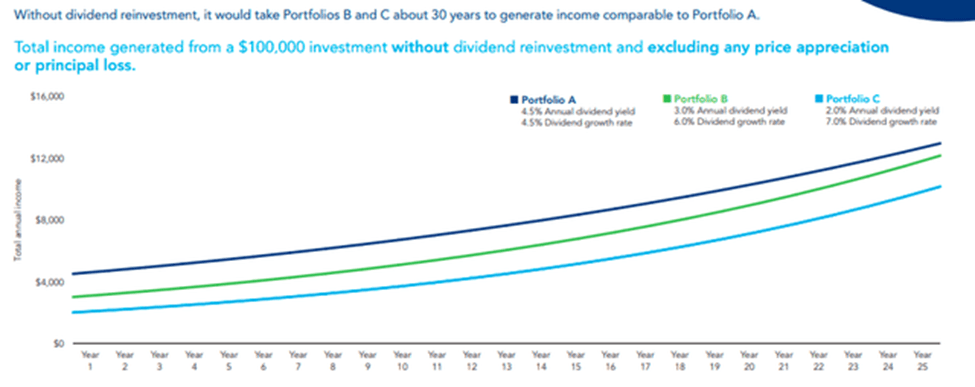
SPYD is a high-dividend fund, so let’s examine its dividend features next. I recently reviewed the Federated Hermes U.S. Strategic Dividend ETF (FDV), and included in that fund’s research materials was a graph highlighting the importance of a high starting dividend yield.
Federated Hermes
The exclusion of any price appreciation or principal loss is misleading, but the point is clear. A low-yielding, high-dividend growth portfolio has much catching up to do compared to a high-yielding, low-dividend growth portfolio. In the example above, Portfolios B and C need 30 years to generate the same yield on cost as Portfolio A.
I’ve done the same calculations in the following graph for SPYD, SCHD, and VYM, using each fund’s current holdings’ dividend yield and growth rates. Assuming these rates hold, a $10,000 investment would produce $577 annual income in five years compared to $538 and $439 for SCHD and VYM. However, as you extend your time horizon, SPYD falls behind substantially.
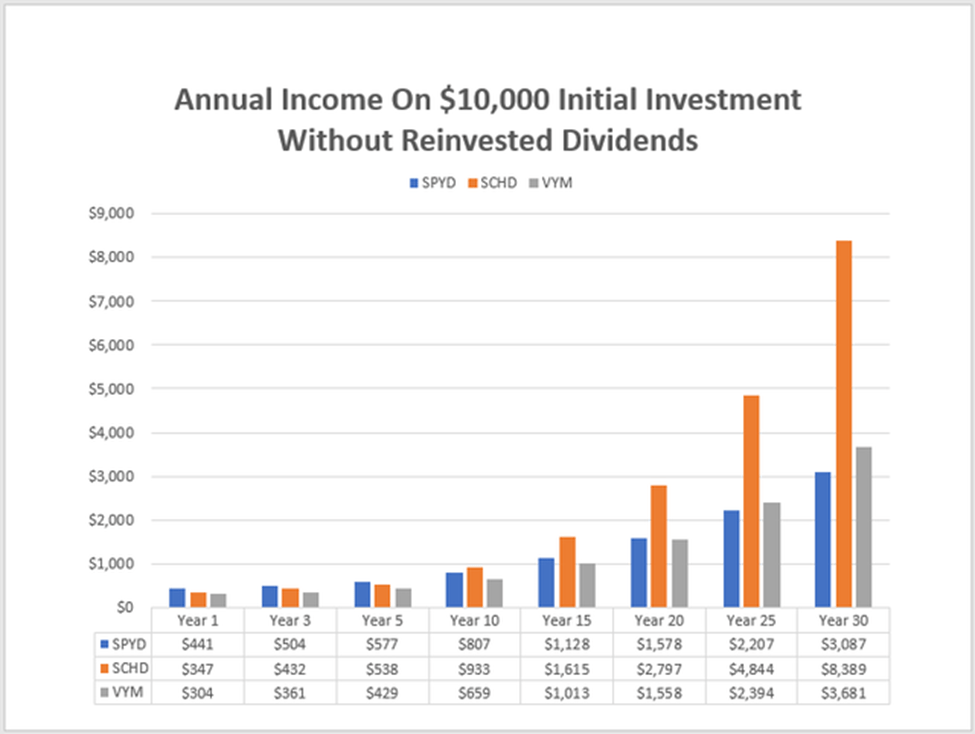
The Sunday Investor
Next, let’s look at SPYD’s top 25 holdings from a dividend perspective. I’ve provided summary metrics for SCHD and VYM in the bottom rows.
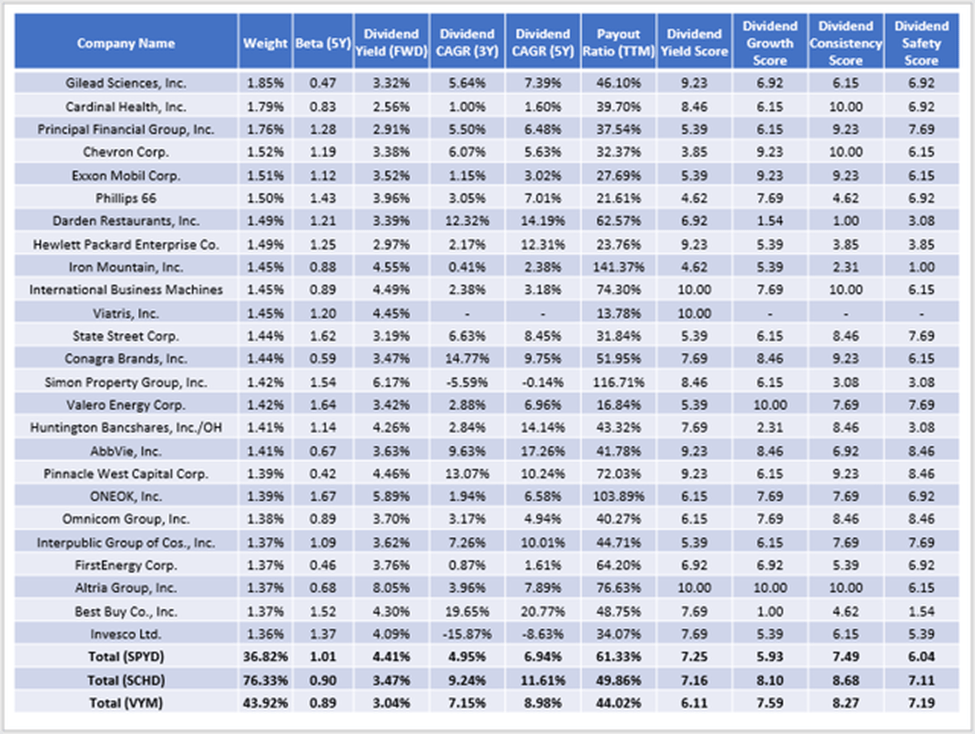
The Sunday Investor
SPYD’s holdings yield 4.41% (4.34% net), which is a nice improvement over the ETF’s trailing 3.98%, even after adjusting out fund expenses. The estimation also aligns with previous quarterly distributions, as the 3.98% yield includes a paltry $0.1276/share payment last year. As I predicted in February, that payment ended up evening out the next quarter. However, after this month’s distribution, you can expect SPYD’s trailing dividend yield to be above 4.50%, likely generating new interest. That said, don’t get too caught up in posted yields. The best estimation of yield comes from analyzing an ETF’s current holdings.
Seeking Alpha
The earlier table noted that SPYD’s dividend payout ratio is 61.33%, which is high. However, that number is skewed by irrelevant payout ratios listed for REITs. Excluding SPYD’s 12 REIT holdings, the payout ratio falls to a more reasonable 49.73%. However, Seeking Alpha’s 6.04/10 Dividend Safety Score indicates its dividends are less safe vs. SCHD and VYM. The Dividend Growth and Dividend Consistency scores are also weaker, reinforcing my point that SPYD is most appropriate for investors with short time horizons.
Investment Recommendation
This article demonstrated why SPYD isn’t an ideal dividend ETF except for investors with short time horizons. Compared to other ETFs in its category, SPYD has poor estimated sales and earnings growth and low overall profitability that will limit dividend growth going forward. There’s also a potential issue with its 1.01 five-year beta that may not offer as much downside protection that conservative dividend investors typically need.
However, its estimated 4.34% dividend yield is a headline-grabber, and SPYD trades at an attractive 15.36x forward earnings. Indeed, if valuation continues to be at the forefront of investors’ minds in 2023, SPYD will perform well. However, so will other dividend ETFs like SCHD and VYM, and they’re better suited than SPYD for a wider variety of market conditions. Therefore, I’m maintaining my neutral rating on SPYD and look forward to discussing this ETF further in the comments below.
Be the first to comment