

DNY59
Tis the season…
The media is currently awash with endless predictions on what the next calendar year will bring. This year, the crowd is harboring an almost universal expectation of an economic slowdown that will usher in a recession sometime next year. That’s a relatively easy call, given that the Fed has all but taken out a Super Bowl ad telling us that’s what will be necessary to curb inflation. The only real questions are when, how long and how deep, and there is no shortage of guesses as to those parameters.
John Higgins, Chief Markets Economist at Capital Economics, believes we will see a new cyclical low in stocks by the spring of 2023 as a shallow recession gets underway in the US, before rebounding to end next year higher than it is now. David Solomon, CEO of Goldman Sachs holds a 35% probability that the economy can tiptoe past the dangers of a recession by eking out positive growth of 1%. That, however, is his best-case estimate, with the other 65% probability being that we will fall into negative growth for at least a couple of quarters next year. Harvard Economist Jason Furman calls for an incomplete outcome on inflation in 2023 leading to a second round of tightening in 2024. And, of course, Professor Nouriel Roubini (a.k.a. Dr. Doom) believes we could have “a variant of another Great Depression”.
The Fed, itself, told us to expect “tepid growth” next year with a rousing .5% GDP increase for the year. More importantly, it said that it expected the discount rate to top out at 5.25% but that the inflation target of 2% would not expectedly occur until 2025. That says the Fed will not chase inflation with ever higher interest rates, but will likely keep them over 5% for most of the next couple of years. That’s a very different scenario than the one some folks are predicting where the Fed starts backing off interest rates in the second half of 2023 to spur the growth that it just reduced.
You can pick your favorite guess from pundits and economists, but remember that they are just that – guesses. And while they may come from educated and experienced people, they are widely varied and most will be proven wrong. Rather than put your faith in anyone’s guess, it might pay to understand how stocks perform in recessions to have some statistical context in which to evaluate any of these scenarios relative to your portfolio and risk tolerance.
Investors’ lament
Everyone knows that slower or negative growth in the economy will depress stock prices but the two are neither coincident nor highly correlated. Unfortunately, our biases tend to cause us to either overreact at the wrong time or underreact and suffer the consequences. As investors, we are obsessed with knowing what is likely to happen, but only a rare few of us will ever be successful at converting that knowledge into performance alpha. Oh, and that includes advisors and managers as well.
First, by definition, no one can officially announce that we are in a recession until we have completed the obligatory two quarters of lower GDP. That’s 180 days or so from the time it starts, not including the slowing, but still positive, growth that preceded the recession horizon. Thus, we all know intellectually that once the economists and the media have pronounced that we are in a recession, the market will have long since reacted to that eventuality and that selling at that point will likely represent a grossly ill-timed strategy. Those who wait until the recession is a ‘fait accompli’ in order to be certain that they need to take action will likely suffer investors’ lament.
Perspectives from the last 15 recessions
The table below was compiled from several different sources and is designed to compare the declines in stocks associated with the last 15 economic recessions. From this information, one may draw the following observations:
- All 15 recessions had an “associated” decline in stock prices. However, the declines in stock prices do not coincide with the actual recession dates. They generally start months before the recessions do and put in their lows months before the recession ends. (The COVID recession was a rare exception because the recession was extremely short. The low in stock prices came six weeks after it ended.)
- Recession-related stock declines averaged -28.3% with four of the 15 dropping over 40%. In other words, they represent serious corrections.
- Declines during recessions averaged only -12.8%, which could produce a false impression of the damage they tend to cause to stock valuations. Six of the 15 recessions actually saw a rise in stock prices during the actual event.
- As such, using a statistic like the -12.8% number above results in the misleading notion that recessions only cause mild downturns in stocks.
- Stock performance during the recession is irrelevant anyway because you don’t know when the recession starts or ends until several months after the fact.
- The key to adjusting one’s portfolio for a recession is in understanding how much in advance the stock market will begin anticipating it and when during the recession the final low will occur.
- Stocks began declining between 1-9 months ahead of the actual recessions of the past. Recession-related lows in stocks occurred from 1-10 months prior to the end of the recession.
|
Recession period |
S&P Performance during Recession |
S&P performance peak-to-trough |
How long the peak precedes the recession |
How long the low precedes the end of recession |
Causes |
|
8/29 – 3/33 |
-81% |
-82% |
-1 mo |
1 mo |
Banking panic, stock market crash, gold standard, tariffs, and more |
|
5/37 – 6/38 |
-44% |
-51% |
2 mos |
2 mos |
Fiscal and monetary tightening |
|
2/45 – 10/45 |
+20% |
-5% |
-1 mo |
7 mos |
Decline of government spending after WW II |
|
11/48 – 10/49 |
-7% |
-19% |
1 mo |
4 mos |
Monetary tightening |
|
7/53 – 5/54 |
+17% |
-14% |
5 mos |
8 mos |
Korean war |
|
8/57 – 4/58 |
-12% |
-20% |
1 mo |
5 mos |
Monetary tightening |
|
4/60 – 2/61 |
+11% |
-13% |
3 mos |
5 mos |
Monetary tightening |
|
12/69 – 11/70 |
-11% |
-14% |
1 mo |
10 mos |
Monetary tightening and Viet Nam war |
|
10/73 – 3/75 |
-25% |
-46% |
– 1 mo |
4 mos |
OPEC oil embargo |
|
1/80 — 7/80 |
+8% |
-16% |
-1 mo |
4 mos |
Monetary tightening |
|
7/81 – 11/1982 |
+3% |
-27% |
9 mos |
3 mos |
|
|
7/90 – 3/91 |
+2.5% |
-18% |
1 mo |
5 mos |
Persian Gulf crisis and Savings & Loan collapse |
|
3/01 – 11/01 |
-15% |
-27% |
6 mos |
7 mos |
Followed dotcom bust |
|
12/07 – 6/09 |
-38% |
-56% |
5 mos |
3 mos |
Mortgage crisis (worst contraction since Great Depression) |
|
2/20 – 4/20 |
-20% |
-17% |
-1 mo |
-1 mo |
COVID recession |
|
2023? |
? |
? |
Monetary tightening |
Source data from Forbes, Macrotrends, and Wikipedia
What does this mean for SPY
Here are my main takeaways regarding SPY and the upcoming recession.
- SPY declined for 10 months into October 2022 so far. That is already a record length of time for anticipating a coming recession. Therefore, my take is that the 2022 decline was more about rate hikes and has not yet priced in a recession next year. (Several economists echoed this possibility.)
- Since everyone knows a recession is coming, but not how long or deep it will be, the market rally off the October low should not be taken as the final low. The final low will likely come sometime next year. That said, it may or may not necessarily exceed the October 2022 low. (In the 1973-5 recession, a low was put in during October ’74 and retested in December ’74.)
- A likely scenario for the first half of 2023 is a wide trading range in which the market sells off when the Fed is hawkish or inflation is stubborn and rallies when the Fed is dovish or inflation abates, but that it does not put in a final low until it is clear that inflation has come down and rates will not rise further.
- Those who think the Fed will back off next year and issue rate cuts to counter a recession are probably fooling themselves. They will not want to play yo-yo with the economy. This looks like a “higher for longer” scenario as far as rates are concerned. None of us can expect to second-guess the Fed, but their bias will likely be to keep rates higher until inflation backs off beyond the point of no return. The last thing they will want to do is destroy their credibility by dropping rates too soon and then having to raise them again later.
- The current rate rise is not just to fend off inflation. The Fed is actually trying to ‘normalize’ rates again and sell assets off its bloated balance sheet. Normal is not zero rates and the economy cannot be successfully managed by monthly back-and-forth changes in interest rates. The idea that the Fed is going to lower rates toward zero anytime soon again is the wishful thinking of those who haven’t lived long enough to have experienced anything else.
- An increase in tax-loss selling might occur this year, which would dampen the Santa Claus rally. Bear in mind that the average Santa Claus rally is only something like .38% positive, so if you blink, you might miss it altogether.
- I see the rally from October as an oversold bounce based on the false premise that 7.1% inflation is worth celebrating. It is doubtful the market will go back anywhere near the previous highs until we can see a significant reduction in inflation. If not, then we need to get used to interest rates where they are or even slightly higher for a period of time.
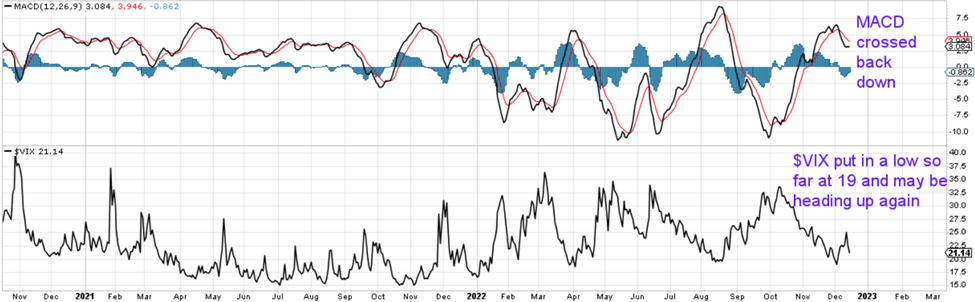
- My interpretation of the technicals is that they are not very positive as shown in the charts below.
SPY 15-minute chart (StockCharts.com) SPY 15-minute MACD (StockCharts.com)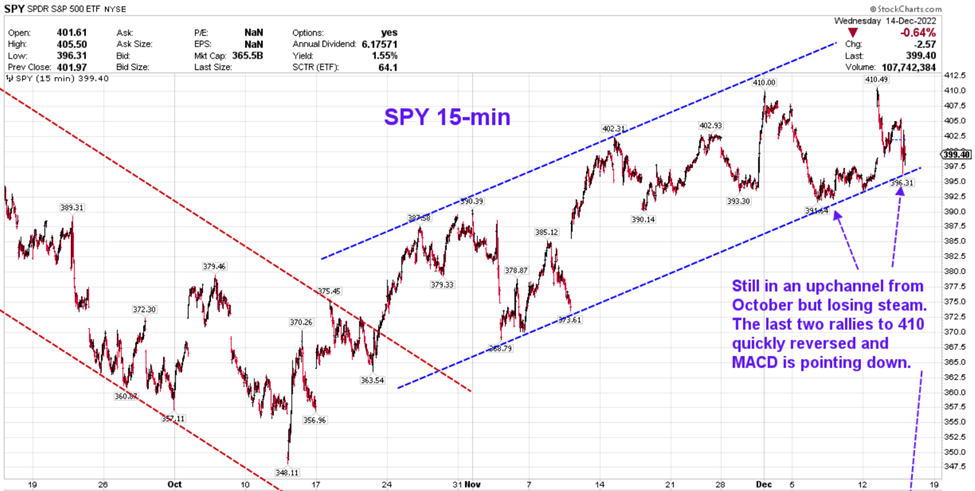
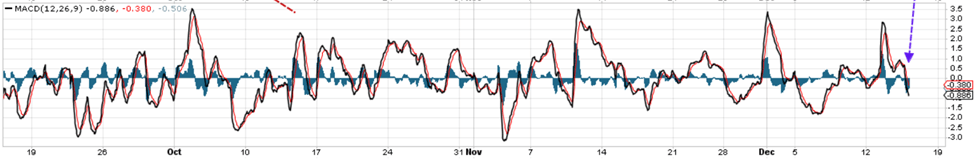
SPY Daily Chart (StockCharts.com) SPY Daily MACD and $VIX (StockCharts.com)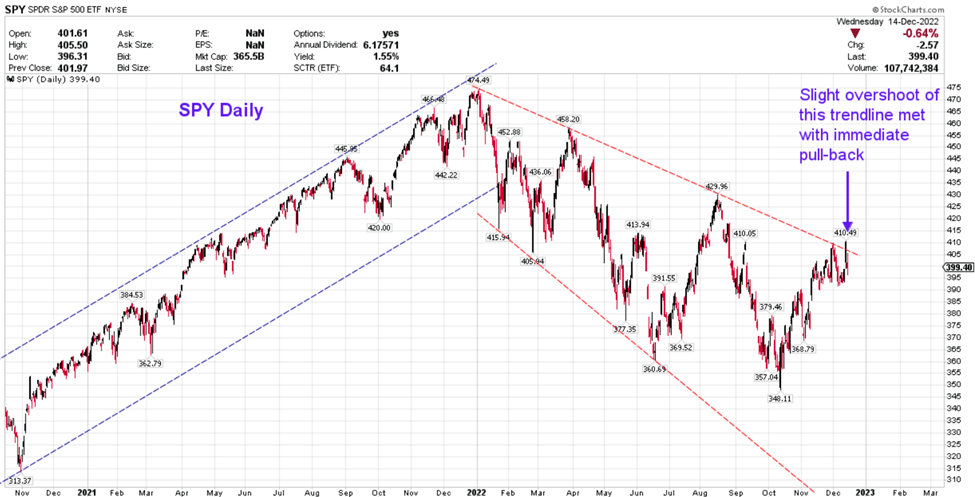
Be the first to comment