

John Kevin/iStock via Getty Images
The recent selloff was due to the liquidity shock
Long-stocks should be the default position – except when one of these risks emerges: 1) the liquidity risk selloff (like in 1987), 2) the imminent recession selloff (any recessionary bear market), or 3) the credit crunch (like in 2008).
The most recent selloff (for the total of -24% peak to bottom) was the liquidity risk selloff. Specifically, as I explained last week, the rising expectations of very aggressive monetary policy tightening since the beginning of 2022 reduced the liquidity in short term bonds, which further reduced the liquidity in S&P500 futures (SPX) and, thus, caused the bear market.
The rising expectations of monetary policy tightening were due to the Fed’s error in predicting that the post-pandemic inflation was transitory, and thus failed to remove the monetary policy stimulus in time. As a result, the Fed is now expected to fix the error expeditiously and aggressively hike the Federal Funds rate at least to the neutral level (or above).
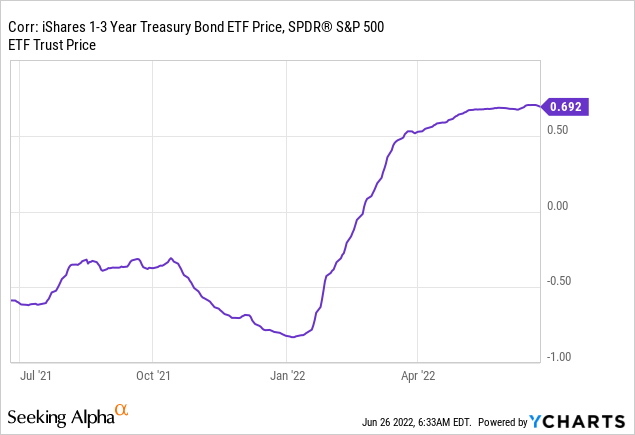
Since beginning of 2022, the rising short term yields (reflecting rising monetary policy tightening expectations) were highly correlated with falling stock prices. Here is the chart showing the correlation between the short-term bond ETF (SHY) and the S&P500 ETF (NYSEARCA:SPY). The correlation was rising since beginning of 2022, and it peaked at a very high level at around 0.70, which supports the liquidity selloff thesis.
The liquidity shock peak has likely passed (and the summer rally has begun)
The potential peak in liquidity shock can be traced to the overreaction to the May CPI report, which caused the potential peak in monetary policy tightening expectations (the week ending on June 17th)
Last week, those aggressive monetary policy expectations were significantly reduced. Based on the CME Federal Funds futures data, the GAV Report shows that the Fed is now expected to hike to 3.41% by the end of 2022 (instead by 3.67%). More importantly, the Federal Funds rate is now expected to reach the peak by April 2023 at 3.52% and then the Fed is expected to start cutting the interest rates in November 2023 down to 2.57% by July 2024.
Global Academic View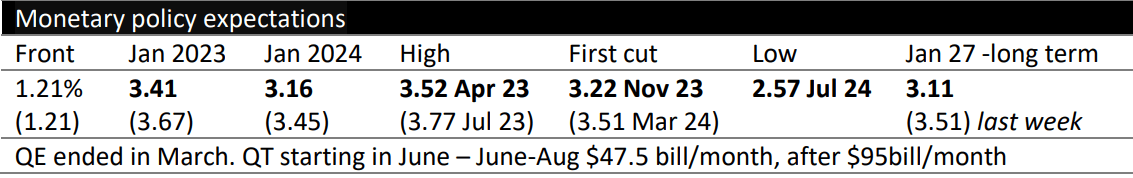
Thus, we are likely past the peak Fed hawkishness point, which supports the peak liquidity risk thesis. Note that the S&P500 (SPY) rallied strongly last week over 6%, as the monetary policy tightening expectations eased, and got out of the bear market territory with the YTD drawdown at 18%. Here is the SPY chart:
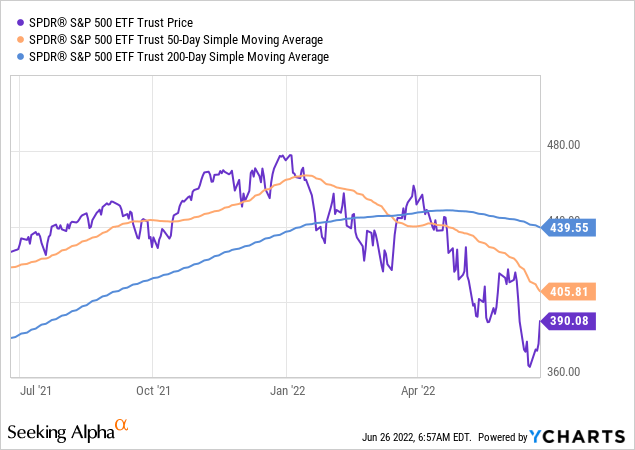
The last week’s SPY rally of over 6% is likely the beginning of the summer rally, which will be first tested at the 50 day moving average, and potentially reach the 200 day moving average at currently 439.
It’s important to note that all (SPY) ETF sectors, expect energy (XLE) bounced strongly last week – it was the broad-based rally. The SPY performance was led by the discretionary stocks (XLY) at 8%, and technology (XLK) at 7%.
The key to the rally sustainability – the next CPI report
Whether the last week’s bounce can be sustained into the summer rally heavily depends on the forthcoming CPI report. The S&P500 was already in bounce mode before the May CPI report, and then the big surprise – the headline CPI number reached the new cycle peak at 8.6% – which caused the renewed selloff in stocks and the liquidity shock part 2.
The Fed had already signaled the possibility of a pause in September – which was doubted after the CPI surprise. The Fed has now specifically signaled that it needs to see the trend of falling CPI before considering the dovish pivot. That’s why the next headline CPI holds the key to the sustainability of the current bounce.
The carnage in commodities is positive for stocks
It is important to note that the core CPI inflation peaked in March with 2 consecutive months of dropping, while the headline CPI inflation continued to rise into May.
The Fed noted that the consumer feels the headline CPI number, which includes the cost of food and energy. The Fed also noted that it cannot directly affect the food and energy prices in an environment of supply chain shortages due to still-Covid related lockdowns in China, and the war in Ukraine.
Thus, the main risk after the May CPI report was that the Fed would continue to be aggressive even if things slow down due to rising commodity prices. Last week those fears evaporated as commodity prices significantly fell. For example, wheat, canola, and oats dropped by 14-16% last week. Brent crude oil dropped by 8% and natural gas dropped by 15%, while copper dropped by almost 10% – all in last 5 days!
These numbers will be reflected in the headline CPI for June and July, and we will likely get the 2 months of positive inflation data that the Fed needs to pause. The Fed will have to acknowledge the falling commodity prices in their statement as the positive development on the inflation front.
Why are commodity prices dropping? As previously shown, the Federal Funds futures are signaling the slowdown in 2023 – this will be due to the demand destruction induced by the Fed in the first place – but the Fed obviously will not have to be super-aggressive to lower the currently high inflation. Lower commodity prices also signal the inevitable ending of the China Covid lockdowns next year, and likely some kind of resolution in the Ukraine war.
Here is the performance of commodities last week:
Barchart Barchart Barchart


Implications for investors
The carnage in commodities last week makes it very likely that the peak Fed hawkishness in behind us. The headline CPI inflation data over the next few months will have to reflect the falling commodity prices and thus, allow the Fed to make the dovish turn.
As a result, the SPY rally last week will likely be sustained over the summer, into the fall. The liquidity risk will continue to ease as the monetary policy tightening expectations ease.
Currently, the probability of an imminent recession is low (as determined by the 10Y-3mo spread), while credit risk is also low (as determined by the BBB-10Y spread). What happens after the summer rally depends on whether the 10Y-3mo spread inverts – if it does invert we might start expecting the imminent recession selloff.
The key risk to the summer rally is the resurfaced liquidity shock for any random reason. As long as the S&P 500 is above the 20% drawdown level (the 1940 level of the S&P500), the liquidity risk will remain low. The drop below this threshold to bear market territory will cause more selling – so this is the stop-loss level for leveraged traders.
I downgraded (SPY) from buy to hold, as the 1840 level was breached – citing the liquidity risk. Given the positive fundamental developments last week, I am upgrading to buy again and buying above the 1840 level.
Be the first to comment