

DNY59
When adjusting for rates, the S&P 500 ETF (NYSEARCA:NYSEARCA:SPY) hasn’t been this expensive in more than a decade. That isn’t assuming where rates are going – it’s just based on where rates are right now.
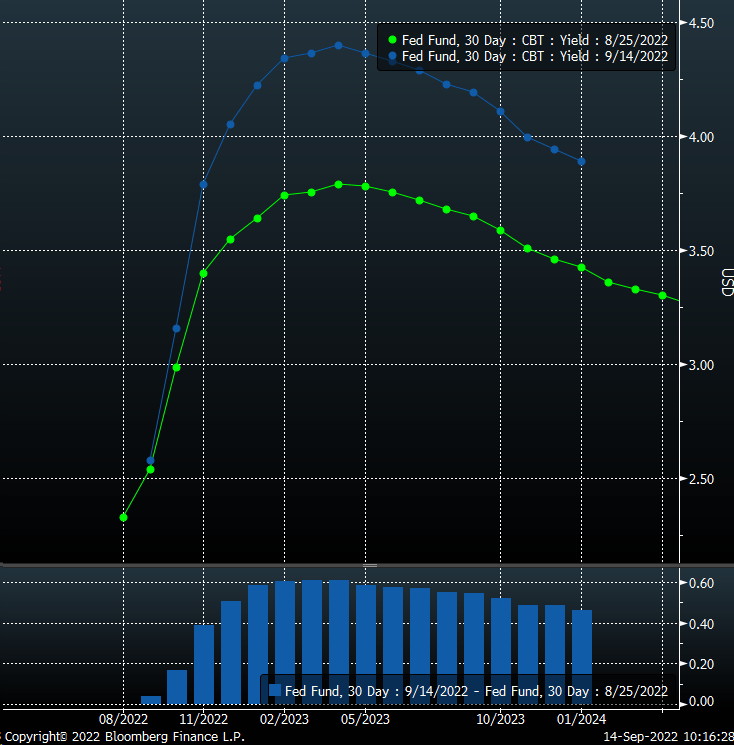
The biggest news of yesterday’s CPI massacre wasn’t the destruction of equity prices. It was the movement in Fed fund futures and rates. The panic in Fed Fund Futures continues today as investors are trying to quickly plot a new course for where the Fed may be heading and how those dot plots at next week’s FOMC may shape up.
Currently, Fed fund futures are pricing a peak terminal rate at 4.4%, up more than 60 bps since Aug. 25, the day before Jackson Hole.
Bloomberg
Wider Spreads
As a result, we see rates across the Treasury curve pushing higher and, more importantly, credit spreads widening. The Markit CDX North America High Yield Index, made up of 100 non-investment grade entities, saw its spread widen just yesterday to 535 from 496. A sign that not only are financial conditions tightening, but that spreads are widening the further one goes out on the risk curve.
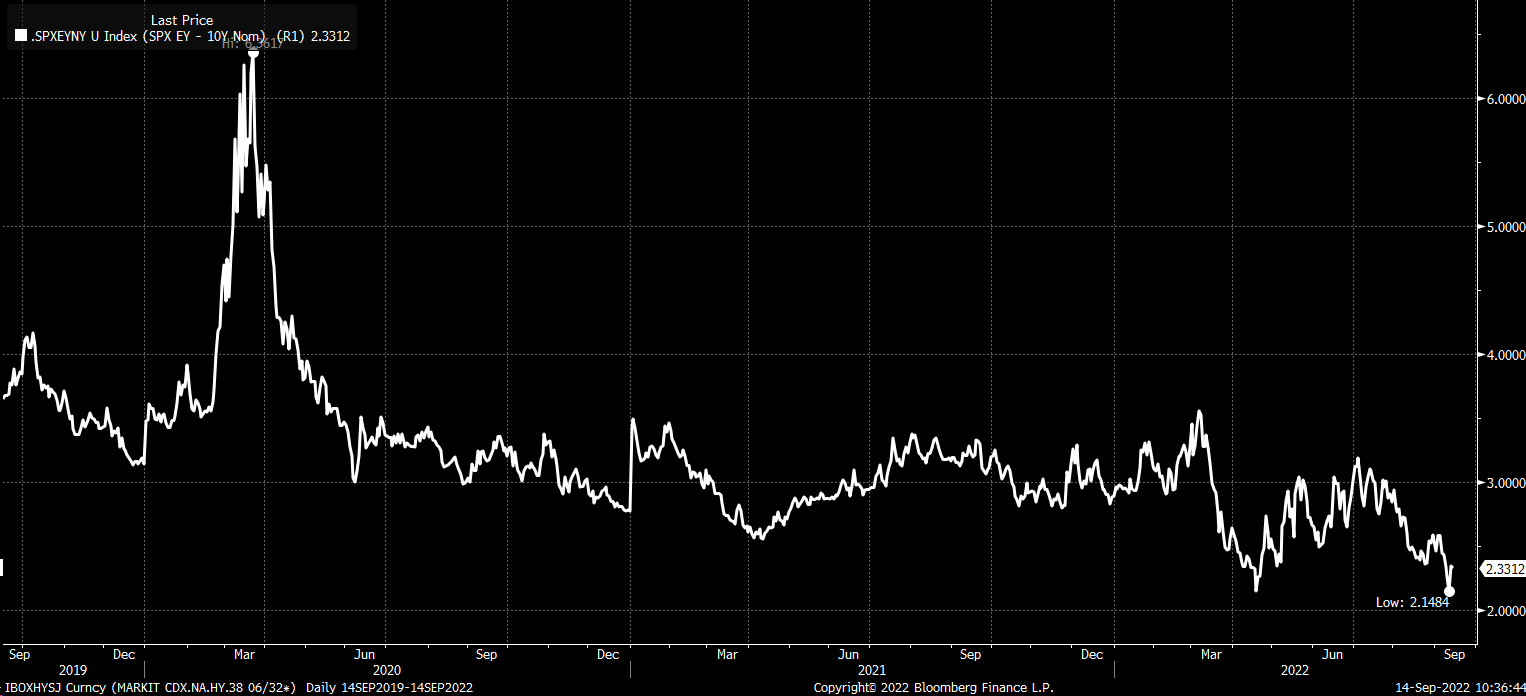
But as usual, the equity market is clueless. Because the spread between the S&P 500 and the 10-year rate has fallen dramatically in recent weeks. It’s going in the opposite direction of the Markit CDX high-yield spread. Historically, the spread between the S&P 500 earnings yield and the 10-year rates has gone in the same direction as High yield spreads. Spreads today between stocks and bonds are the smallest since 2012.

Bloomberg
This suggests that stocks are expensive and are not keeping pace with the changes we see on the credit side of the equation. The equity risk premium or the added risk that investors take to own stocks should be getting wider, and it’s not. The earnings yield for the S&P 500 is just 2.33% higher than the 10-year rate today, a meager premium for the added risk of owning stocks vs. a 10-year Treasury.
Bloomberg
$350
Since 2020 that spread has been somewhere around 3%. Assuming the 10-year Treasury is trading at about 3.45%, the S&P 500 earnings yield would need to be approximately 6.45% for that spread to rise. That would be 75 basis points higher than the current earnings yield of 5.75%, assuming 2022 earnings estimates of around $226 per share, taking the S&P 500 PE ratio from its current 17.4 to approximately 15.5, knocking the value of the S&P 500 down to about 3,503 or 11.2% lower. That would push the SPY ETF down to roughly $350.

Bloomberg
Of course, the problem with this is that rates keep going higher. The higher the market sees the Fed raising rates, the higher nominal rates will rise, which will also help pull real rates even higher. This will work to tighten financial conditions, which are a major macro force and headwind for stocks, further compressing the PE ratio and suppressing values.
Tighter Financial Conditions
We have yet to see financial conditions return to where they were at the June stock market lows. While they have tightened, the Chicago Fed National Financial Conditions Index (NFCI) and the Adjusted NFCI still have more tightening to come. Given that rates are at or above their June highs, it seems foolish to think that stocks will stop falling just at their June lows.

Bloomberg
Because financial conditions will need to tighten beyond their June highs to put monetary policy into a restrictive posture to slow the economy, credit spreads will need to widen even further than where they are now. Plus, we know that Fed funds futures are pricing in higher rates, and with higher rates and wider spreads, it makes sense for stocks to be making new lows, and a 450 drop to around 3,500 in the S&P 500 and the SPY dropping to $350, not implausible.
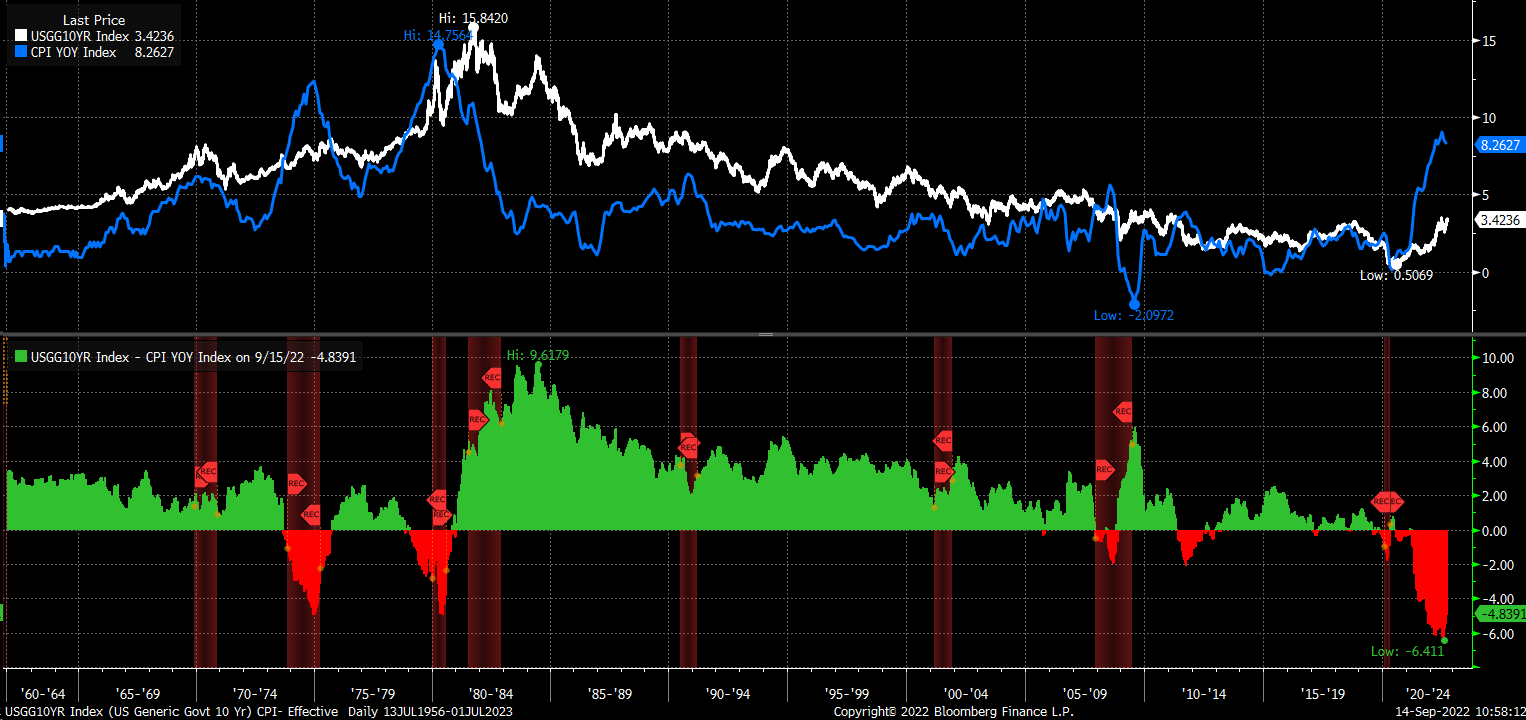
Everyone should only hope that the Fed will be able to get inflation to drop very quickly. If not the 10-year is probably heading much higher. Ultimately, in the past, the 10-year rate has surpassed the CPI inflation rate, going back to 1956.
Bloomberg
If rates on the 10-year rate were to go above 8%, that would be even worse news for the stock market. So let us all hope that doesn’t happen.
Be the first to comment