


Mny-Jhee/iStock via Getty Images
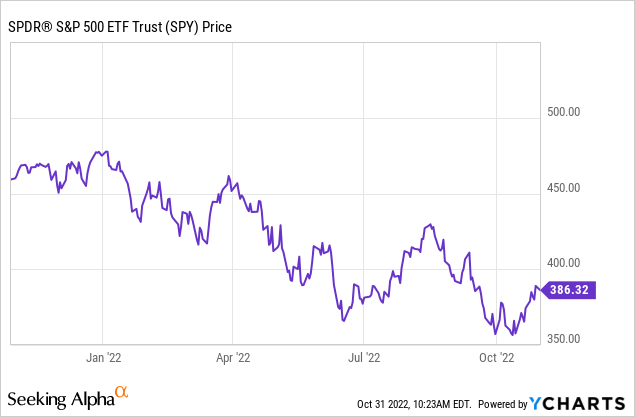
Stocks have been on a tear since Oct. 13, the day September CPI was released. Since then, the S&P 500 (NYSEARCA:SPY) is up a little over 9% since the last low. While the current rally is only “half as crazy” as the nearly 18% midsummer rally, this one is likely to fail for the same reasons, as the structural issues underpinning stocks (inflation, long-term earnings prospects) have not changed. For sharp-eyed investors, the all-important FOMC meeting and press conference will be this week on Wednesday, Nov. 2. There, for a few reasons we’ll get into below, the Fed will likely need to be much tougher than market bulls would prefer. Treasury bills already paying over 4% and headed to 5% or more. As such, the risk/reward for the S&P 500 is increasingly poor when risk-free returns can be had with no drama. And if you do want to invest in stocks, it’s hard to deny the unfavorable difference in valuation between the top-heavy SPY and small-cap (IJR) and mid-cap indices (IJH) that trade at substantial valuation discounts. The last time SPY was this much more expensive than small and mid-caps was the 1999-2000 tech bubble, and that one didn’t work out too well for investors.
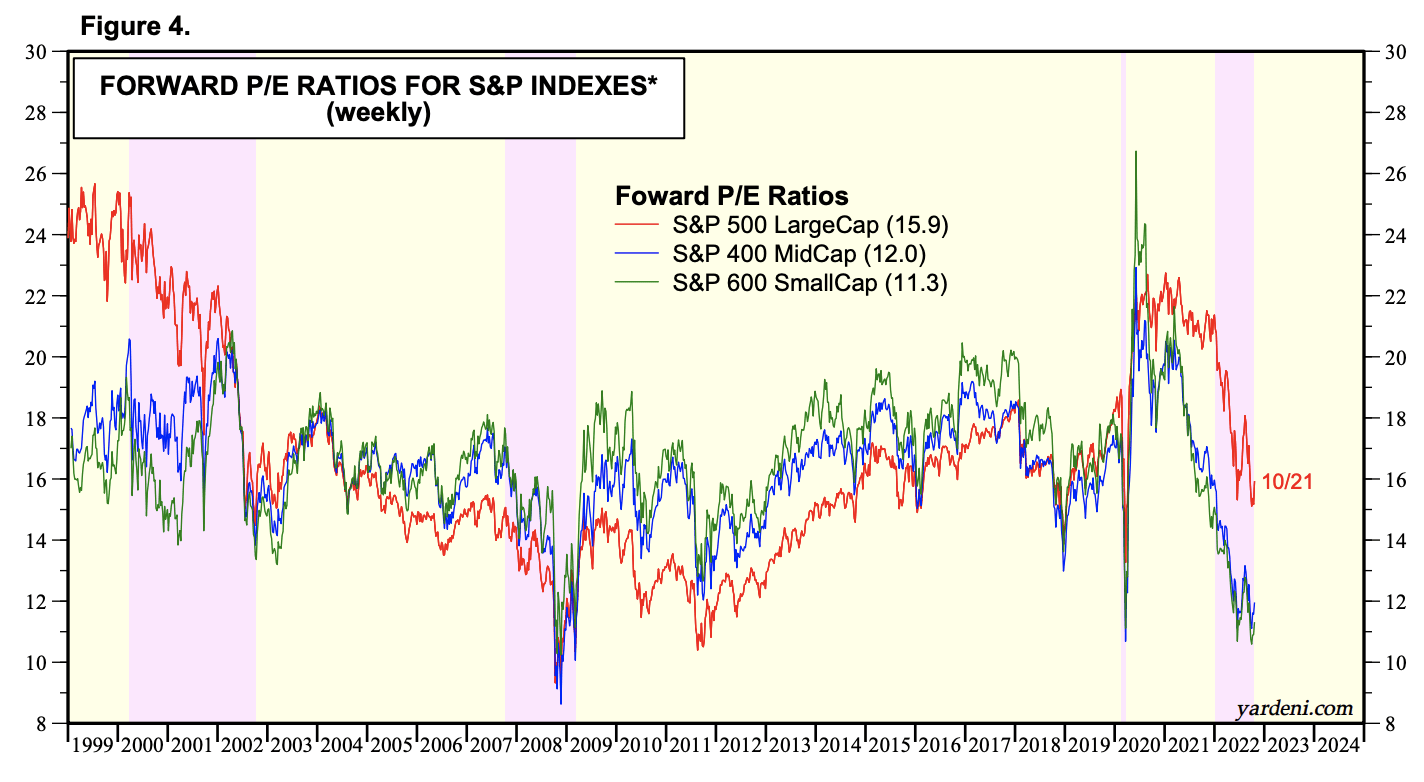
Large Caps Look Overvalued (Yardeni Research)
Why Stocks Surged In October
Markets had fallen fairly steadily since the Jackson Hole meltdown in August when traders were forced to face the reality that the Fed would not be bailing out their speculative bets on tech stocks. August CPI (released Sept. 13) was a cold shower for markets, and the Fed responded by hiking rates by 75 basis points at the last FOMC meeting on Sept. 21. When September CPI came in hot again on Oct. 13, stocks plunged pre-market, hitting a new low for the year. Then, against all odds, stocks surged.
Here’s what happened.
1. Short Covering. The rally started when short covering and dip buying sent stocks surging nearly 5% in hours after the terrible CPI report, making the day one of the odder instances of the “bad news is good news” mindset that had come to define trading over the past five years or so.
2. UK U-Turn. Around the same time, rumors swirled about the UK government’s plans to cut taxes. When the plan was unveiled in September, the debt markets flipped out because the UK was pursuing stimulus and tax cuts at the same time. This led to fear that the government would not be able to pay the debt back, so investors dumped their government bonds en masse. Also, a bunch of huge UK pension funds apparently engaged in a leveraged investing scheme that required a government bailout. But on Oct. 14, Liz Truss fired Chancellor Kwasi Kharteng, signaling the end of the experiment and sending yields lower. This brought runaway bond yields back down and had the side effect of taking the pressure off of the leveraged funds that were driving much of the forced selling. Jeremy Hunt, the new Chancellor, soon signaled that the government would not try to cut taxes. Liz Truss then got promptly fired as well, ending the reign of her made-for-TV administration after just 44 days in office.
3. The WSJ Article. However, the most interesting thing that happened in October was a WSJ article by an author named Nick Timiraos. The Fed has a quiet period of about 10 days before FOMC meetings when officials aren’t allowed to give interviews or speak publicly, so what tends to happen then is that well-connected D.C. reporters like Timiraos will fill the gap.
What the actual article suggested is that the Fed may hike 50 bps at their December meeting instead of 75 bps, putting the rate at 4.5% rather than 4.75%. Then the Fed will continue hiking but at 50 bps increments or less. This makes sense, as when rates get closer to where they need to be, then monetary policy can be adjusted in normal intervals rather than panic catch-up moves.
But then CNBC reported on the article, emphasizing it as being about the Fed worrying that they’ll overtighten. The irony here is that few people were able to read the actual article because of the paywall. WSJ subscriptions are expensive and rumors are cheap. A game of telephone ensued as the CNBC report was then filtered into the blogosphere as the “Fed pivot,” which was inevitably followed by wild predictions of rate cuts, QE policies, and more free money stimulus. The article caught me by surprise because I read the CNBC piece first, saw the market action, and initially thought that the Fed was going to wimp out on hiking rates. Other traders saw this too because they dumped long-term bonds en masse that day, starting to challenge the “Fed pivot” in a similar way that the market challenged the Bank of England earlier in the month.
Because the articles came out on an options expiration day, it resulted in an explosive, self-perpetuating move up in stocks as money flooded into the market and forced options dealers to buy more stocks to hedge. However, the actual article wasn’t what the rest of the world thought it was from the other side of the paywall. I’ll share the key quote from the WSJ article that tells you this is not a pivot.
Markets rallied in July and August on expectations that the Fed might slow rate rises. That conflicted with the central bank’s goals because easier financial conditions stimulate spending and economic growth. The rally prompted Fed Chairman Jerome Powell to redraft a major speech in late August to disabuse investors of any misperceptions about his inflation-fighting commitment. If officials are entertaining a half-point rate rise in December, they would want to prepare investors for that decision in the weeks after their Nov. 1-2 meeting without prompting another sustained rally. (emphasis mine)
This summer, what happened was that financial conditions had begun to tighten by June, but traders started to build a narrative that the Fed would pivot, that they weren’t serious about stopping inflation, etc.
- So stocks skyrocketed up nearly 18% in two months based on pivot rumors.
- The 10-year went down to 2.6%.
- The dollar fell.
- And people started loading up again on commodities and crypto.
This in turn fueled inflation, and the rally itself made it impossible for the Fed pivot that traders wanted to happen. Financial markets are reflexive – people buy stocks betting on a Fed pivot, but the very act of them doing it makes prices go up and makes that less likely to happen. This then sends prices back down.
This time, the surge has been far more contained, with the rally so far only going about half as far as the last time the rumor mill got rolling and people poured money into everything speculative. But it will fail for the same reason – the dollar is falling again and speculative stocks are surging, which causes financial conditions to loosen and inflation to rise, forcing a response from the Fed this week. As such, the bond market is far less excited about this Fed pivot rumor than the one in June, likely because at least some people learned from the first bear market rally and are paying attention to fundamentals.
The same author of the WSJ piece has since written a report that rates may need to go higher than the market is expecting – floating a figure as high as 5.5%. Of course, it was published on Sunday so it wasn’t widely reported on by CNBC and the blogosphere. This article is the opposite of the one that sparked the big rally earlier in October. Pay attention here – the Fed seems to be telegraphing its intentions for the meeting this week!
Has The Stock Market Bottomed? Probably Not.
Problem #1: Stubborn Inflation
Buried beneath all of the investor optimism is the fact that the core inflation report was really bad earlier this month, signaling a dysfunctional economy and the need for more rate hikes. The recent stock rally and fall in the dollar will not help this at all.
The Cleveland Fed’s CPI nowcast outperformed professional forecasters last month, suggesting higher inflation than the market expected. The model is again suggesting a core CPI increase of 0.5% or more for October. Once inflation gets going, it tends to stay rolling, and I highly doubt that the effective Fed funds rate for October of 3.00% to 3.25% will have done much to slow inflation. This likely leaves another bad report in November. The next big issue comes in January when tens of millions of employees get their annual raises and that money starts chasing goods and services. Social Security alone is going up 8.7% in 2023, and it represents something like 6% of the national income. And of course, you’ve got OPEC trying to put the squeeze on the US with crude oil production cuts.
The inference here is that the Fed funds rate is going to have to go north of 5% to meaningfully bring down core inflation. The latest update on the Atlanta Fed econometric model of where Fed funds should be is implying rates averaging over 5%. This is not priced into stocks or bonds. The Fed may still be behind the curve, raising the possibility of a 75 basis point hike in December and a further rise in rates to over 5% from there to finally squash inflation.
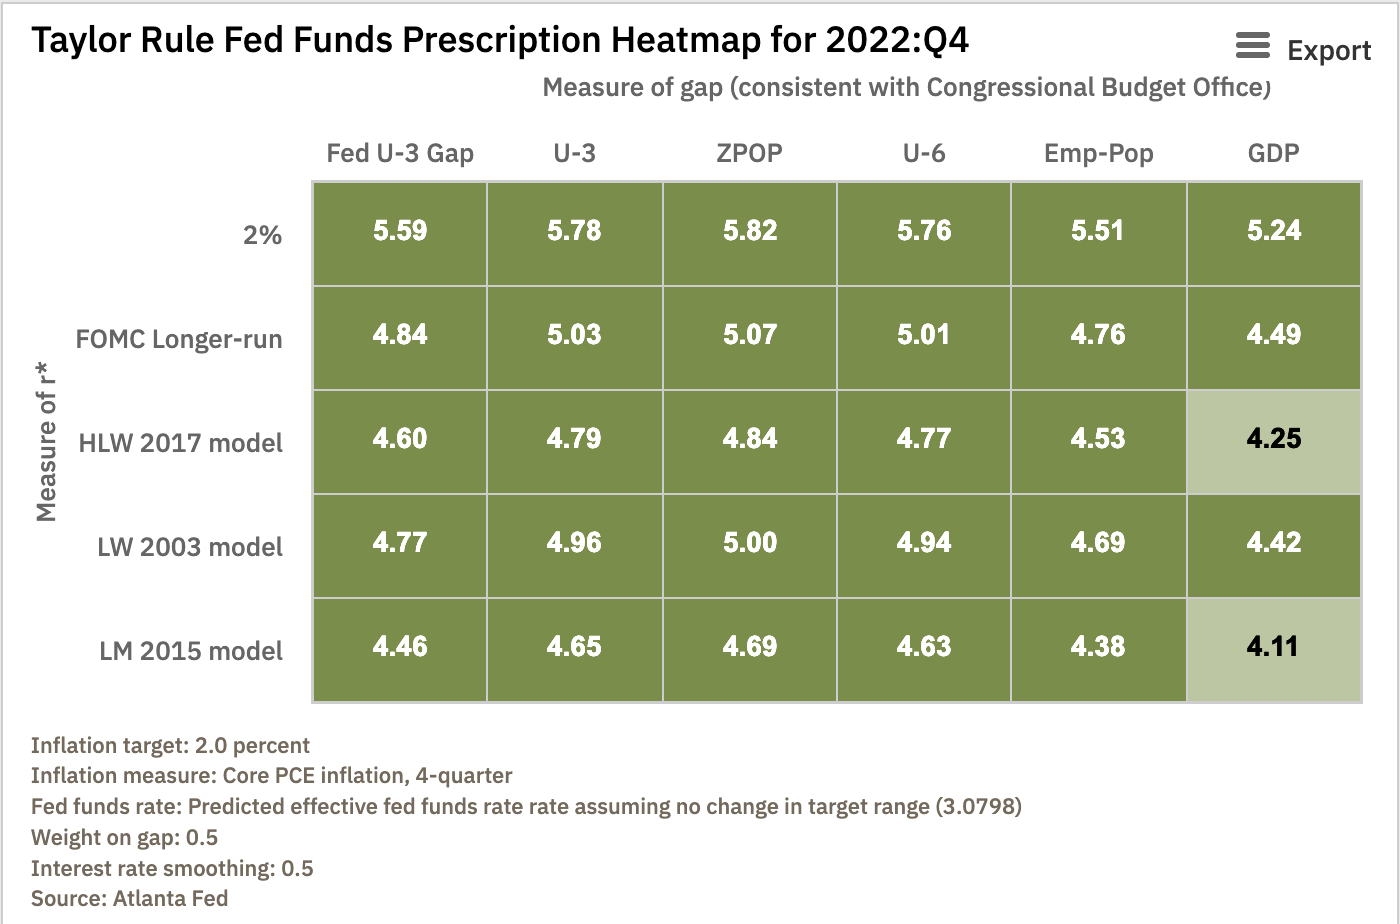
Suggested Fed Funds Rate (Atlanta Fed)
Some market participants have suggested that the Fed doesn’t care if it lets inflation surge and that this is a deliberate policy move rather than a mistake from March 2021 to March 2022 that’s now being corrected. I don’t buy this, and if you do, market inflation expectations are an interesting place to look.
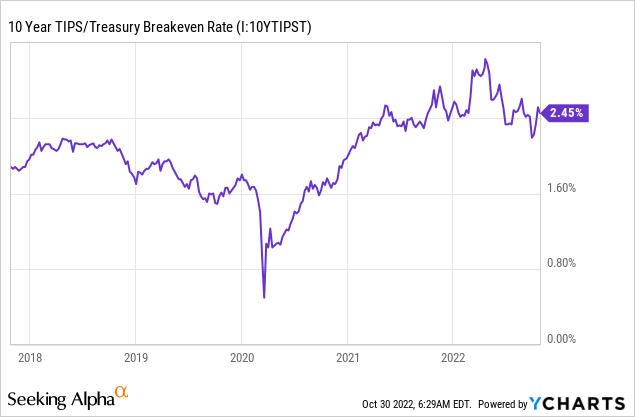
Depending on your source of data, the market only expects about 2.4-2.5% annual inflation over the next 10 years. This is actually shockingly low considering the rate of CPI inflation was about 7% in 2021 and is expected to be about the same this year for 2022. If you think these numbers are too low you can buy TIPs, but the other main move is probably to buy commodities or oil stocks like Exxon (XOM) or Chevron (CVX).
On one hand, common sense and econometric models say that inflation is going to keep rolling for the next 3-6 months or so and that big Fed hikes are likely coming, while 10-year inflation breakevens indicate that the market is not worried about inflation being a long-term issue. But between the economic models and the pricing of stocks, bonds, and TIPs, someone is wrong. That someone is more than likely to be stock market investors. The implication is that there’s likely to be a harsh recession that brings inflation to normal levels.
Problem #2: Earnings Sustainability
We’re about halfway through earnings season. Despite terrible consumer confidence, the numbers haven’t been too bad, with reporting from FactSet showing Q3 profits up 2.2% from last year if you count energy companies, and down about 5.1% if you don’t. Ex-energy, the picture is more what you would expect for an economy that is out of stimulus and getting hit with rate hikes. Remember that these figures are not adjusted for inflation, so earnings are down in inflation-adjusted terms no matter how you spin it. This will continue to change as the rest of the numbers come in – my guess is that these numbers will come in a bit lower for Q3 and then will be revised down more in Q4. Amazon’s (AMZN) massive earnings miss and lowering of guidance is the clearest early warning signal you can get on this, but investors chose to tune it out.

2022 Earnings Estimates (FactSet)
Against all odds, 2022 is expected to be the best year ever for corporate profits for the S&P, beating even 2021’s record profits in the stimulus-driven YOLO economy. Analysts expect about $220 per share in earnings, besting 2021’s number of roughly $209. But you wouldn’t know it from looking at wages, which are consistently failing to keep pace with inflation, leading to a roughly 3.8% drop in the real standard of living in the US over the past 12 months.
Savings rates offer some clues, as consumers are saving less money than they have at any time since Q4 of 2007, right before the global financial crisis. The savings rate is even worse than it looks because student loans kick back in on Jan. 1, which may push savings rates into negative territory. My guess is that the estimates for 2022 will not be hit and that the insane estimates for 2023 of nearly $240 per share in earnings are missed by a mile. Earnings estimates are similarly too high for small and mid-caps, but they trade at a substantial valuation discount to the S&P 500.
The YOLO economy may be shifting into reverse as consumers run out of pandemic savings to spend and see their wages fall in real terms. Q2 2022 earnings beat even the holiday quarter for 2021, as formerly locked-down consumers spent with reckless abandon on anything from vacations to live entertainment to eating out. Now, earnings are likely to fall 5%-7% quarter over quarter, depending on where the final numbers come in.
We can debate short-term earnings estimates here, but the real issues are longer-term and structural. Back of a napkin: If you take the current size of nominal GDP and apply pre-pandemic levels of profit margins you get earnings for the S&P 500 of about $190. Most of this bump in profit margins came from interest rates being held at zero.
- But what happens to all of these companies when they have to refinance their corporate debt where they were paying 3% interest to now pay 6%+?
- And what happens to consumer spending when instead of getting 3% mortgages people now have to pay 7%+?
- Unemployment is currently very low, but if it reverts to its historical mean of around 6%, that’s even more pressure heaped on stocks and earnings.
- With respect to taxes, what happens to profits when Western governments can’t fund what they’ve promised in entitlements with current levels of taxes? Some combination of benefit cuts and income tax increases will happen going forward. More earnings pressure.
- Also, consider the supply and demand dynamics of stocks going forward with the millions of early retirees that the pandemic minted. They’re all forced sellers of stocks, and younger workers aren’t as keen to buy the stocks they’re selling, as evidenced by savings rates near record lows.
The question at the end of the day: Do you want to deal with all of this by putting all of your money in stocks right now? Or would you rather earn 5% or more on cash or short-term municipal bonds and let the market sort all of these issues out while it finds a fair price? I would choose the latter for at least a decent percentage of your money. Earnings are unsustainably high, and stocks are trading at the high end of their typical range of 15-18x earnings. But in contrast to the years of zero interest rates, QE, and TINA, investors have a ready alternative in cash.
Key Takeaways
- The market is again rallying in hopes of a Fed pivot this week, but econometric models suggest that inflation is not yet under control and that the market has yet to price the full extent of rate hikes.
- The Fed is now likely to hike rates to over 5% and keep them there to have a fighting chance at pushing inflation down to 2%.
- If you can earn 5% on cash risk free, stocks are mispriced. The S&P 500 is trading for the high side of historical valuations at roughly 18x earnings, and this is closer to 20x normalized earnings if you account for stimulus and consumers blowing their accumulated savings. This price makes zero sense given where interest rates are.
- If you’re wrong about being in cash, you’ll still earn 5% or more over the next year in interest. If you’re wrong about stocks, you can lose 30% or more. Inflation affects both choices equally.
- The Fed is likely going to have to break the news to the market about inflation and the path of rates at the FOMC meeting this week, sending stocks lower in the wake.
- The fair value for the S&P 500 is 3200-3300, where it has been all along for the last 12 months.
Be the first to comment