

JuSun/iStock via Getty Images
In my article “SPY: Target Reached, It’s Time For An Update” published on November 14, 2022, I suggested the SPDR S&P 500 Trust ETF (NYSEARCA:SPY) was facing some consolidation in its price action, and it was time to wait on the sidelines before making any stronger decision. Investors who followed my buy signal published on October 7, could achieve a nice profit and may have taken their profits off the table. Although recently more negative signals are accumulating, it’s still too early to take action either on the long or the short side. Most of all, as the coming week will see disclosing important macroeconomic data which will probably mark the direction for the coming weeks, I would still wait on the sidelines or keep my positions on hold, while in the latter case, I would certainly observe the discussed price levels as my marginal risk tolerance.
An overview of the actual situation
Let’s have a look at the most important indicators I observe when assessing the situation of the major indexes in the US financial markets. The Market Breadth measured by the MMFI, as a percentage of stocks above their 50-day moving averages [MAV], has peaked at levels over 70% and marked its biggest decline during the past week; while the MMTH, measuring the percentage of stocks above their 200-day MAV, has almost reached 50% but got rejected at its EMA200 and is now oriented towards lower participation levels.
Author, using TradingView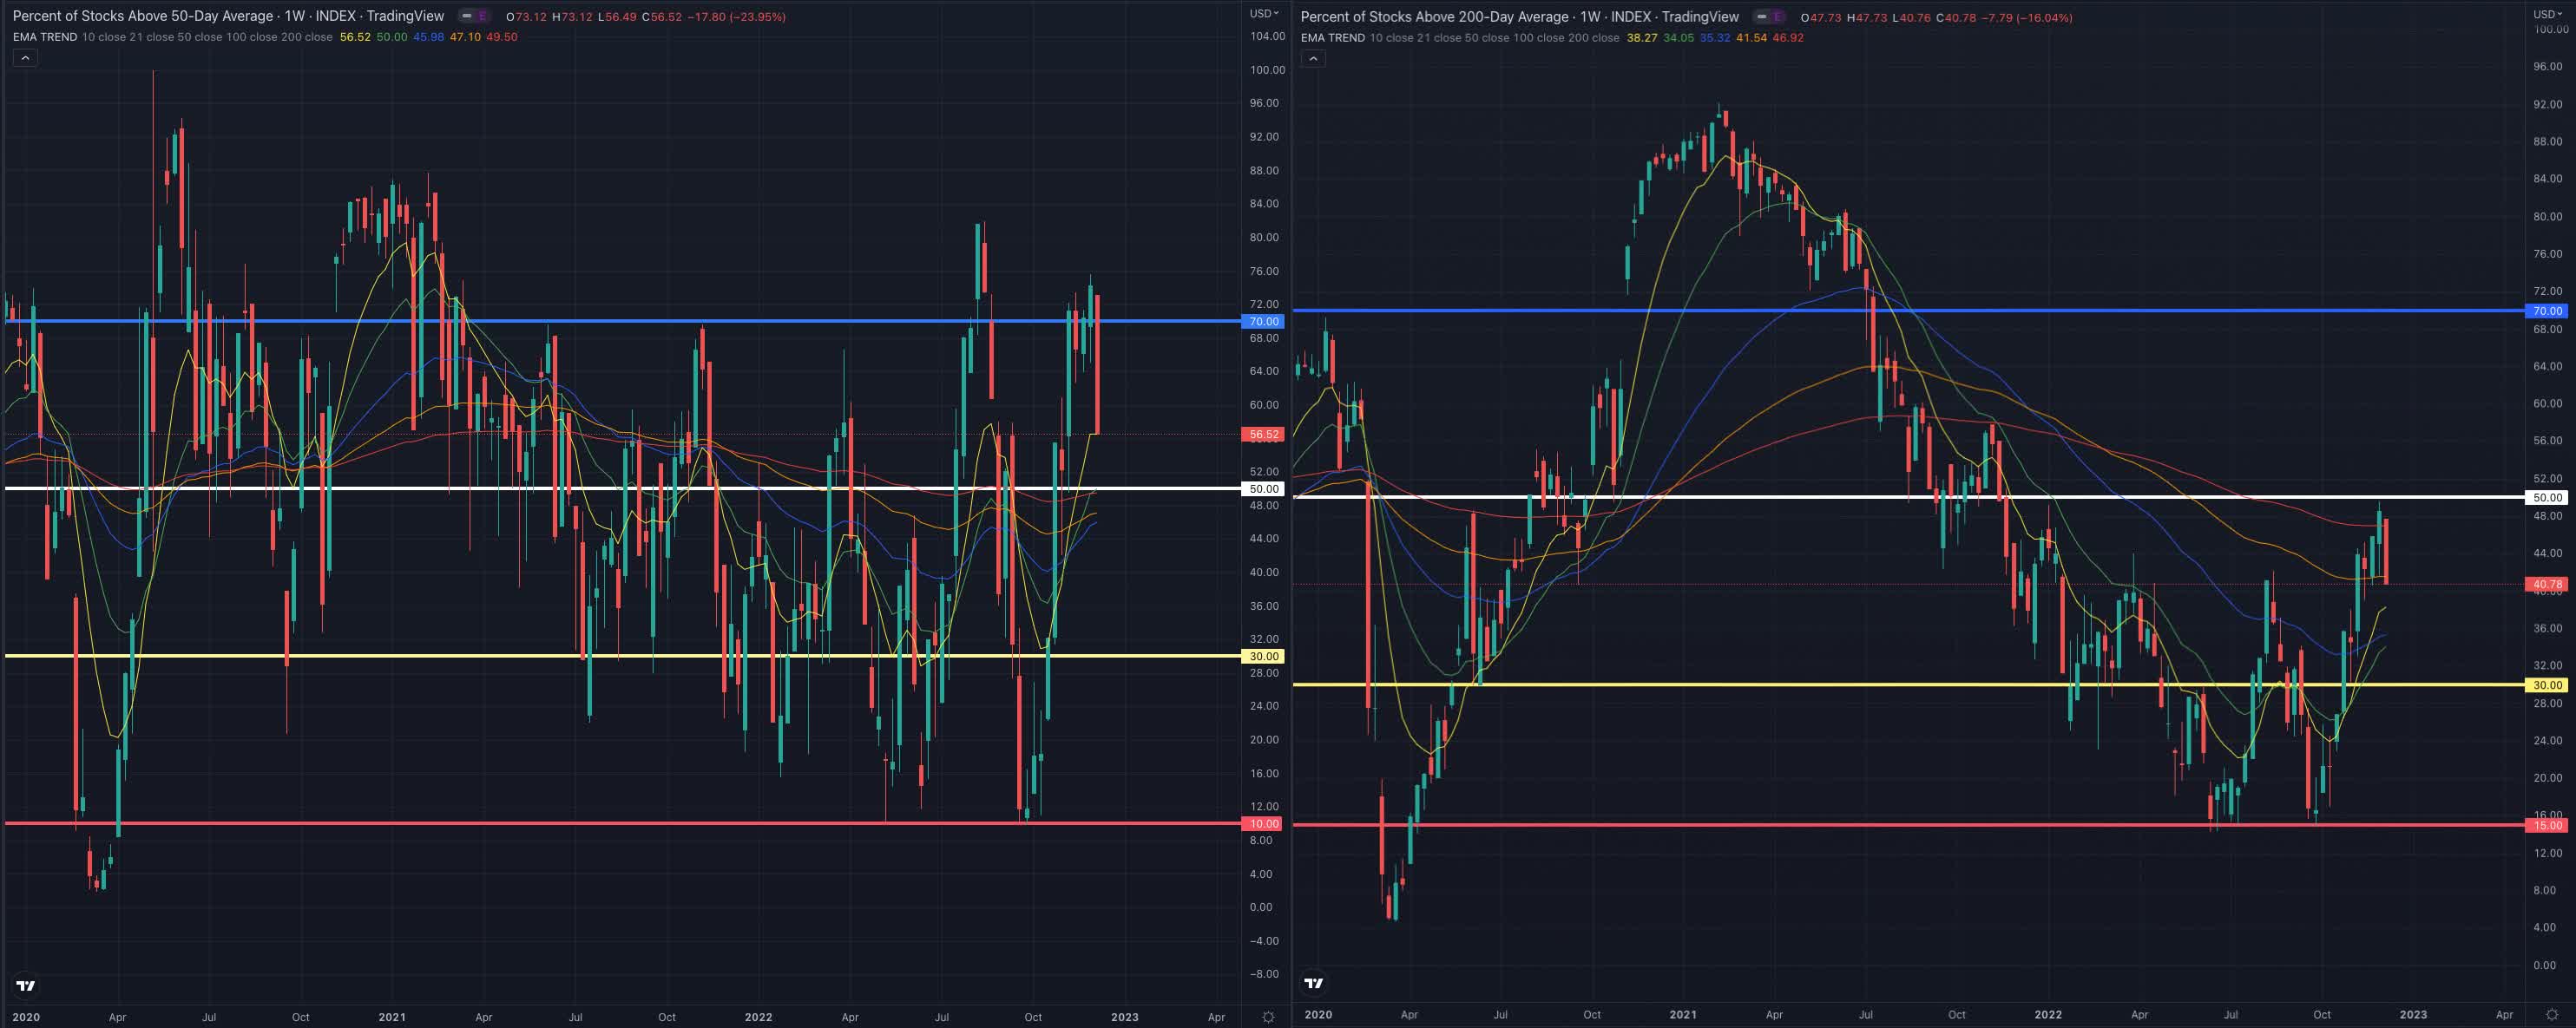
It’s important to observe that in a consistently strong uptrend, stocks keep their 50-day MAV as trailing support, while significantly over 70% of them are priced above their 200-day MAV. Both indicators have ended the past week at their lowest weekly levels, which could hint at a continuation of this trend in the coming week. The stock market has been hovering around its recent heights but most stocks have failed to overcome their long-term MAV, still lacking enough strength to recover from their yearly negative performance. In the technology sector, companies active in the basic materials and consumer cyclicals industries have been leading the rebound in the past month, as many of them have been oversold from a yearly perspective. Yet the last week has given a clear sign of a temporary top, as all sectors have given signs of weakness.
finviz finviz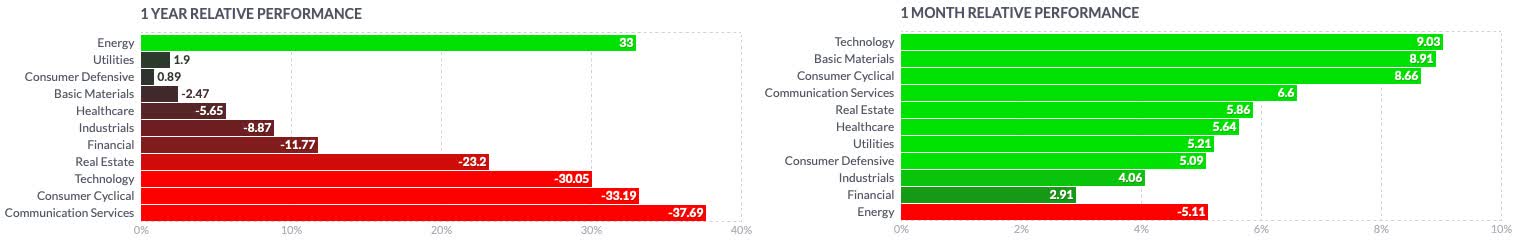
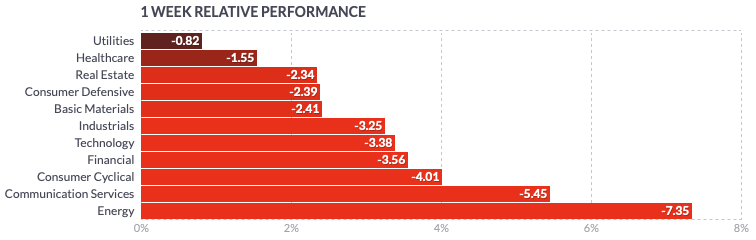
The CBOE Volatility Index (VIX) tends to be moderate in bull markets and higher in bear markets, with spikes reported during periods of extreme uncertainty or unforeseen major events mostly perceived as negative catalysts for the stock market. During the last market rebound, the VIX dropped again toward a price level of 20, which has been tendentially its bottom since the market crash in 2020, and levels between 20 and 30 have been a good directional indicator for the stock market. When compared to the SPY in terms of relative strength, we can observe how inverted the two benchmarks have behaved, as the stronger the volatility index, the weaker the SPY. The increase in the VIX during the past week could be an early signal of a new downward cycle, despite based on this indicator and at this point, it’s not possible to predict how extended this cycle may be.
Author, using TradingView
The SPDR Bloomberg Barclays High Yield Bond ETF (JNK), which tracks highly liquid, high-yield, US dollar-denominated corporate bonds, although hinting to further risk-aversion in the markets, isn’t for the moment giving strong signs of weakness, as the benchmark closed the week on a relatively constant level, supported by its short-term MAV. Despite that, the indicator is still priced at relatively low prices, as the uncertainty and consequently the risk aversion of market actors are still comparable to levels seen during the 2020 market crash.
Author, using TradingView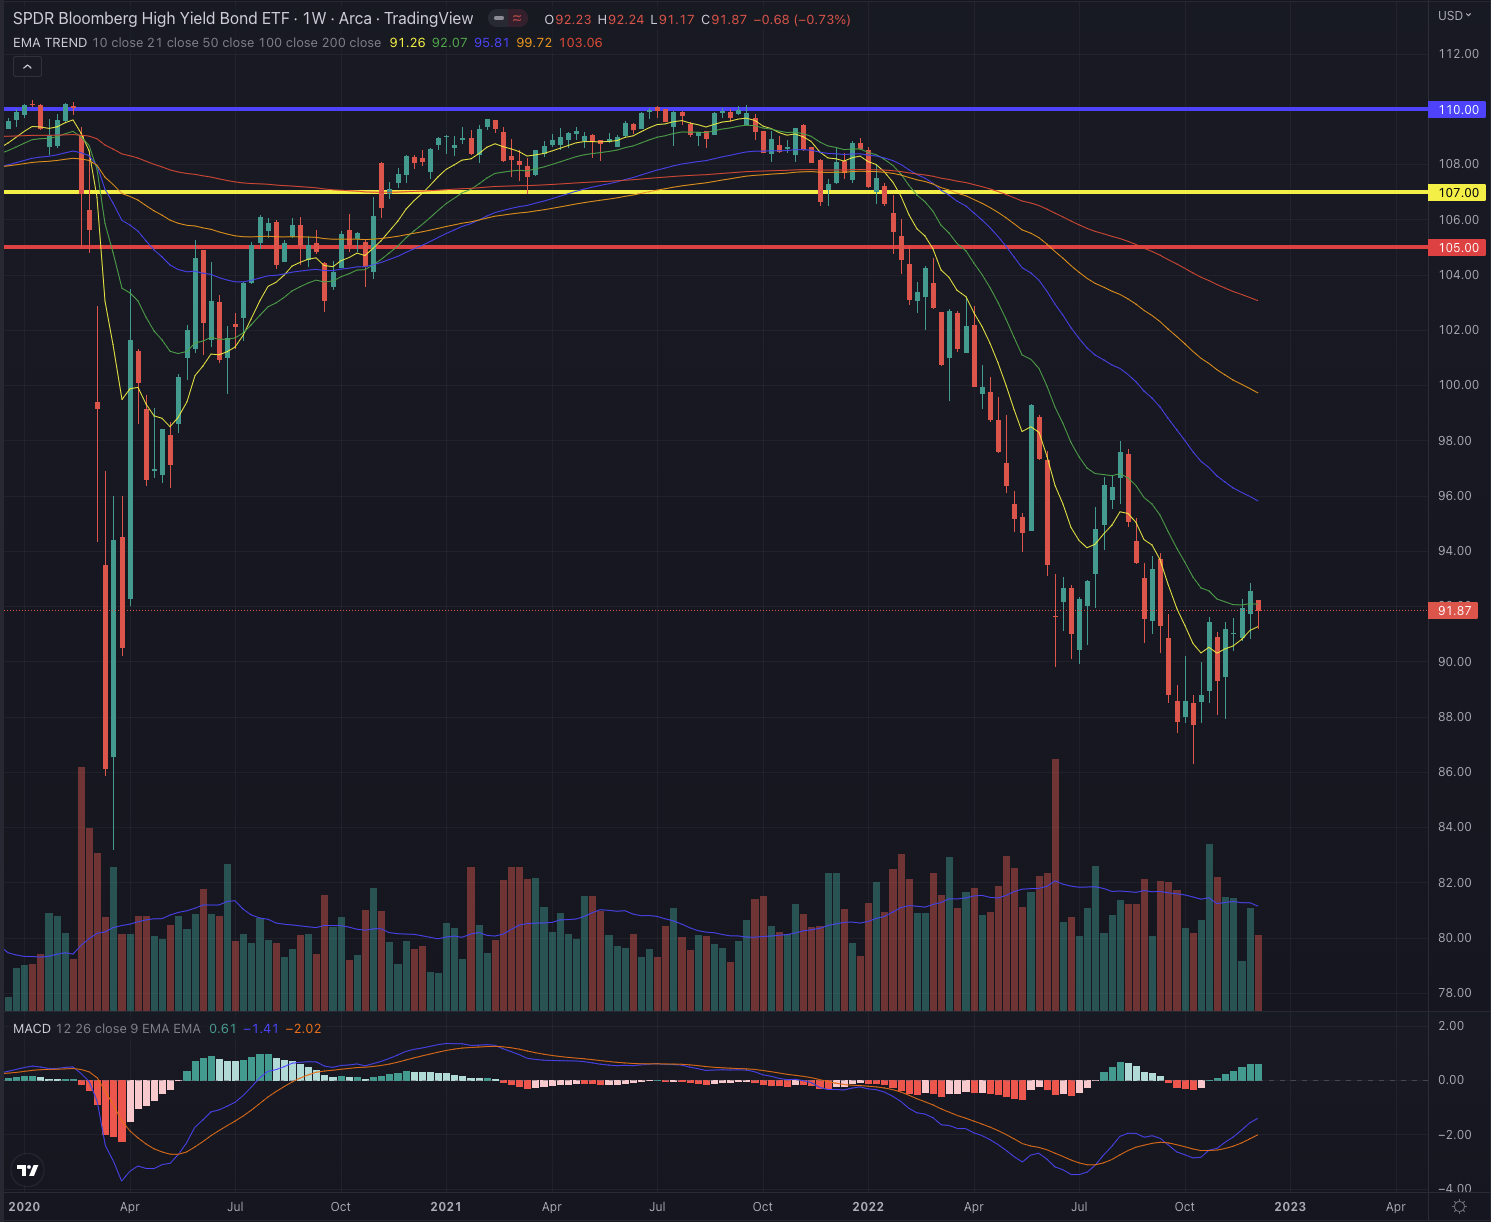
SPY peaked at $410 in its short-term uptrend on December 1st, 2022, slightly over my target I set at $395, temporarily breaking out from its EMA200 on a daily time frame, and from its EMA50 on its weekly chart, while the index has been able to progressively build up some relative strength when compared to the broader small-cap market tracked by the iShares Russell 2000 ETF (IWM), the market participation is still not confident enough to lead a stronger money flow into the biggest capitalizations.
Author, using TradingView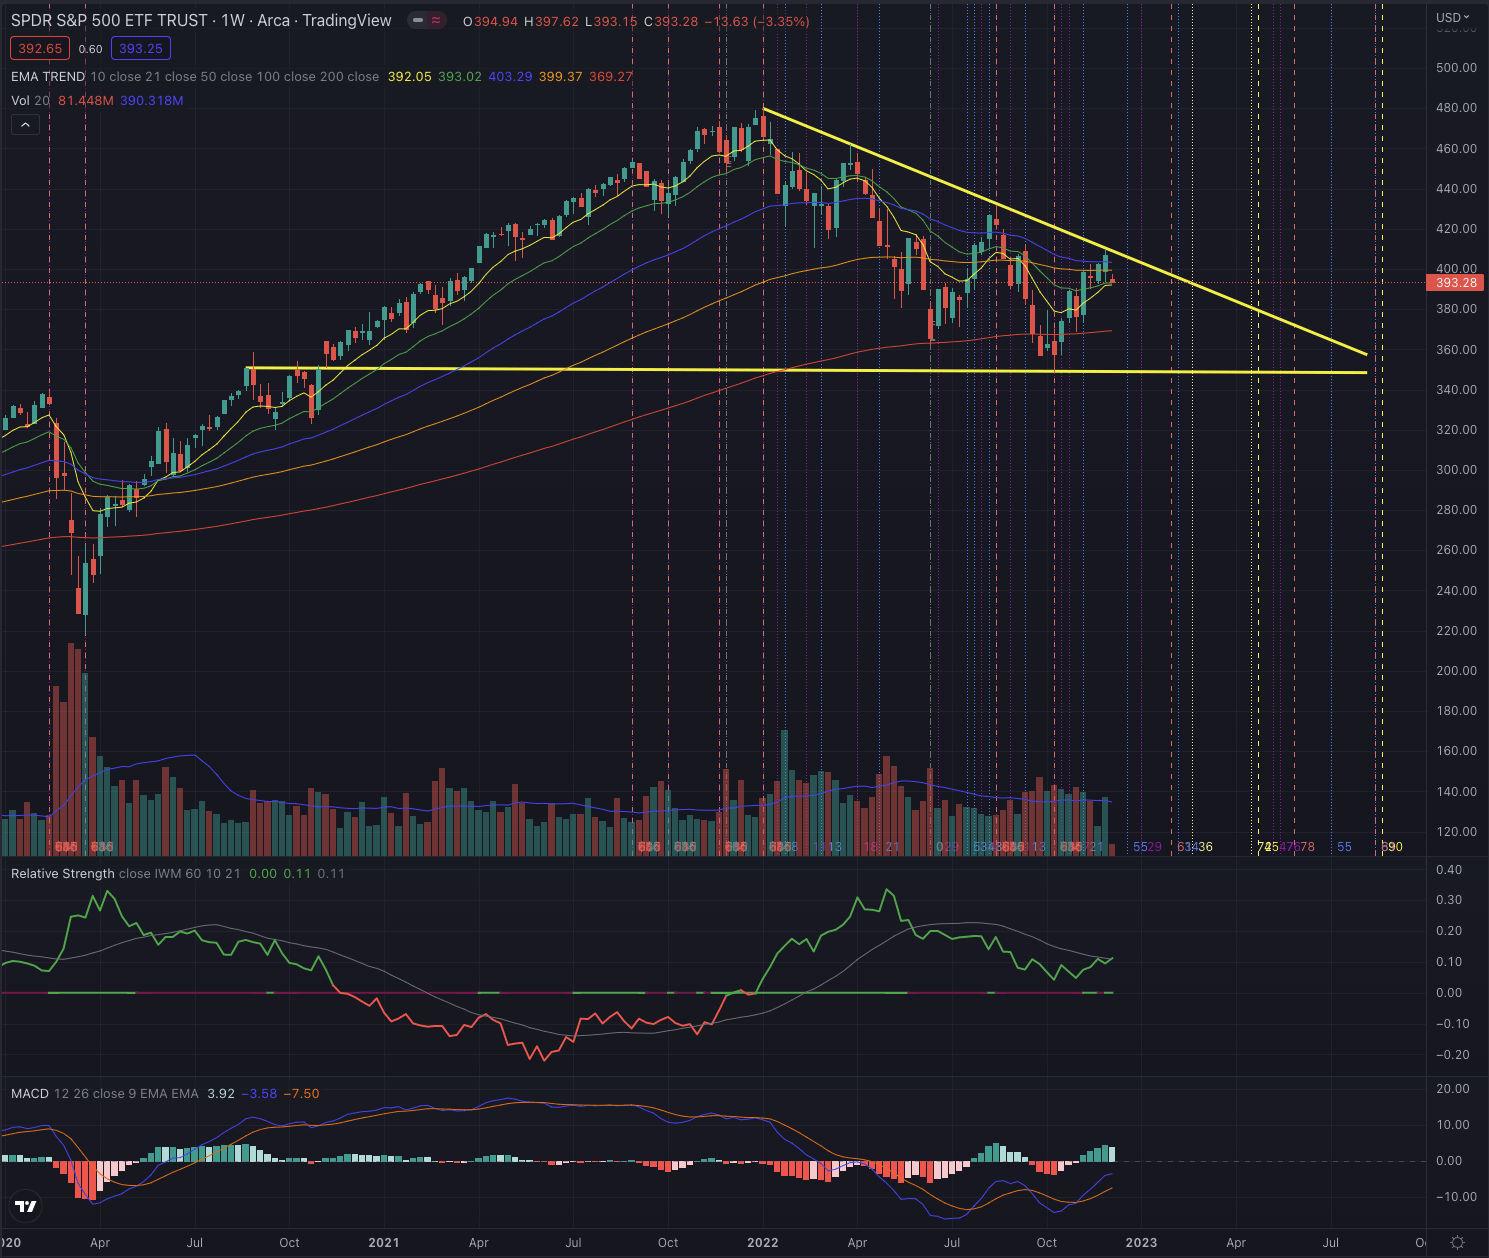
Although the momentum is still moderately positive, the past week has signaled a peak of the recent uptrend as reported by the SPY’s MACD and also confirmed by the descending triangle formation in the SPY’s weekly chart, which the benchmark hasn’t violated since its formation.
The short interest on the SPY has been tendentially decreasing since September until the index peak at the beginning of December but is now again hinting at more selling pressure in the past week. This a sign that more bets on a falling stock market are being placed.
nasdaq.com with data from FINRA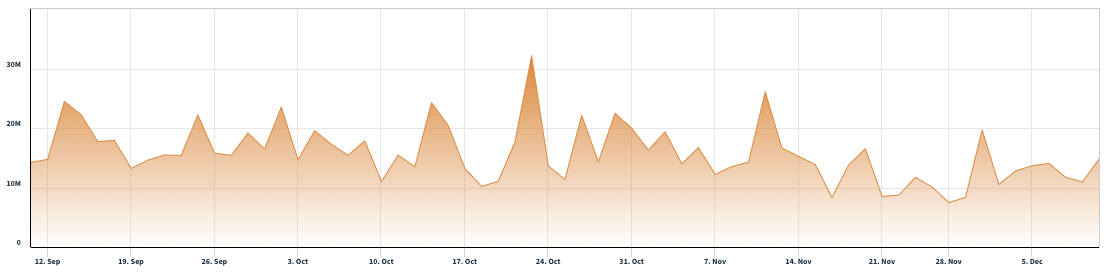
What is coming next?
A reversal of the latest positive trend of the SPY is becoming more likely. The observed indicators, besides the JNK which is still less significant in its direction, are all pointing at a drop in the SPY in the coming weeks. That during the coming week highly expected data will be released, is aligning with the actual situation pictured by increasingly high insecurity. Starting with the November CPI report on December 13, followed by the interest rate decision by the FED on December 14, and among other central banks’ interest rates decisions and important macroeconomic data, also the ECB is expected to influence the market’s direction on December 15.
SPY has tried to complete a new Elliott impulse wave sequence but failed to comply with the proportions in its waves, and with the important rule of wave 4 never overlapping with the price level of wave 1, which I observed, most likely lead to a continuation of the trend after wave 5. The actual formation could also just have been a corrective wave sequence, as I hinted at in my last article, even though also in this case the proportions are not significant.
The SPY has built up some significant support levels represented on its daily chart by its EMA50 around $390, at $380, and $368 before the bottom at $350 would be tested. On its weekly chart SPY is testing its short-term EMAs and would still have its EMA200 as support if the index would continue to drop. Investors should pay particular attention to the technicals in different time frames, as the price action may be more straightforward when analyzed from different perspectives. Those support levels could lead to a continuation in a sideways movement, while in this case, the volatility would have to gradually drop, driving the SPY in its converging price range.
Author, using TradingView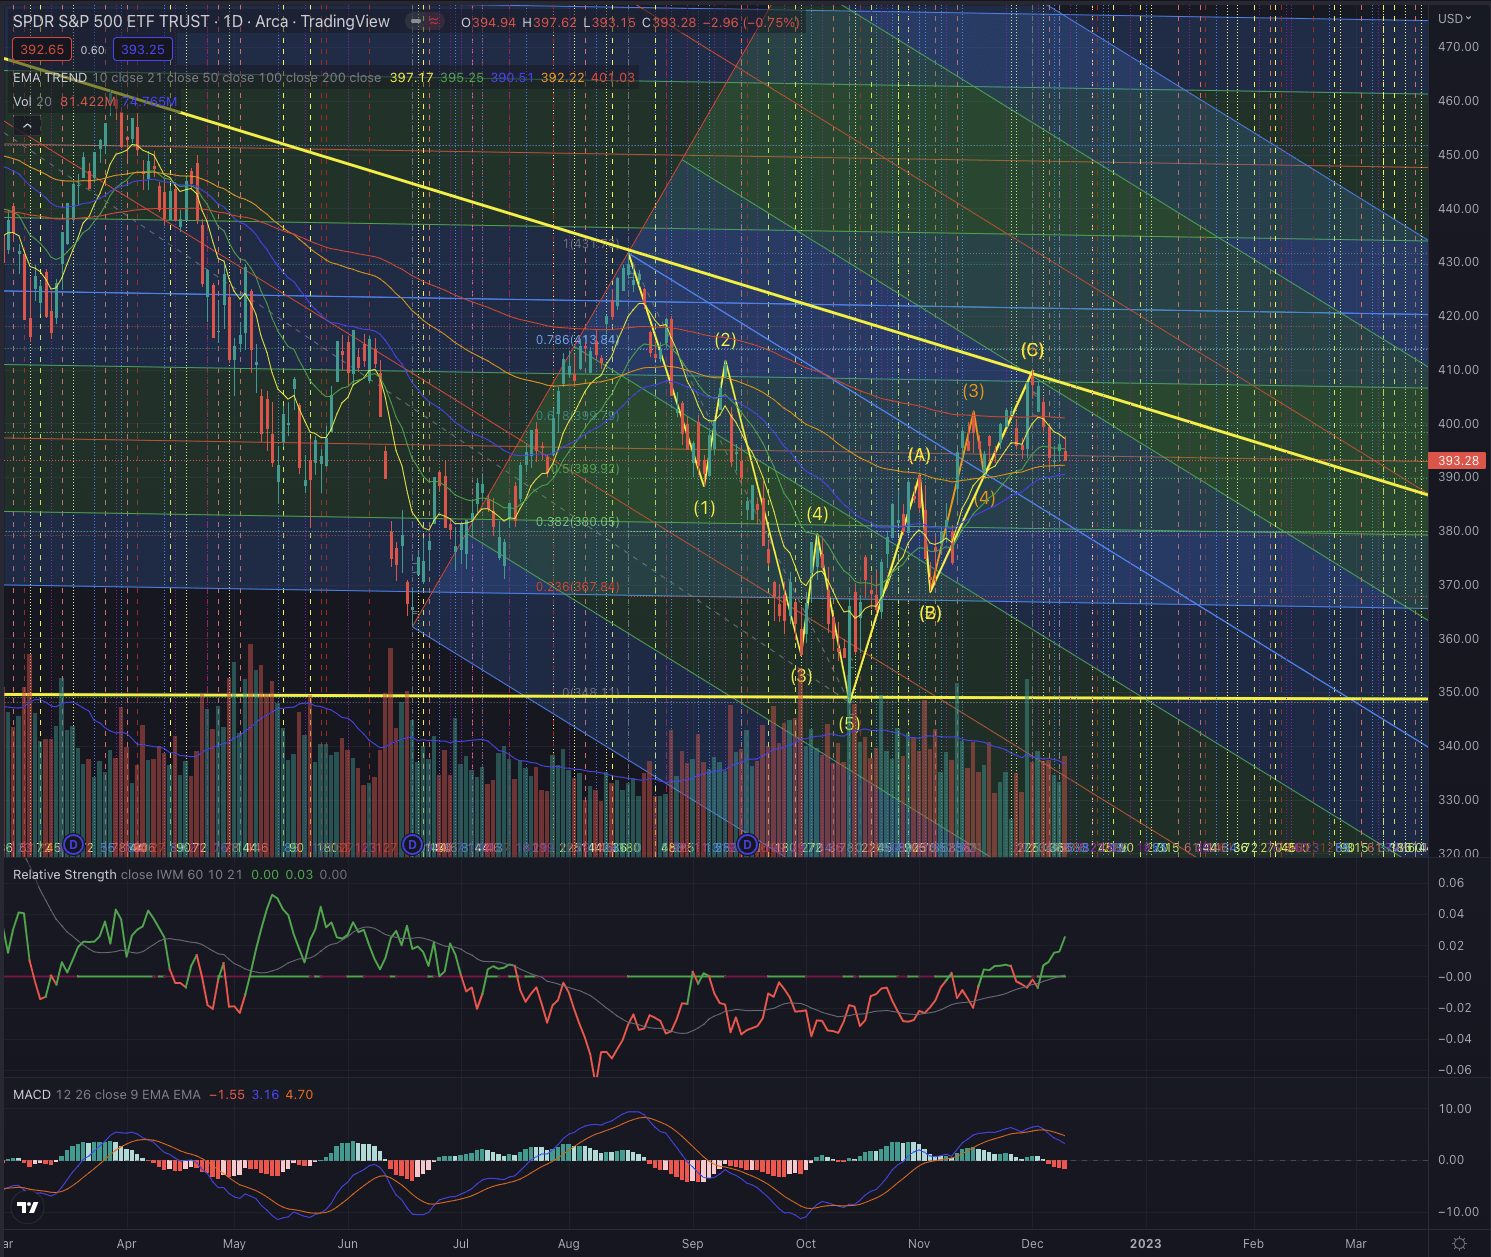
Despite the increasing pessimism and risk-aversion discussed before it is still too early for a strong signal that could lead to either a buy or sell decision. Highly risk-averse short-term investors could sell their positions now and wait on the sidelines until the important expected data will be released this week, as the short-term scenario is increasingly negative.
As a medium or long-term investor, I would instead not run into the recent forming signals and wait for more clarity, as the SPY is still above its EMA50 and on its daily chart is building up relative strength, while there are increasing signs that hint to a short-term reversal. I would consider closely the price action between the EM50 and $380, and define this as a downside tolerance level, as under it the chances are too high for seeing the SPY testing its bottom at $350. On the other hand, the most important overhead price levels to observe, are traced by the descending converging trend line; once the SPY would overcome this resistance, it is likely that the movement would be significant and marked by a massive increase in buy-side volume, likely projecting the benchmark to $420 as the first target and successively toward $452.
The bottom line
Technical analysis is not an absolute instrument, but a way to increase investors’ success probabilities and a tool allowing them to be oriented in whatever security is listed on the markets. One would not drive towards an unknown destination without consulting a map or using a GPS. I believe the same should be true when making investment decisions. I consider techniques based on the Elliott Wave Theory, as well as likely outcomes based on Fibonacci’s principles, by confirming the likelihood of an outcome contingent on time-based probabilities. The purpose of my technical analysis is to confirm or reject an entry point in the stock, by observing its sector and industry, and most of all its price action. I then analyze the situation of that stock and calculate likely outcomes based on the mentioned theories.
My approach in this article is strictly pondering indicators I consider the most important when assessing the situation of the major indexes in the US financial markets, as this is not a macroeconomic analysis, and instead focusing on the SPY, it is consciously ignoring other economic indicators that may be relevant under another perspective.
The SPY is giving some early signs of weakness, as most of the considered indicators are hinting at a reversal of the recent uptrend, with increasing risk aversion and loss in momentum. A continuation of the uptrend would most probably lead the SPY to test again its descending trend line, while this time it could mean that the index benchmark could overcome it, as it is the first time in its downtrend, where the SPY takes some breath, and consolidated just under this strong overhead resistance. At this point, I certainly don’t consider the actual price level of the SPY as a buy position, but despite the increasing negativity, I would still wait before categorizing the index reference as a sell position either. The discussed price levels are representing my risk tolerance, and I would wait until the highly expected data will be released in the coming week.
Be the first to comment