

svetikd
Current market conditions
The recent rally which started in mid-June has not yet proved itself to be more than simply an oversold bear-market rally presently.
SP500 Performance Chart (Seeking Alpha)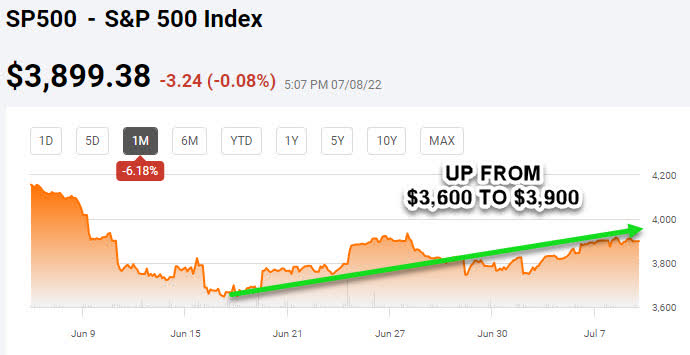
This is due to the fact it has not challenged major resistance at the $4,000 level just yet. Each of recent S&P 500 (NYSEARCA:SPY) short-term rallies this year have failed to exceed their 20-day moving average, a short-term trend indicator that serves as major resistance for rallies in declining markets.
S&P 500 chart (Seeking Alpha)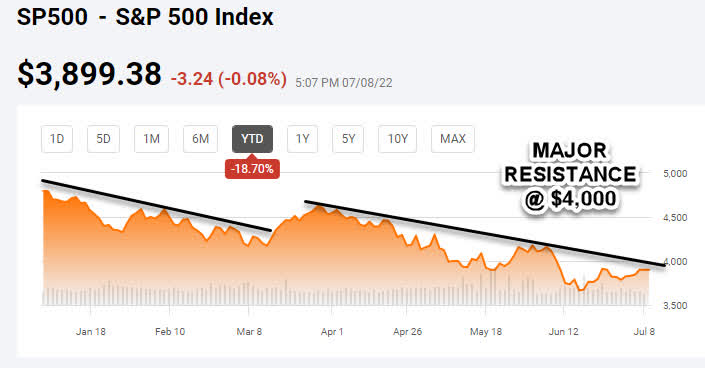
The S&P 500 looks like it’s about to make another run at its 50-day moving average at the $4,000 level from which it broke down badly in June. So, the burden of proof still remains for the bulls. Monday it seems to be foundering about 1% down at the time of this writing.
S&P 500 Current Chart (Seeking Alpha)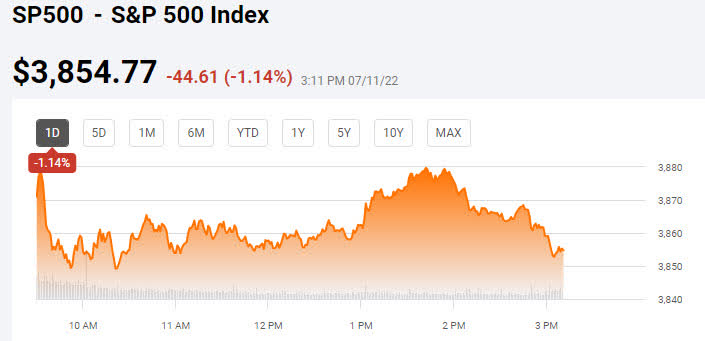
Could a breakout actually be in the works?
I am actually beginning to lean towards the bullish camp at this time actually. It has been my experience that the more the market tests an upper resistance level, the weaker it gets. This most recent rally may be the one to do the trick and actually break through the $4000 mark. The primary catalyst I see is earnings may not be as bad as many are predicting. Further, most of the downside may already be priced in. In the following sections I make my case.
The last bastion of strength takes a fall
The recent plethora of demand destruction in the energy sector and other commodities may have just provided the straw that breaks the proverbial camel’s back. The deep correction in the energy sector along with other commodities has been a blessing to the bulls. The longer-term uptrends are still intact, yet the last bastion of overconfidence (the energy sector) has been washed away for sure, a healthy occurrence for the markets in general no doubt. Furthermore, a few characteristics of the recent rally distinguish it from the previous failed forays over the past six months. This rally started from the lowest valuation, deepest oversold conditions, and the most depressed investor sentiment backdrop of any of the previous breakout attempts. The rally has definitely earned its strips, so to speak. What’s more, multiples have been severely compressed. Let me explain.
Multiples are compressed
The S&P 500 multiple dropped 25% to 16-times the current forecasted earnings. This level has served to mark the bottom in stocks several times since 2000.
S&P 500 YoY Multiple Compression (Truist)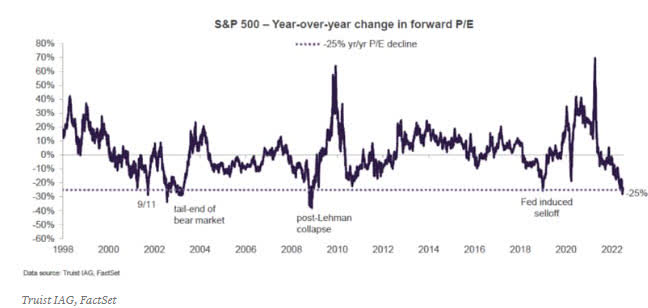
The above chart from Truist shows the degree of valuation adjustment during past major selloffs. Based on the present set-up compared to similar historical patterns, the probabilities favor positive returns coming for the next months or years if historic data holds true.
Lowered earnings expectations
The issue I’ve been wrestling with is the fact I feel this earnings season will one where management will take the easy way out and “kitchen sink” this quarter based on the fact they have plenty of “excuse ammunition” with inflation compressing margins and a looming recession in the works.
Nonetheless, I’m starting to wonder if the downside hasn’t already been priced in with the market down 20% heading into earnings. It occurred to me that this situation has to be obvious to everyone. So maybe earnings won’t cause stocks to take another leg down after all. Even so, I am going to be watching closing to see how the market reacts to the announcements. Sentiment remains solidly in the bearish camp, nevertheless.
Extreme bearish sentiment abounds
The 52-week average of bullish respondents to the weekly American Association of Individual Investors’ retail-investor survey is now below 30%.
AAII Bullish Sentiment (American Association of individual Investors)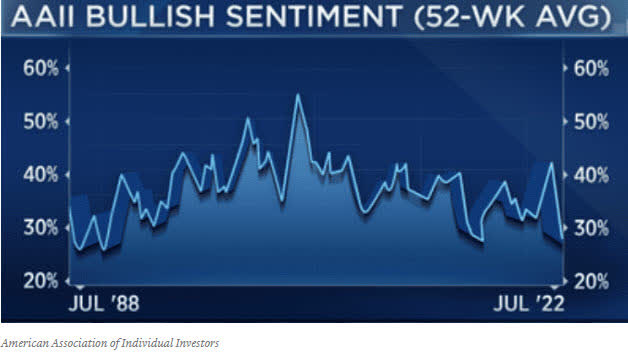
This level of bearishness has only been seen a few times over 35 years. The last reading at this level was in 2016. The Wall Street rumor mill has it that the big hedge funds are still massively short as well. I have come to see this as a contrarian indicator from my past experience. It becomes a game of chicken for the hedge funds. Eventually, one of them covers creating an initial pop, then they all race to cover their shorts before the other, causing a short covering rally to ensue. There is no choice for them. They have to buy the shares back to book the profits. It appears the inflation fever has broken as well. Here is why.
Inflation fever broken?
On the macro front, future inflation outlooks have dropped to their lows for the year, a good sign that allegedly out-of-control inflation may finally be in decline. What’s more, according to a recent report by JPMorgan,
“Markets now imply that headline inflation peaked in June and will soften sharply over the next year.”
See below chart.
CPI Realized Inflation (JP Morgan)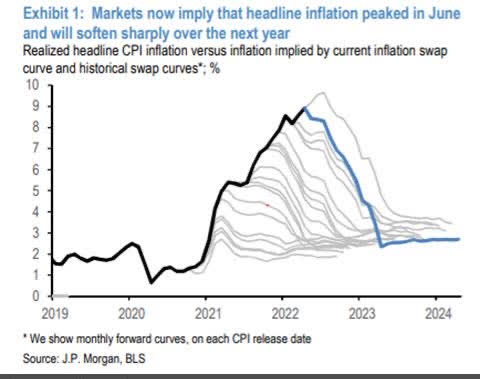
On top of this, treasury yields have pulled back to the lows they recorded in June. This is all quite uncertain, yet, for the moment, it looks as though this earnings season may not be as bad as many have predicted.
The Wrap Up
I am bullish on the market’s prospects going forward. I feel now is the time to create new positions for the next decade to come, just as it was in 2009 when I did it before. In fact, growth stocks have begun to take charge recently, which many were saying wouldn’t happen again for years, some even stated growth stocks would be dead for decades.
Russell 1000 Growth VS Value (CNBC)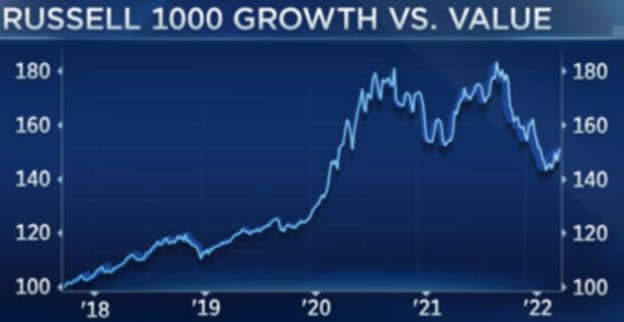
Nevertheless, challenges still remain
Yet, major challenges still remain. A late cycle slowing economy coinciding with an aggressive Federal Reserve intent stamping out inflation is a formidable mix. Friday’s healthy jobs report has eased the market’s worry over recession, but it may give the Fed cover to continue to raise rates in an effort to tame inflation. Lastly, the credit markets have firmed up in the past few days, yet were flashing concern over a weaker economy for weeks on end until now. So, take that with a grain of salt. This week’s CPI and PPI reports will be very telling. It’s a huge week for economic reports for sure.
Economic Reports (BLS.gov)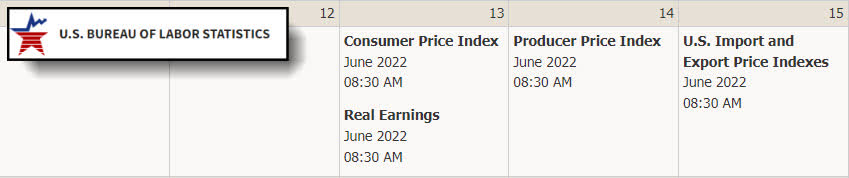
Final Note
There’s a fine art to investing during highly volatile markets such as these. It entails layering into positions over time to reduce risk. I believe the markets may have further to fall, yet attempting to perfectly time the bottom is a fool’s errand. If you have an extremely low risk tolerance I suggest waiting for a well-defined trend reversal prior to starting as position. I’m in this for the long haul, so I see an opportunity at this level for like-minded investors and retirees. You can count on this stable, growing payout for years to come. If you look at a chart of the past recessions, you will see that they always end, and don’t last nearly as long as expansions. So we will be out the other side before you know it.
Recessions Throughout History (Stlouisfed.org)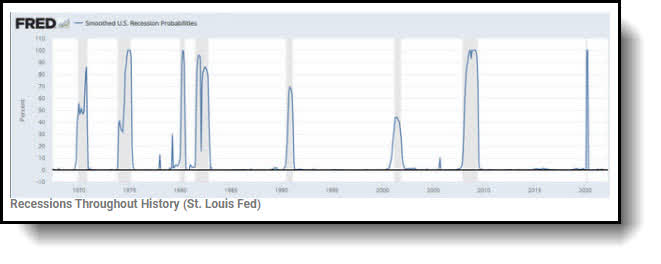
As a Veteran Winter Warrior of the US Army’s 10th Mountain Division, the attributes of patience and perseverance were instilled in me, hence my investing motto “patience equals profits.” Here’s a picture of my unit loaded into the back of a C141 heading for home after spending a few months in the jungles of Panama in 1989, a vacation I thought would never end.
C141 Panama !989 (Personal)
Those are my thoughts on the matter! I look forward to reading yours! The true value of my articles is provided by the prescient remarks from Seeking Alpha members in the comments section below. Do you think earnings will cause another leg down in the market? Why or why not?
Be the first to comment