

Bet_Noire
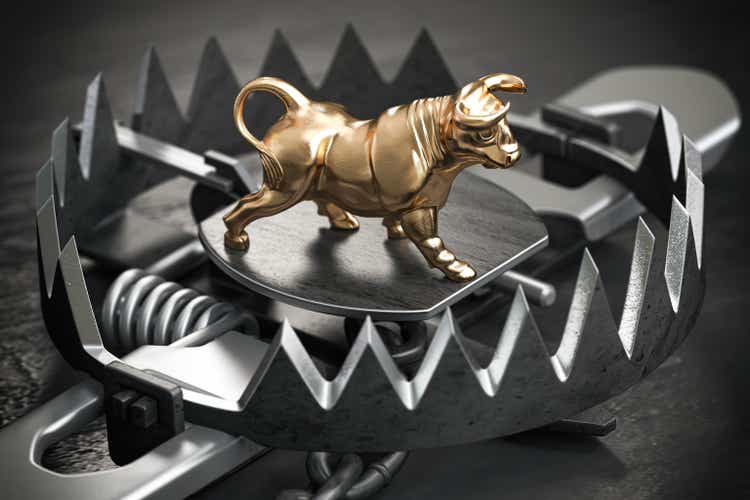
Bull traps always look nice before they snap shut and this market (NYSEARCA:SPY) is no different. This short-term bull, in a bear market, has had a Santa Rally, an up first week in January and likely an up period for the month of January. These are all bullish signals and the bulls were sucked into paying too much for stocks. They’re mainly the Index funds and the ETF funds they have to buy because of continuous inflows of money into the market. However, there’s also premature bargain hunting in tech stocks.
We know professional portfolio managers sell their losers and overvalued stocks into this kind of market strength. We know they will do their buying at the bottom of this bear market. They do not buy bounces in a bear market. But how do we know this is a bull trap? The fundamentals and the technicals tell us so.
Fundamentals
The primary, fundamental driver of this bear market is interest rates going up. That has not stopped yet. The market is anticipating that it will stop soon. Even when the rate increases stop, the market has not fully discounted the recession that continued, high interest rates will create.
The market is discounting a mild recession. The market is in no race to find a bottom because things are just dandy. There’s full employment, consumers are spending and inflation is dropping.
Inflation, of course, is driving the Fed to raise interest rates and can be considered the prime mover creating this Fed bear market. The consumer is fat and happy, but a little annoyed about inflation and wages. The Fed is not fat and happy. They won’t be until inflation drops closer to 2%. That probably won’t happen until 2025. That means interest rates won’t drop until 2024. That implies that the bottom of this bear market will occur in late 2023 or early 2024.
Before we see a bottom to this bear market one of two things has to happen. Inflation has to fall more dramatically than it is currently falling. Or unemployment has to increase more dramatically than it’s currently increasing. If either one or both of these happens, the Fed will drop interest rates, but neither of these will happen tomorrow. That’s why the market is having a bounce in a bear market. When the market sees a big jump in unemployment and a recession on the horizon, it will drop to form the bottom of this bear market.
Since the fundamentals indicate we are not even close to a market bottom, we know this pop in a bear market will end badly for the bulls. Let’s not even consider the exogenous factors of disruption, like the war in Ukraine. (War spending really adds to inflation.) Let’s not talk about what COVID will do to China, especially after the Year of the Rabbit celebrations that are going on all over China. Needless to say Europe also is facing a worse recession than ours and a Russian energy squeeze.
The drop in corporate earnings is a lagging indicator and the market has not fully discounted that yet. Instead, stocks pop when layoffs are announced. (Layoffs are a sure sign that earnings misses are coming for those companies.) Let’s estimate that S&P earnings drop to $200 and the PE drops to 15. That gives me a $300 target for the SPY, yet the SPY is bouncing above $400. That sounds like a bull trap to me if ever there was one.
Technicals
Below is our weekly SPY chart showing the bull trap ready to snap:
At the top of the chart is our proprietary, fundamental and technical Sell Signal. You can see in recent, past bounces in this bear market, that our signal has improved. That is not happening with this weak bounce moving above $400.
Below our SID Sell Signal are the price trends. You can see the lower-highs and lower-lows in price, the typical, unbroken pattern of this bear market. You can see price is desperately trying to get above the red, down arrow, trend pattern we have drawn on the chart. When the bull trap slams shut, price will drop away from this red arrow as it has in the past. How far will it drop? That depends on when the market sees the recession coming and how bad that recession is.
Next is Chaikin Money Flow and you can see how weak this signal is compared to the past. There are no big, positive money flows creating this bounce. This bounce is built on sand, not concrete. The first wave of bad news will take the SPY down, trapping the bulls.
Below money flow, is the MACD signal. You can see the bars on the bar chart outlining buying and selling cycles. You can see the latest buying cycle peaked and the bars started dropping. Then they restarted up, surprisingly, instead of continuing down in a selling cycle. That’s the current bounce we’re having above $400. It was a positive surprise. Just below the bars are up-trending lines. When these turn down the bull trap will have snapped.
Next is the ADX signal. By looking back at the big swings in the red (supply) and green (demand) signals, you can see this signal is very weak. This bounce is very weak. When the red line soars, the bull trap will have snapped close.
Finally at the bottom of the chart is the Full STO signal that triggers our blue, vertical line buy signal and red line sell signal. We expected this signal to drop to the bottom as it did last time. However, like the MACD, it surprised us and turned up, reflecting the weak bounce the SPY is having above $400. When this signal reverses direction, we will draw the red line, sell signal telling us the bull trap just closed down on the bulls.
Here’s the weekly chart with our comments on each signal:
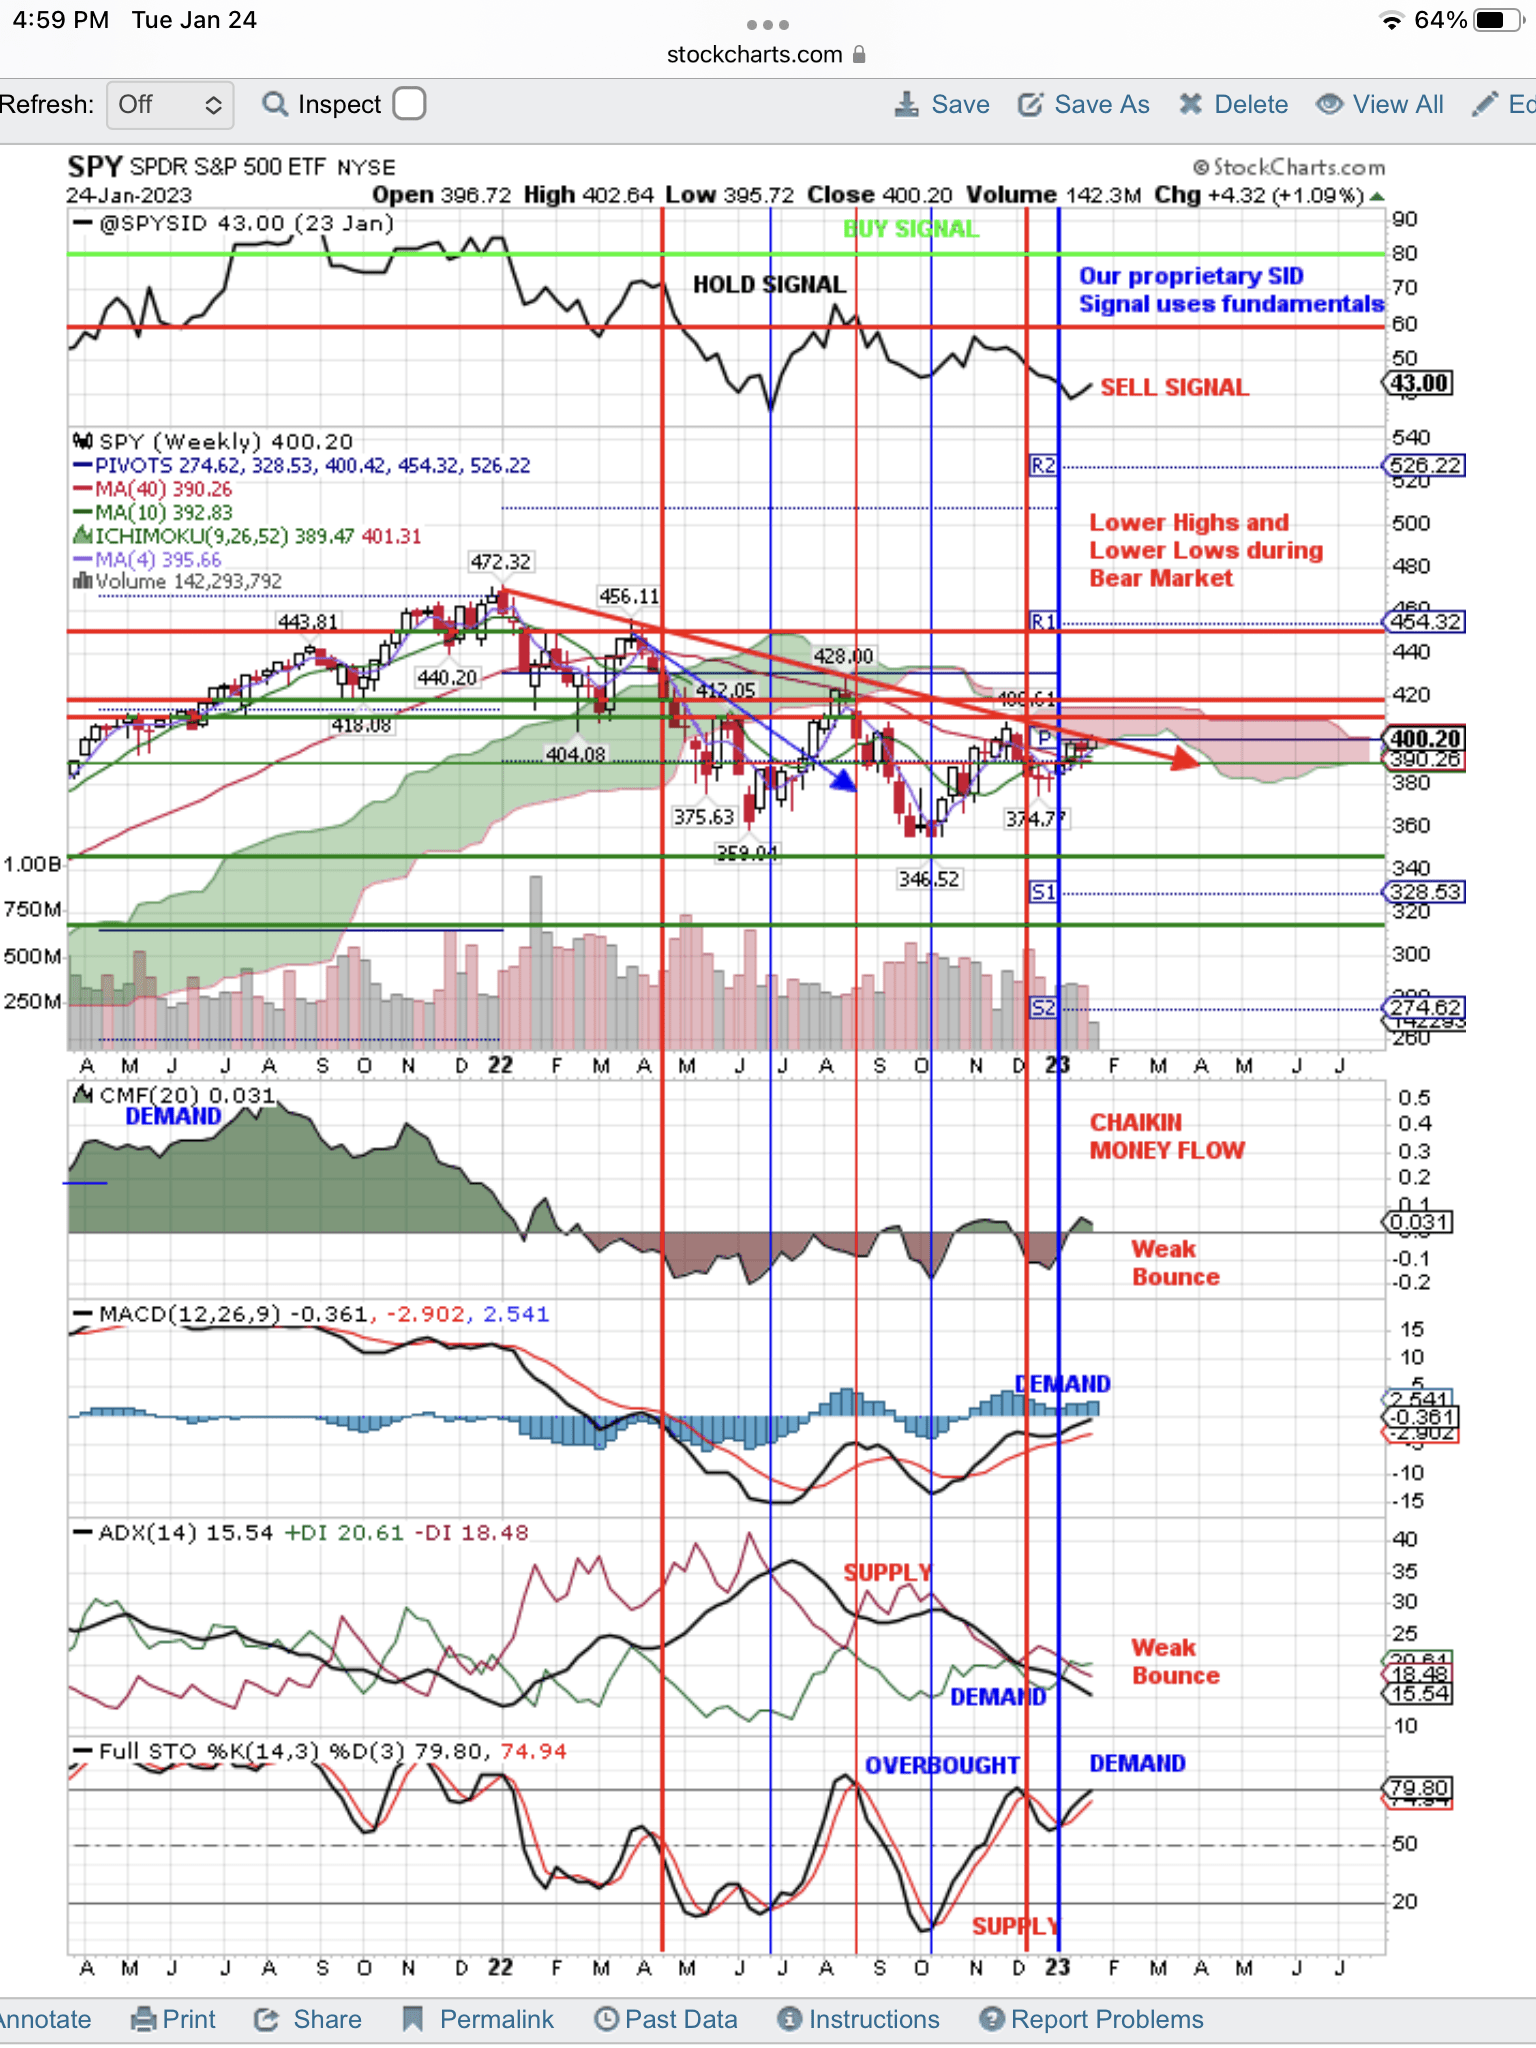
Buy Signals Turn To Sell Signals Trapping The Bulls (StockCharts.com)
Be the first to comment