

Galeanu Mihai/iStock via Getty Images
Introduction
I’m quoting from ProShares website the paragraph below as it best explains the leveraged inverse ETF that we discuss in this article.
“This short ProShares ETF (NYSEARCA:SPXU) seeks a return that is 3x the return of its underlying benchmark (target) for a single day, as measured from one NAV calculation to the next. Due to the compounding of daily returns, holding periods of greater than one day can result in returns that are significantly different than the target return, and ProShares’ returns over periods other than one day will likely differ in amount and possibly direction from the target return for the same period. These effects may be more pronounced in funds with larger or inverse multiples and in funds with volatile benchmarks”.
-
Seek to profit from a market decline
-
Help to hedge against an expected decline
-
Underweight exposure to a market segment
Shorting versus Inverse ETF
Before we dive deep into SPXU let us just review some of the reasons to use an inverse ETF.
- Shorting stocks has unlimited risk, as the stock can go higher for a long time. The loss in inverse ETF is the amount that one puts into the ETF.
-
“An advantage of inverse ETFs is that they do not require the investor to hold a margin account, as would be the case for investors wanting to enter into short position on a stock or ETF”.
-
Some stocks or ETFs cannot be shorted due to lack of stock available to short.
-
Shorting might not be permitted within a retirement account like an IRA, as they are not margin accounts.
SPXU not a long-term hold
SPXU has not been a good long-term investment. Inverse leveraged ETFs are highly volatile investments, as their losses typically compound daily. The chart below illustrates the loss in value over time.
SPXU Long Term Chart (Author)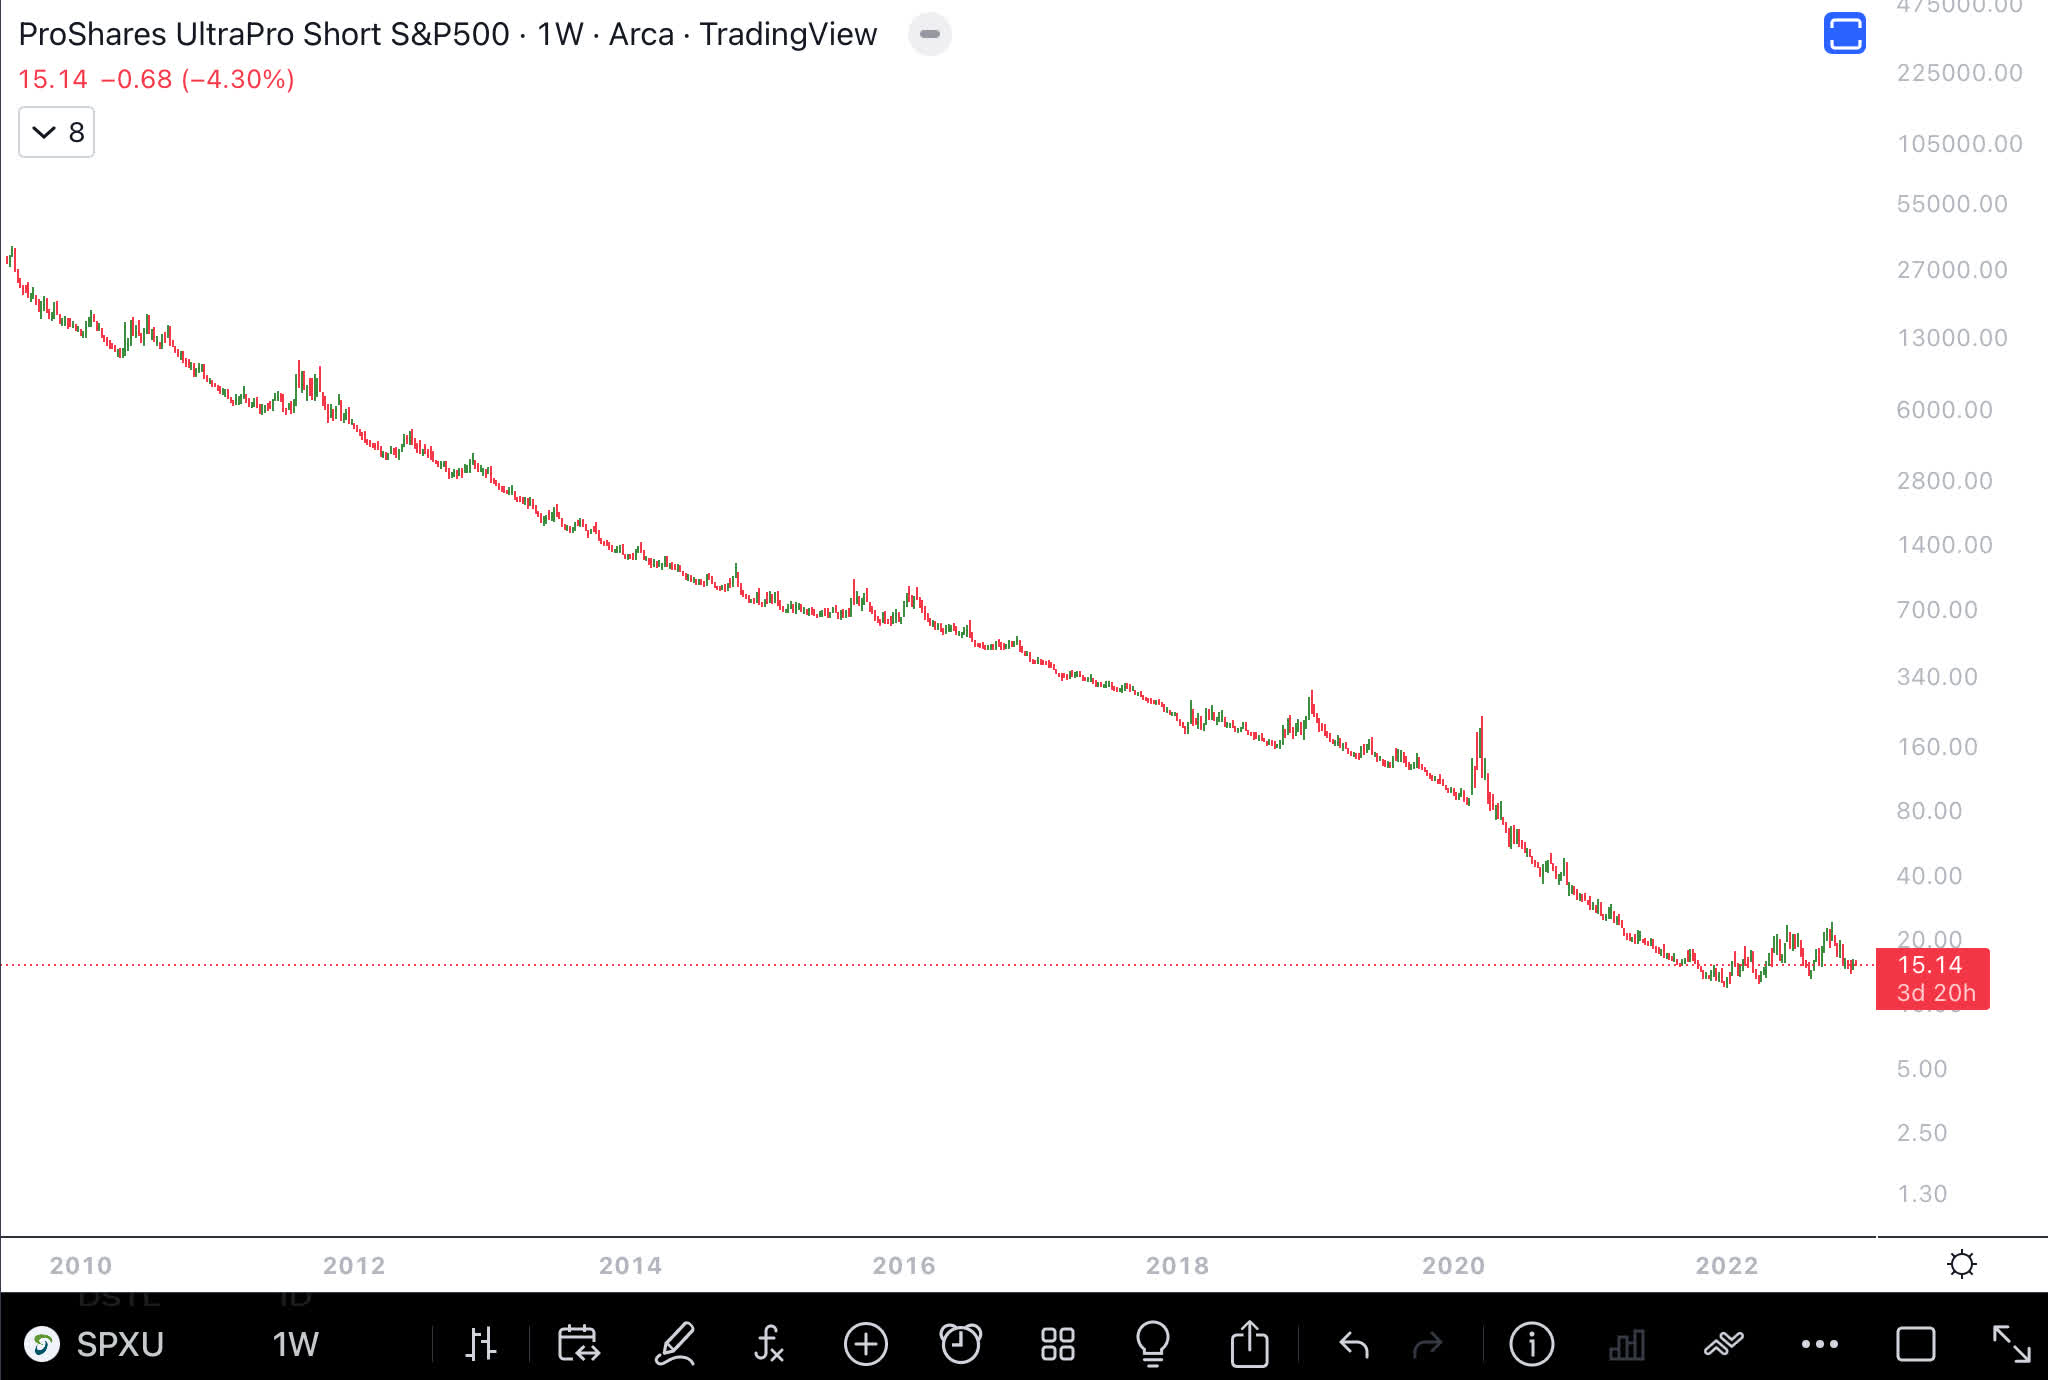
However, in uncertain times like this one, a sophisticated investor can use SPXU to hedge an equity portfolio. SPXU is an alternative to going completely into cash, especially in a taxable account where one could be hit with taxes. The objective is to trade the SPXU to take advantage of the market volatility due to negative sentiment. The chart below compares the S&P 500 to the SPXU in 2022. Take note of how the troughs in the S&P 500 correspond to the peaks in the SPXU. Technical analysis could be one way to know when to use SPXU to hedge a portfolio.
S&P 500 & SPXU Chart (Author)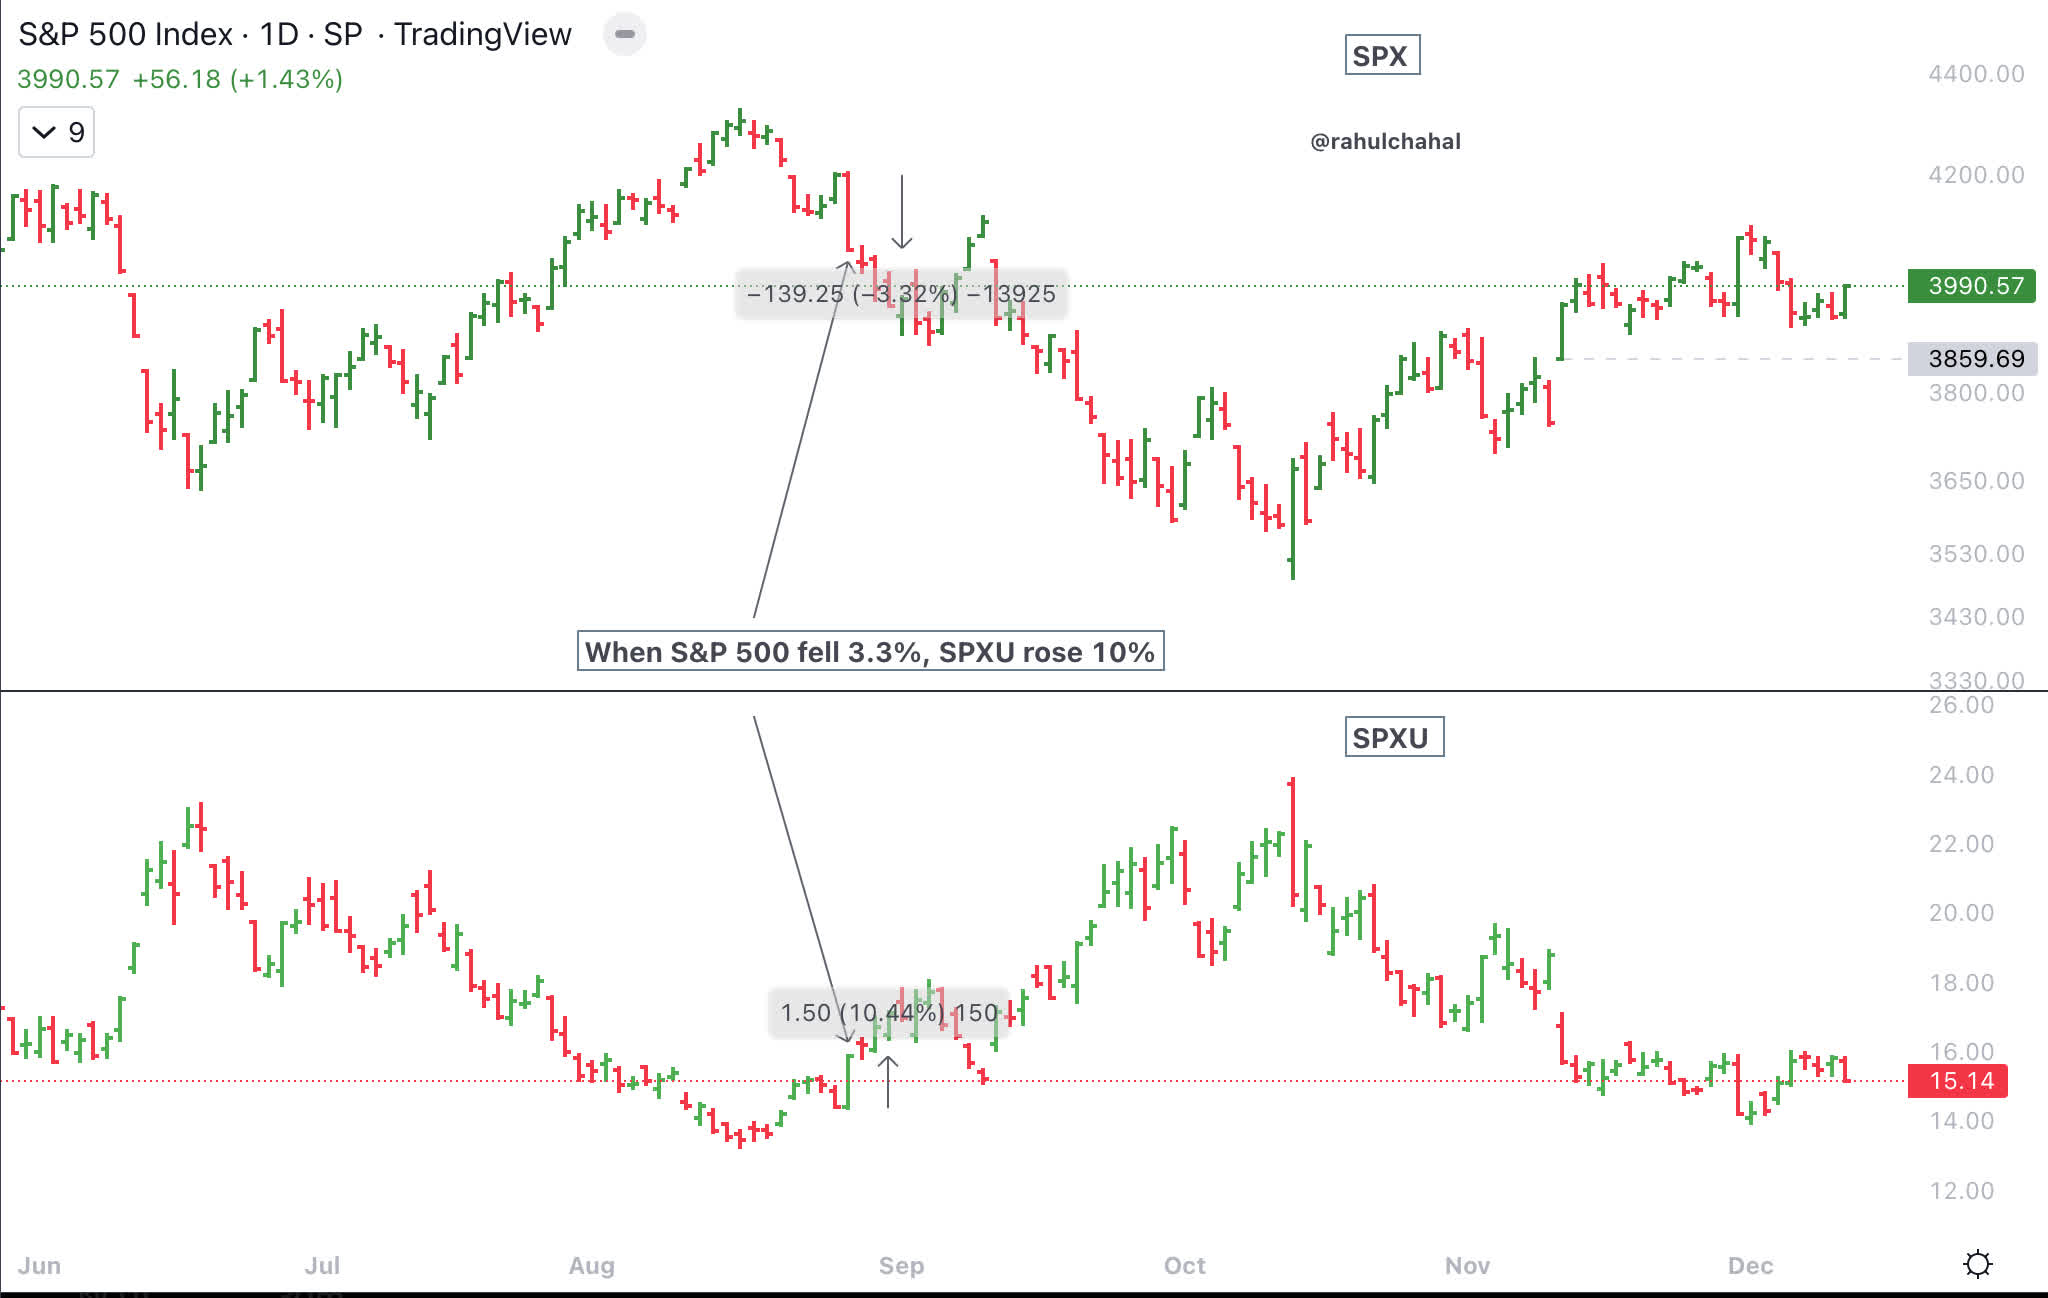
Hedging using SPXU
The S&P 500 chart is shown below. As you can read in the notes, the levels I am watching are either breaking out above 4350 or breaking below 3850. I am showing a way I would possibly use SPXU to hedge my portfolio, and this is not investment advice. The level of 3850 for the S&P 500 is based on the technical analysis technique of anchored volume weighted average price (AVWAP). The 2022 lows, early November lows, and August 2022 highs serve as anchors for this AVWAP. As one can see in the chart, the S&P 500 since mid-October has been making higher and higher lows. If the S&P 500 closes below 3850, it will not only breach multiple AVWAPs, but it will also breach a string of higher lows. When the S&P 500 closes below 3850, that would be the time to consider buying SPXU. The S&P 500 is likely to go down to retest or break below 3491 (2022 lows) once it breaks below support at 3850.
S&P 500 Chart with moving averages (Author)
Trading SPXU
Some traders like to trade leveraged ETFs, as one can use them to amplify day trading or short-term swing trading results. Here is an example of how I would consider using SPXU for short-term trading. I would create support and resistance zones I would be watching or use support and resistance based on the central pivot range (CPR). CPR gives one pre-calculated resistance and support based on price action. To day trade one would have to develop a plan, test and build multiple strategies, plus have trade management and discipline to follow the plan.
In the example below, I am using weekly and daily CPR levels. The solid lines in the chart are weekly CPR, while the dotted lines are daily CPR. So to go long SPXU, I would use the 30-minute chart of the S&P 500 chart. Since SPXU is leveraged inversely to the S&P 500, we are looking for a break below predetermined levels. I look for price breaks below the weekly CPR before coming back and failing at the weekly CPR. As the S&P 500 goes down, SPXU goes up three times within the day. I take profits in SPXU when the price bar of the S&P 500 goes above the daily CPR, which happened on December 8th.
S&P 500 30 minutes chart (Author)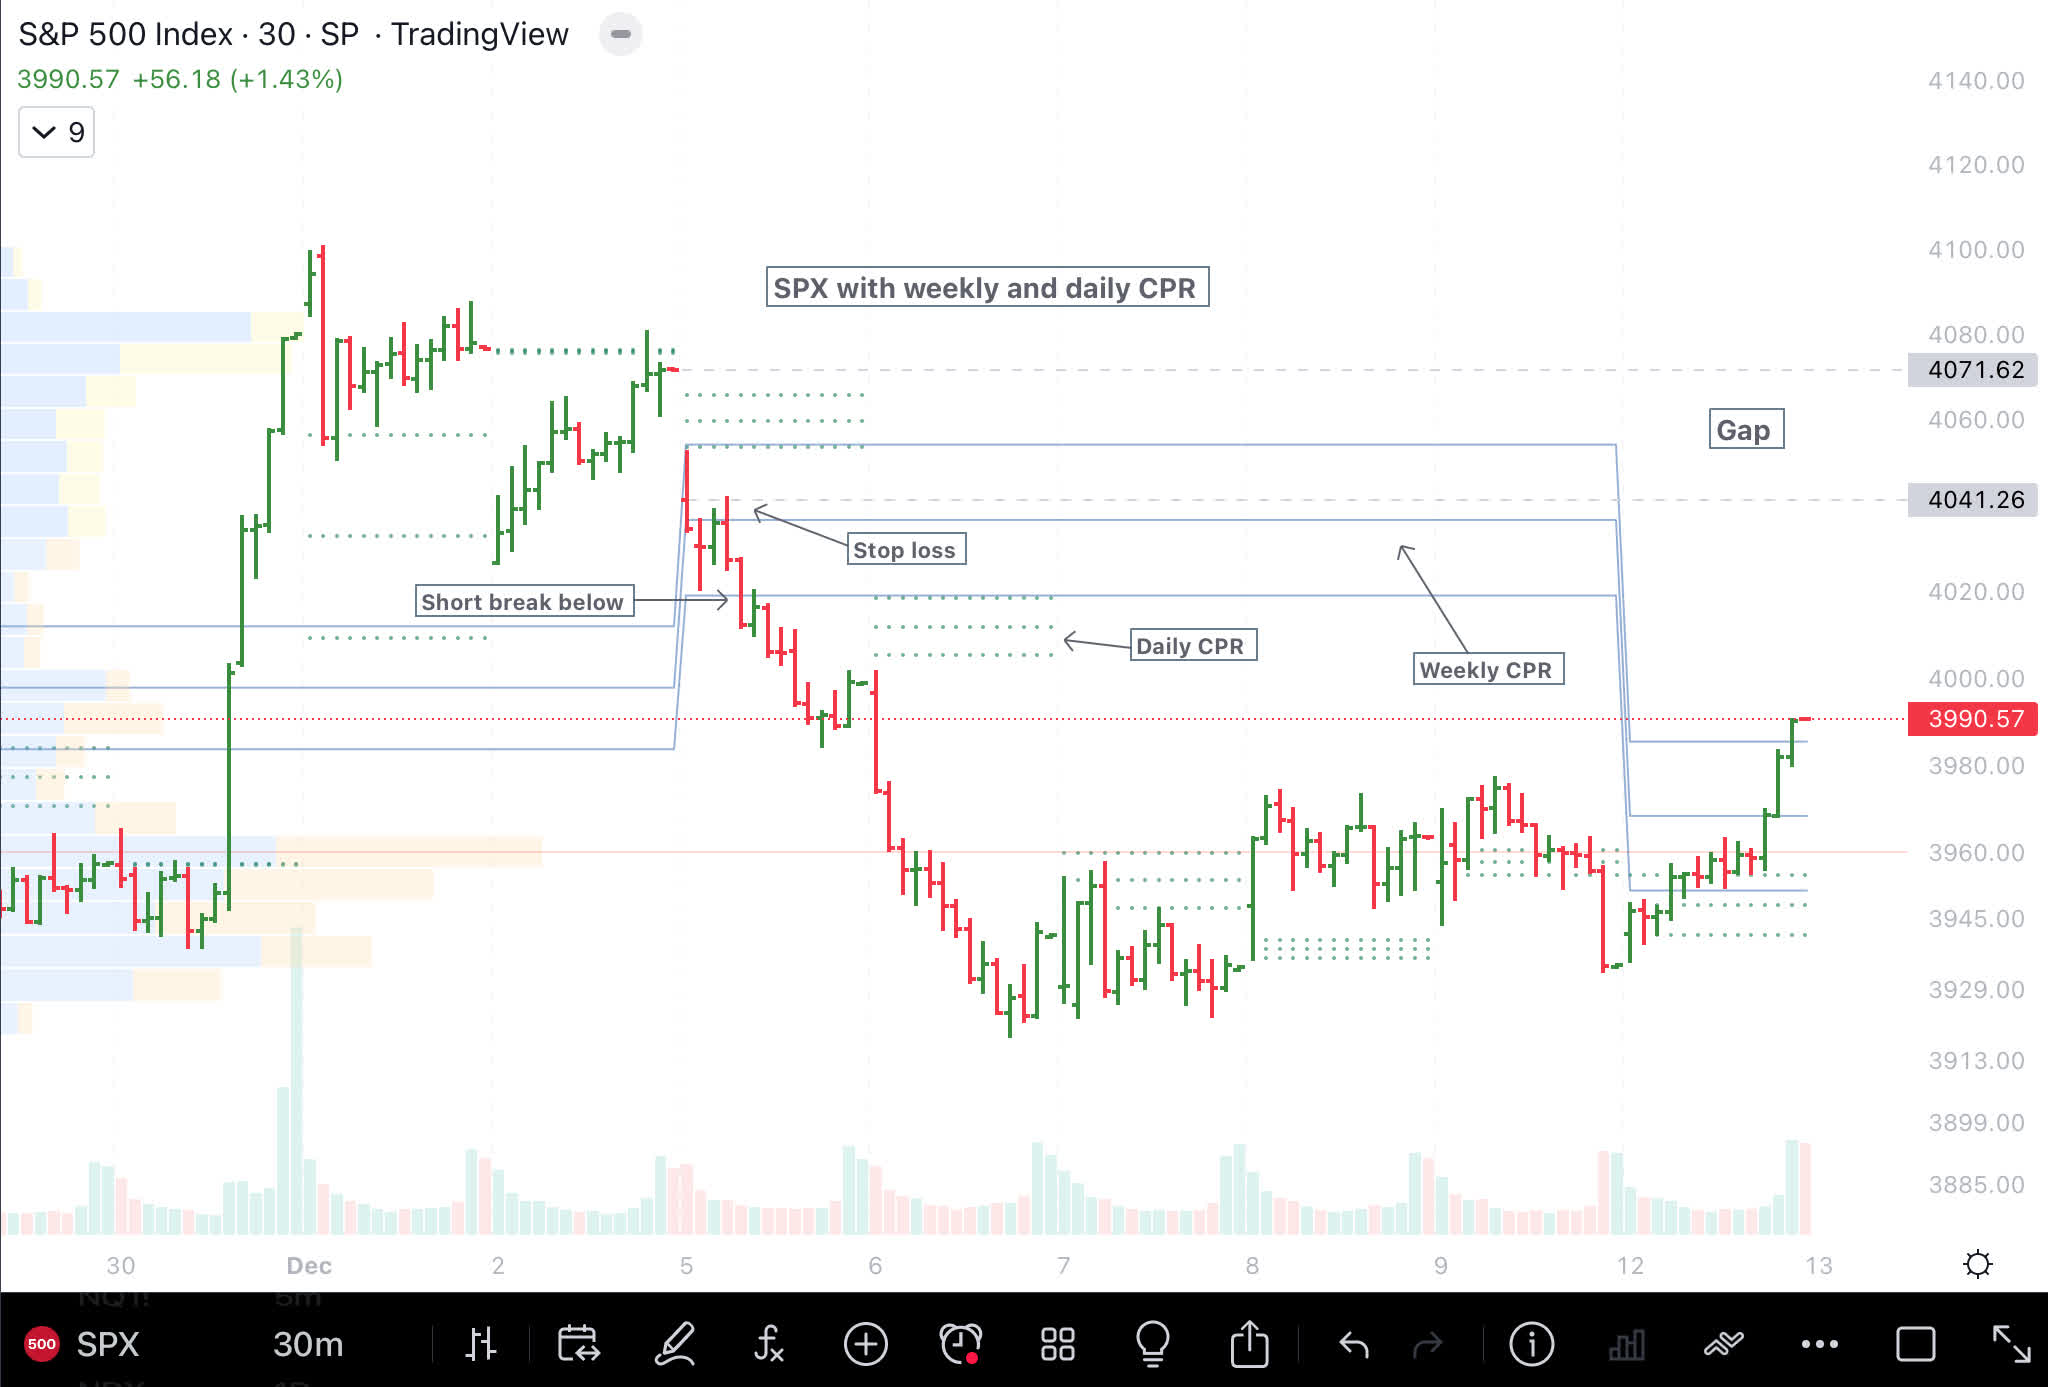
To trade, the above chart is used to make decisions to buy, stop loss, and sell. However, we are buying SPXU as a short-term trade as shown in the labeled chart below.
SPXU 30 minutes Chart (Author)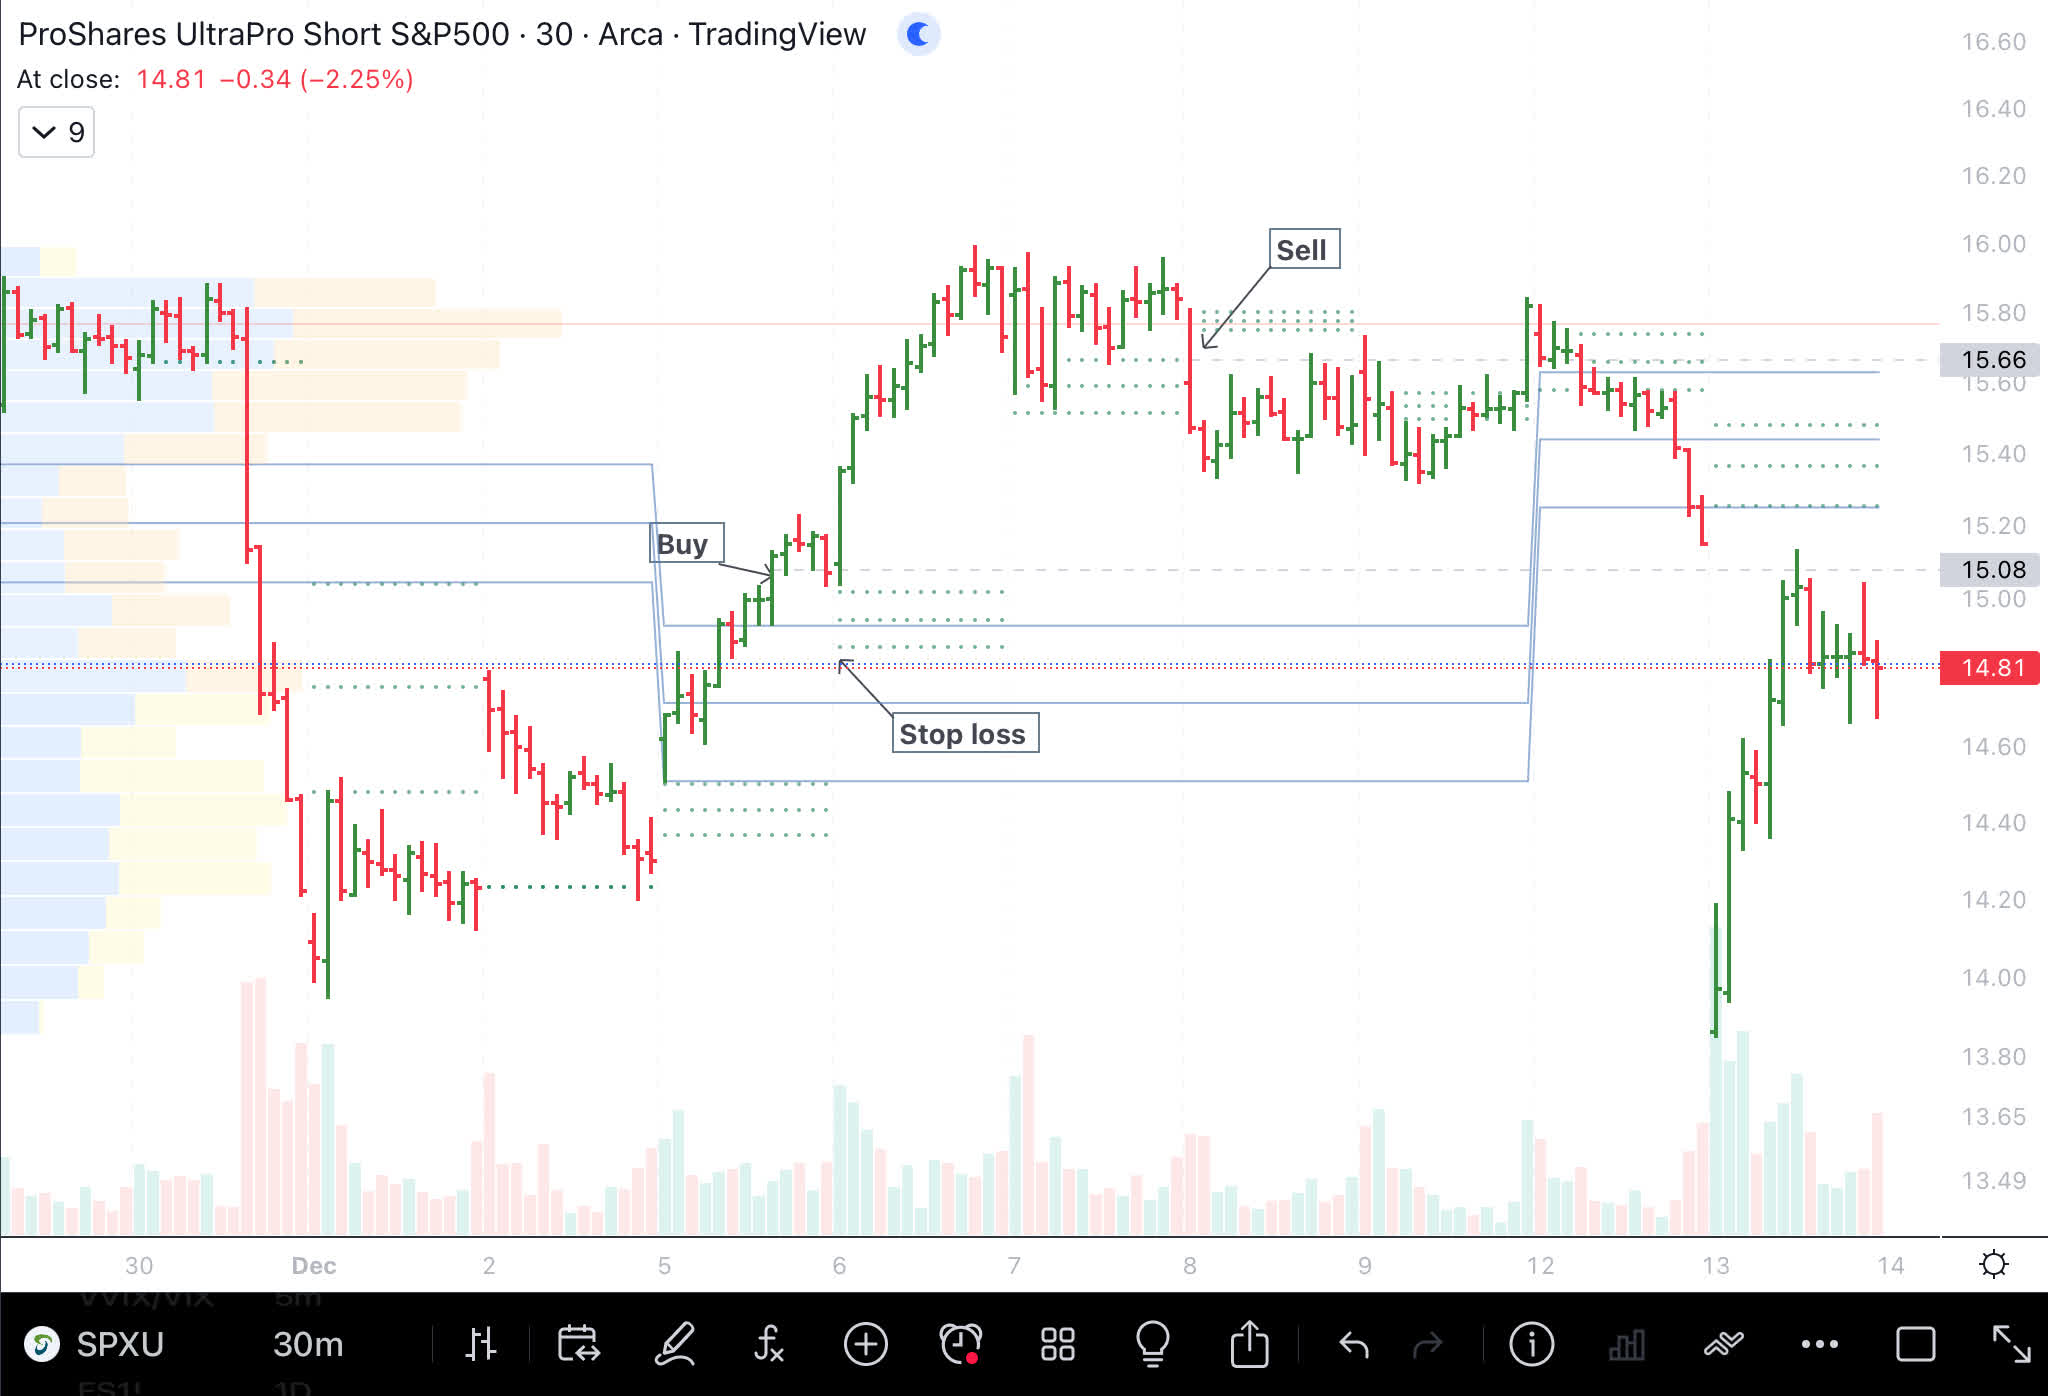
Final thoughts
My advice would be to be very careful with inverse leveraged ETF, as stock markets generally go higher. If one were to buy SPXU to hedge or to trade, then it is best to limit to a small percentage of one’s portfolio. For most investors, I would recommend to avoid inversely leveraged ETF’s in general. Over the long term, S&P 500 is likely to go up or sideways 65% of the time.
Be the first to comment