

D-Keine
Thesis
In this article, we will analyze whether equities are creating a bottoming pattern based on inflation, interest rates, and the dollar. Does the data support our thesis that the S&P 500 Index (SP500, SPX) is creating a base? While the S&P 500 broke below its June low in October, it is now trading sideways. Equities have factored into their valuation higher energy costs and lower growth for the coming months. Since January 4th, 2022, equities have gone down expecting bad economic news and lower earnings.
Inflation and Bond Yields
The CPI report was taken positively by the bond market last week since the U.S. 10-year Treasury broke down and closed the week below 4%. My interpretation is that the U.S. bond market had a sigh of relief. The average CPI for the last four months, if annualized, is about 2.7%. As shown in the chart below, there has been a significant drop in month-over-month inflation numbers in the past four months.
CPI Monthly (Bureau of Labor Statistics )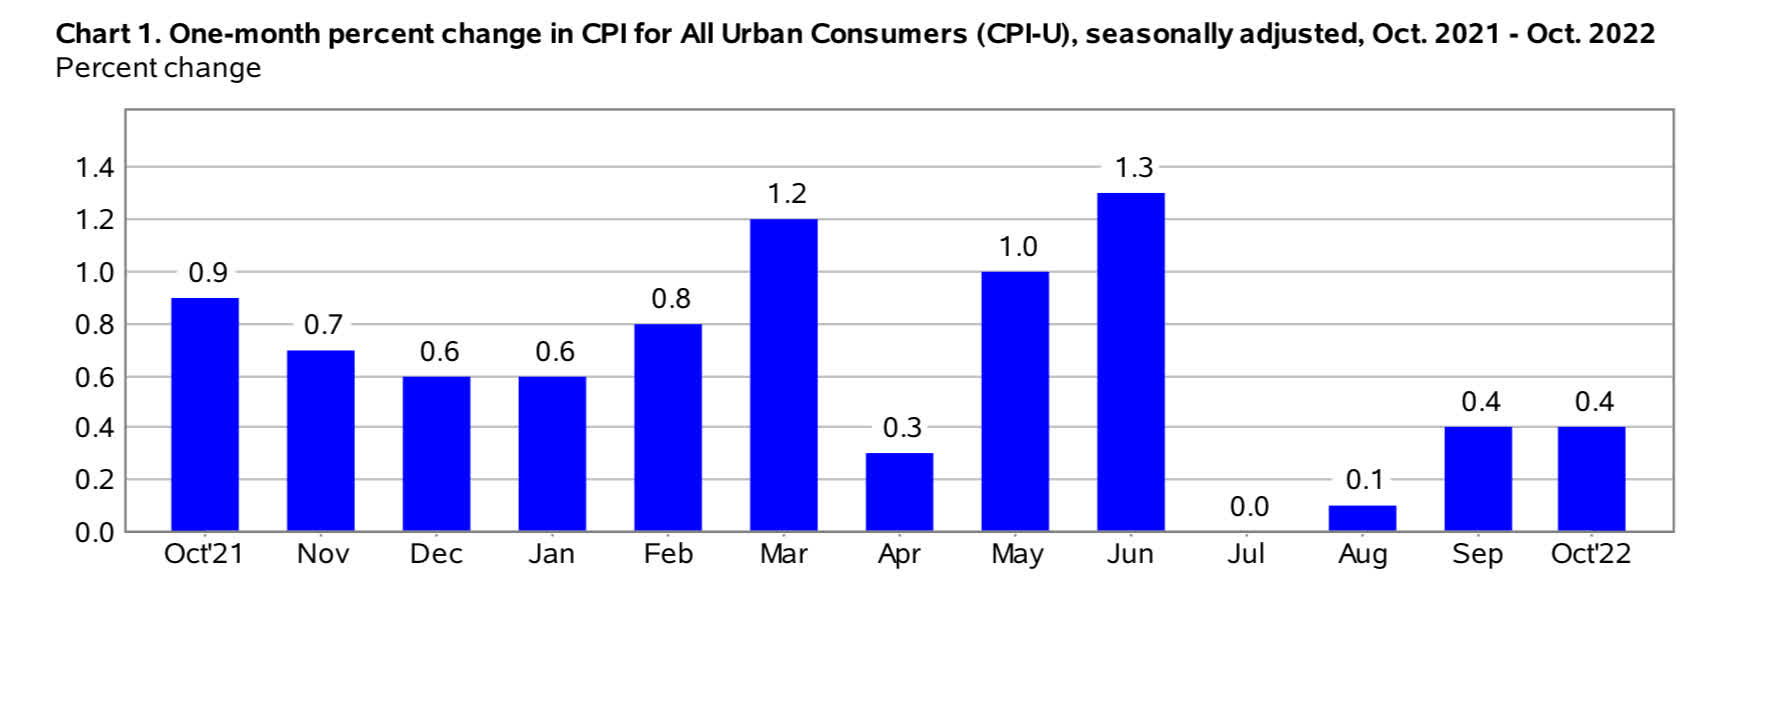
A lower trend in inflation is good news for treasury prices. Below is the chart of the U.S. 10-year treasury, which after going sideways for a few weeks has now broken to the downside.
10 year (Author )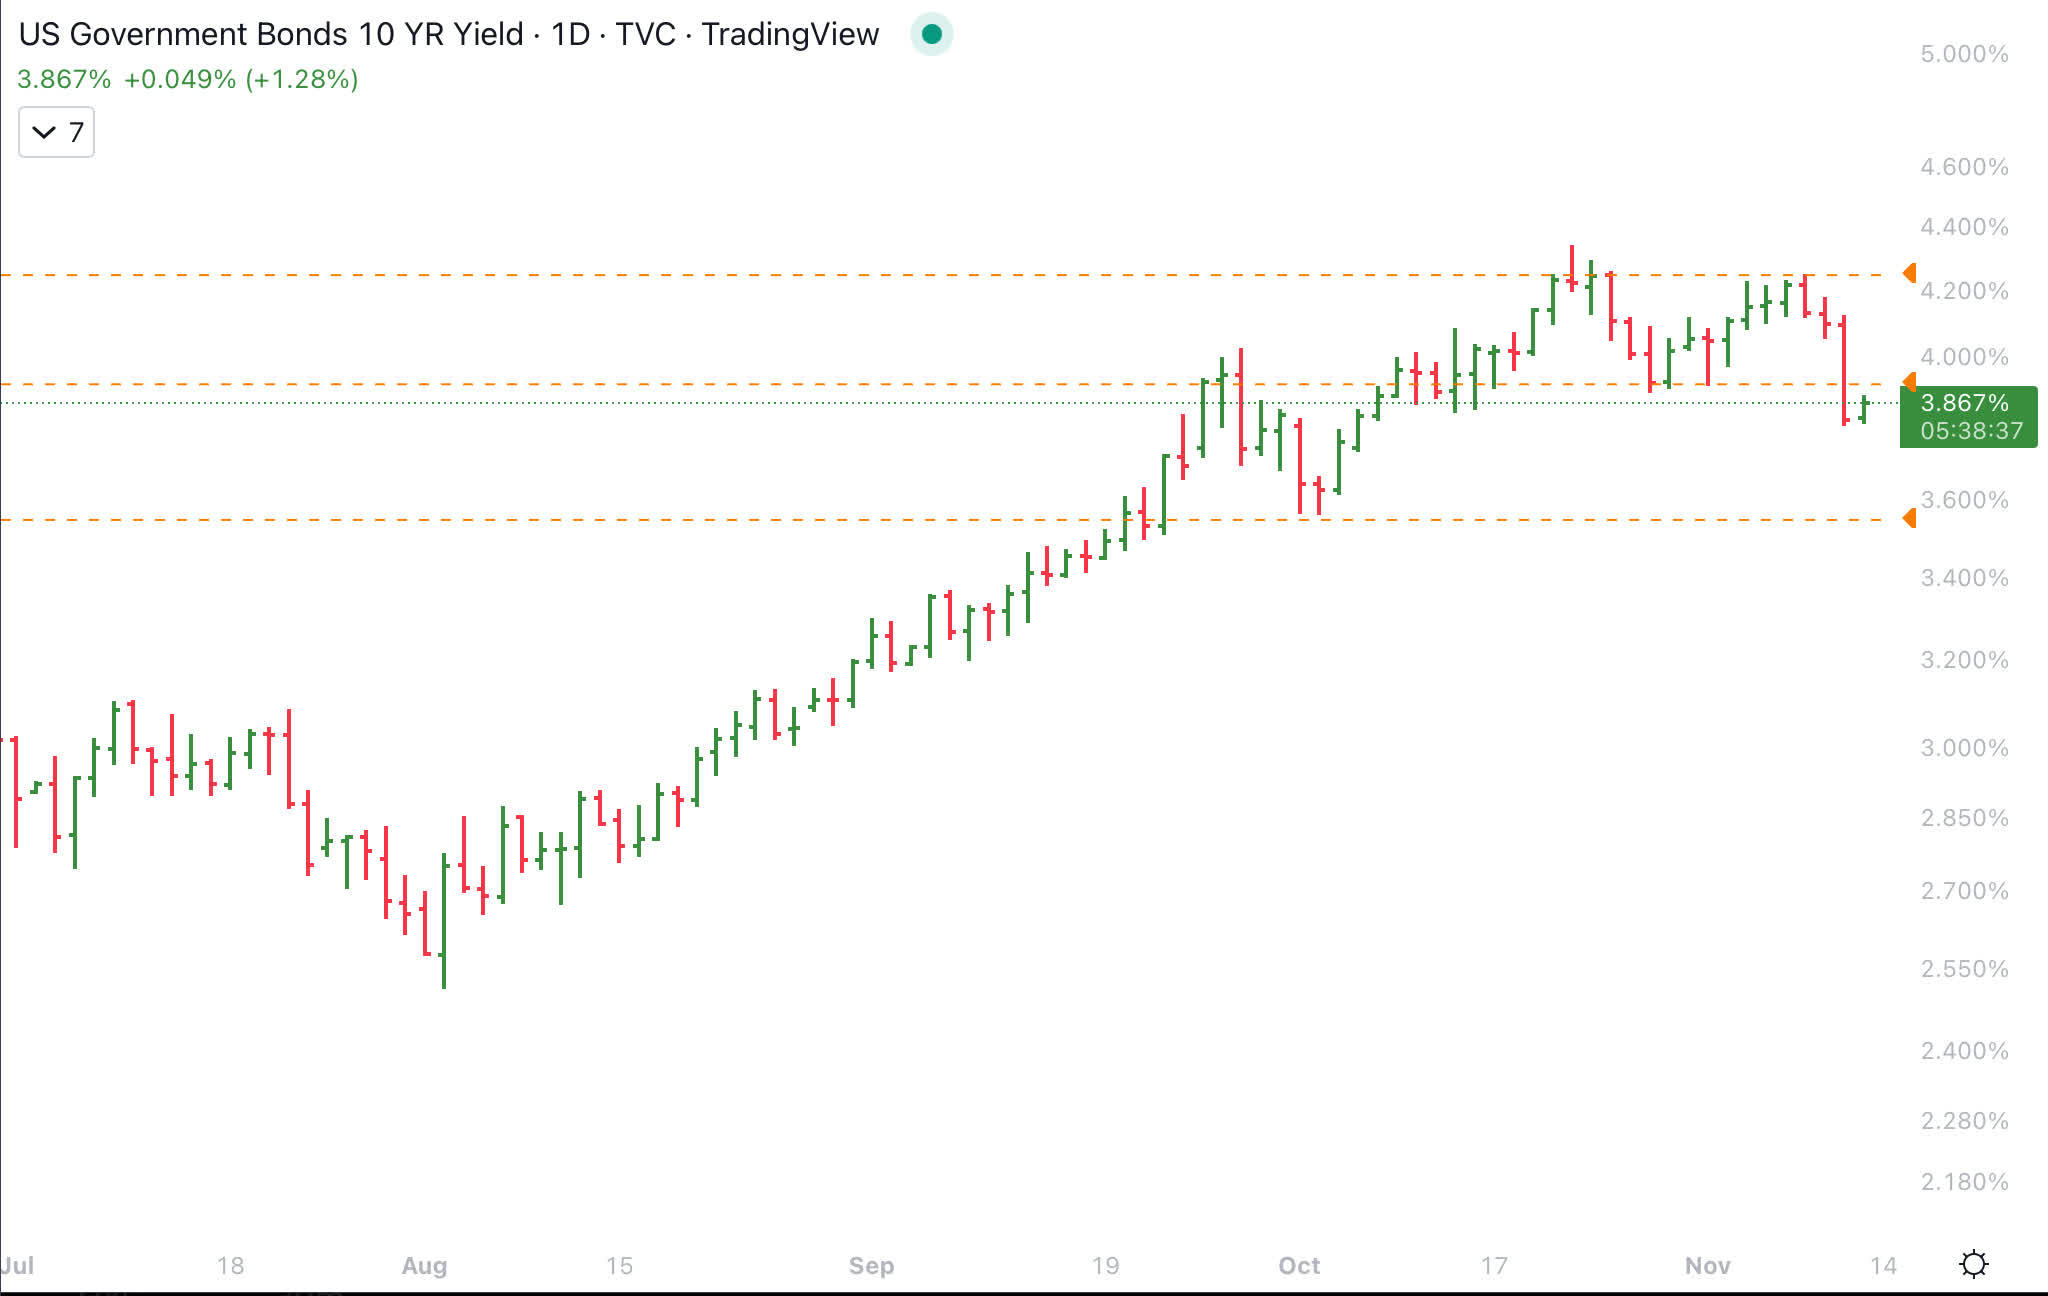
The U.S. 2-year treasury chart also reacted positively to the latest CPI data.
2 year (Author )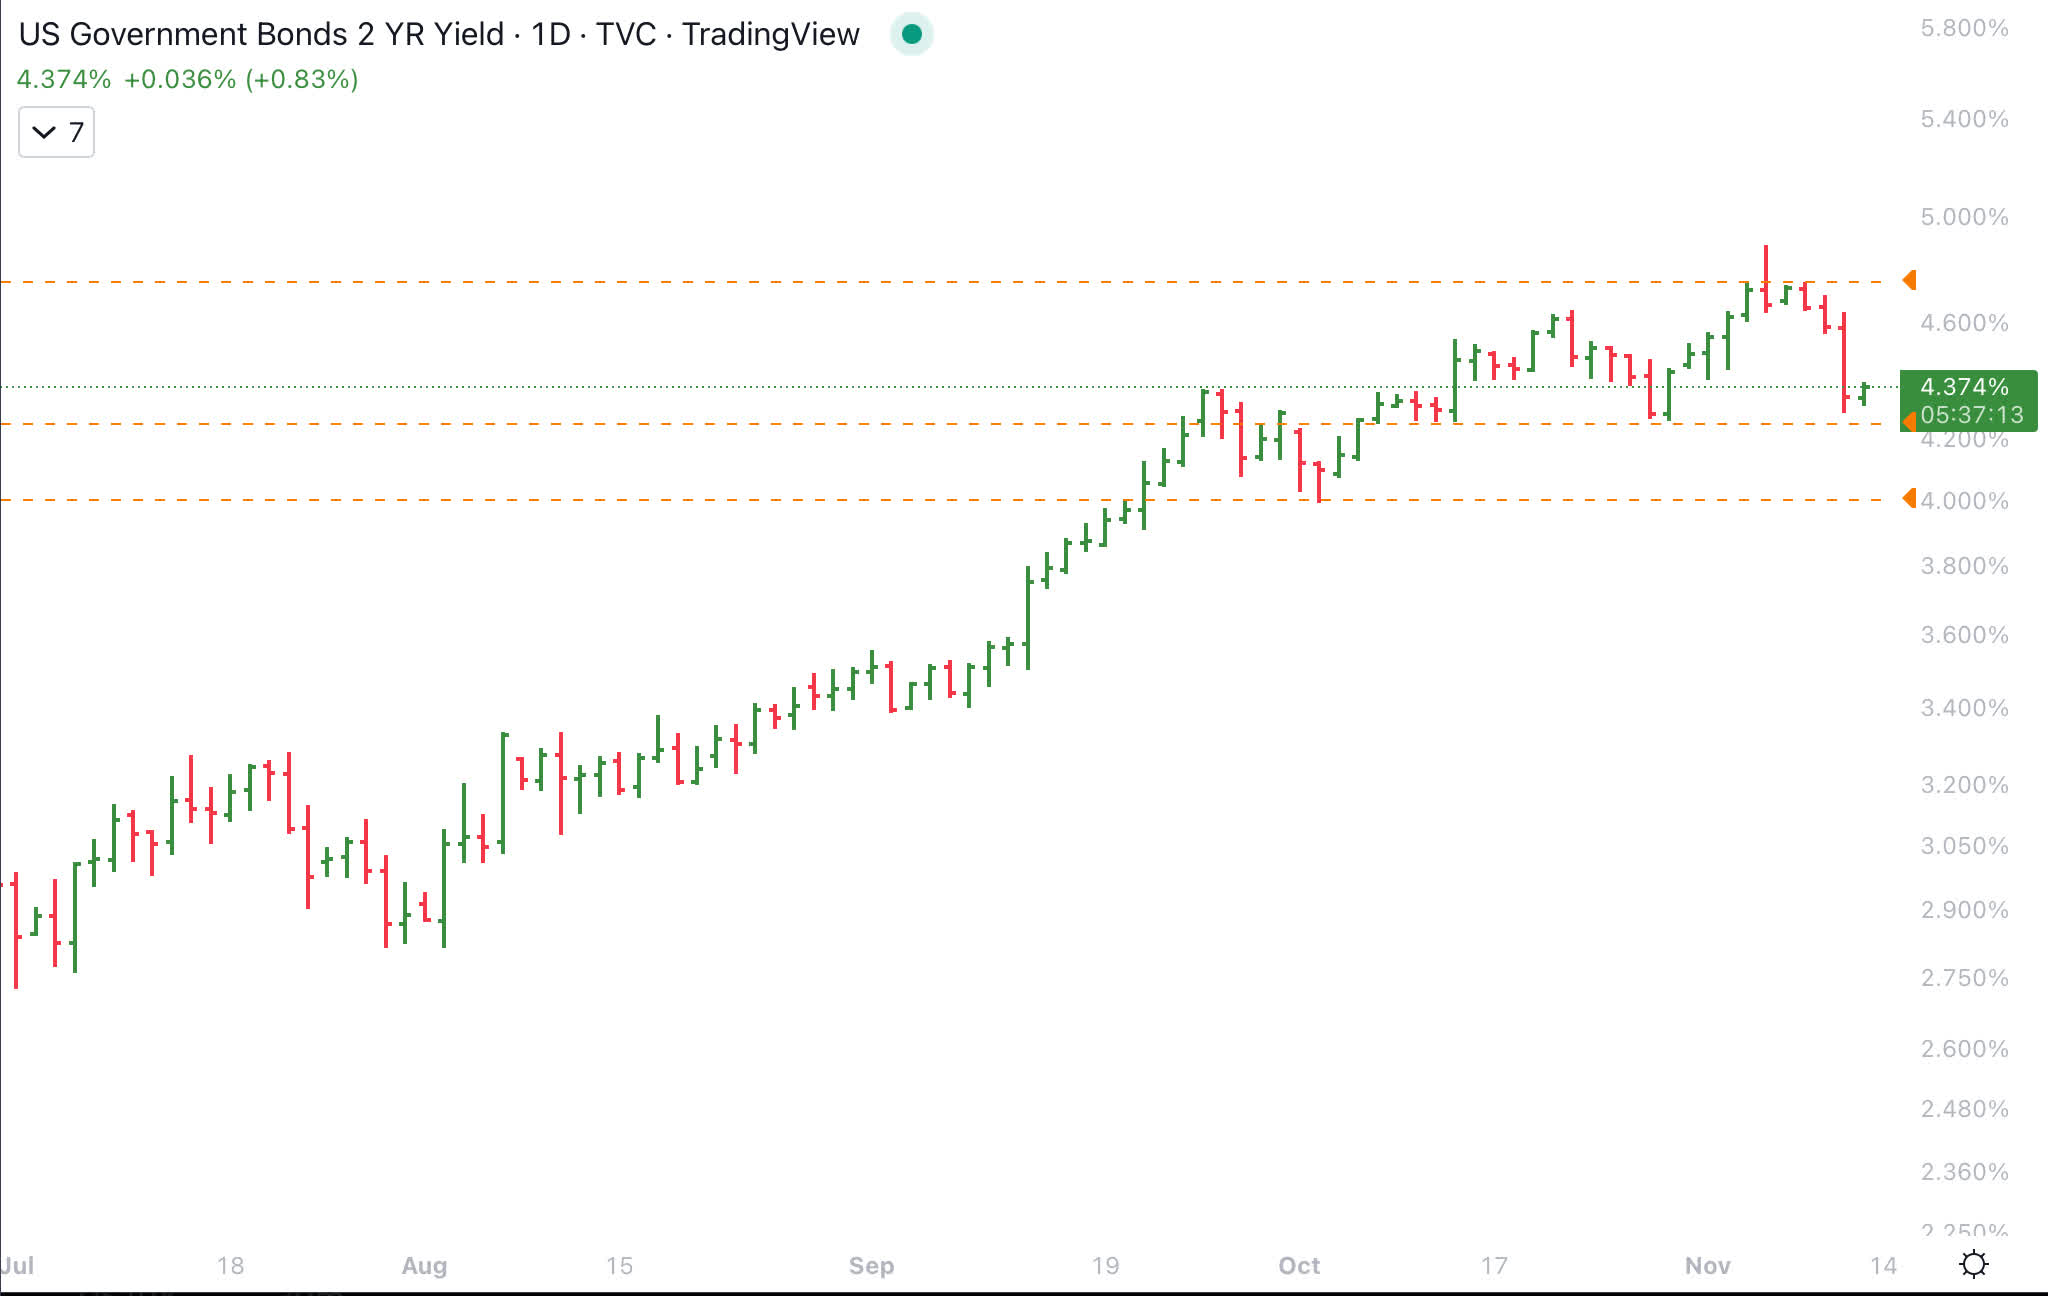
Liquidity
M2 money supply has been falling since March 2022, when the Federal Reserve started quantitative tightening, which has been and will remain a headwind for stock and bond prices.
M2 (St Louis Fed)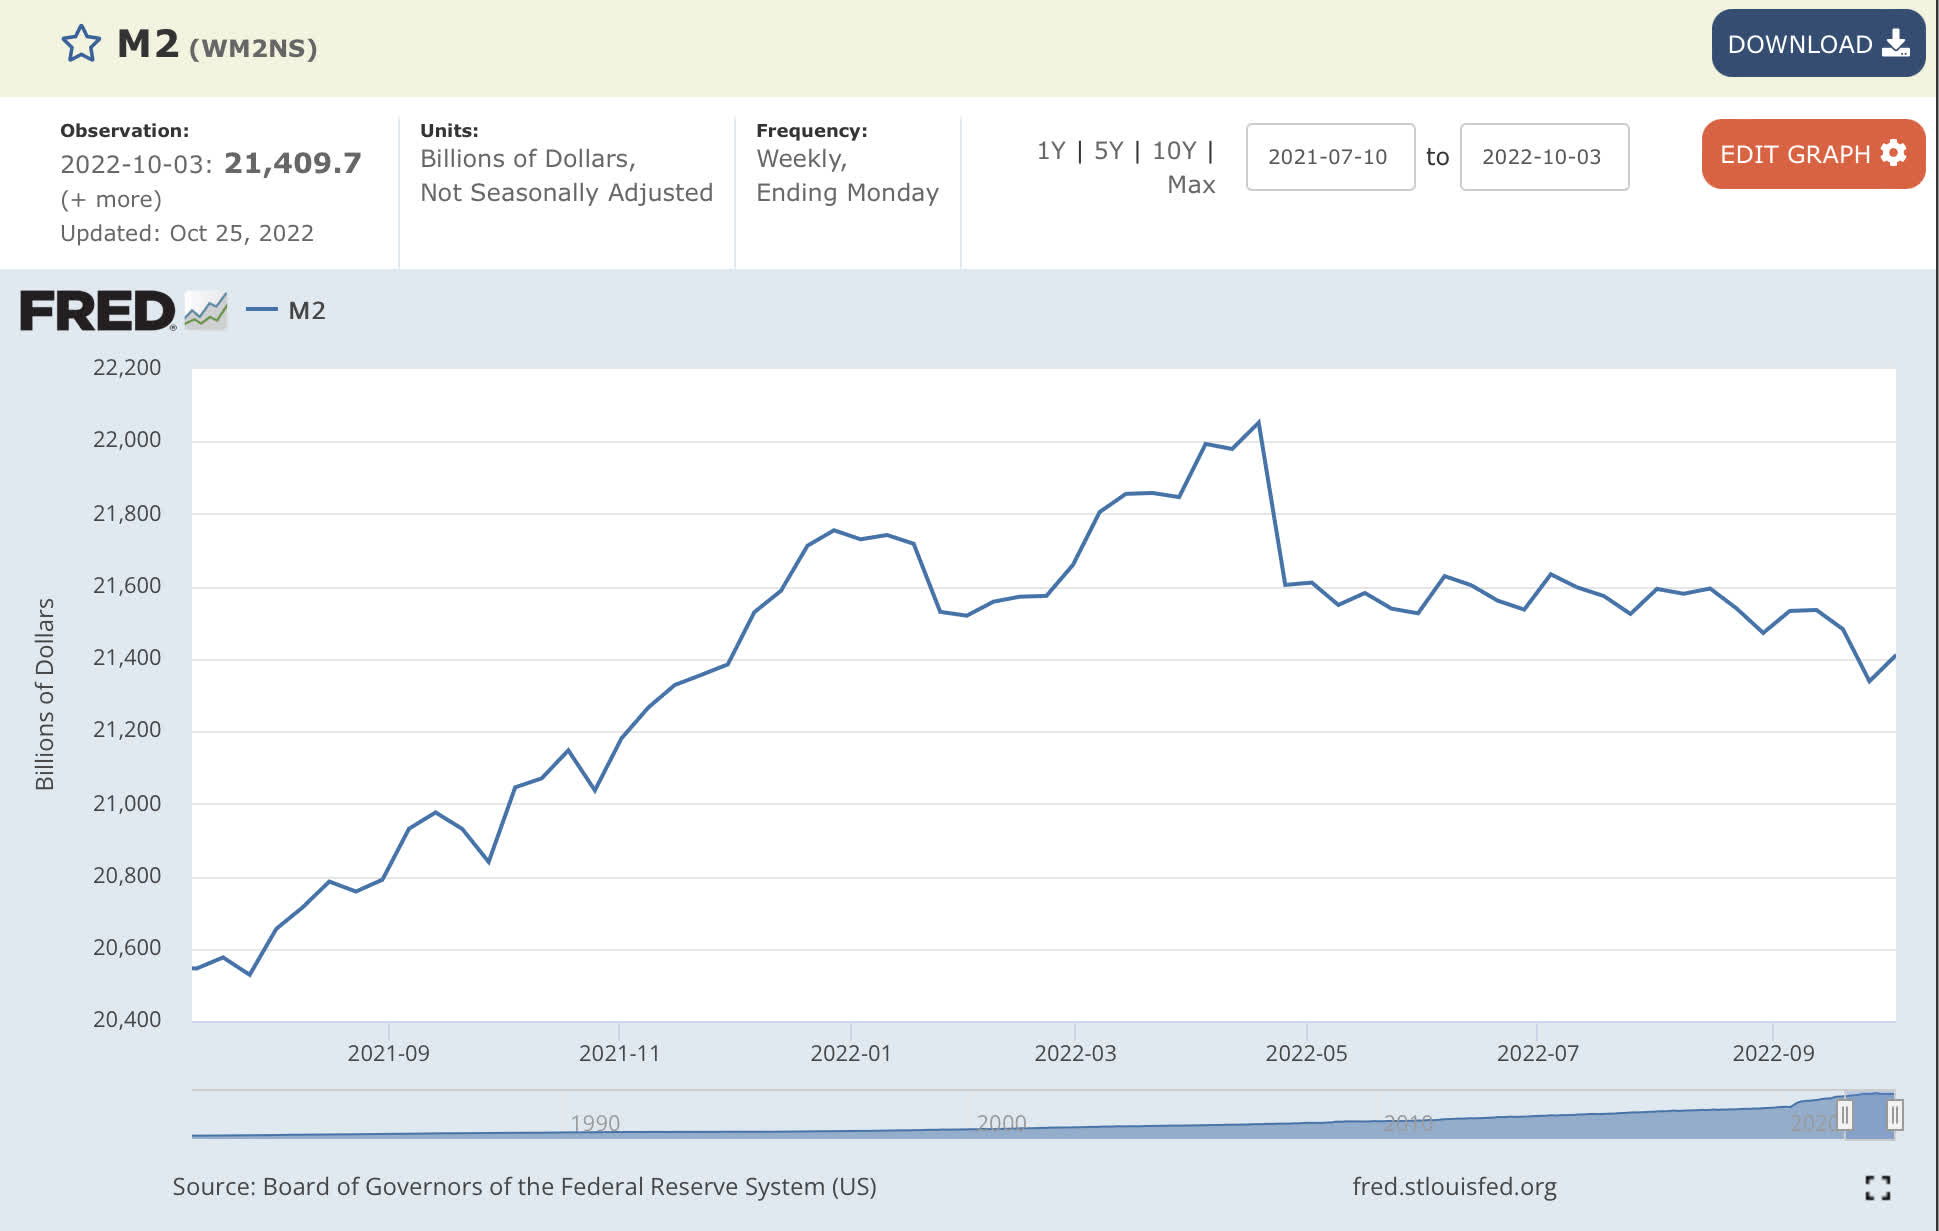
U.S. Dollar
The US Dollar Index (DXY) has pulled back from a high of 114.8 and closed last Friday just above 106. The dollar index broke a rising trend of higher lows and higher highs.
Dollar Index DXY (Author )
DXY could pull back to 100 to 103 zone based on past levels if inflation and interest rates trend lower in the coming months. For equities to form a base and go back into an uptrend, they will require support from a lower trend in inflation, interest rates, and the U.S. Dollar Index.
Longer term DXY Chart (Author )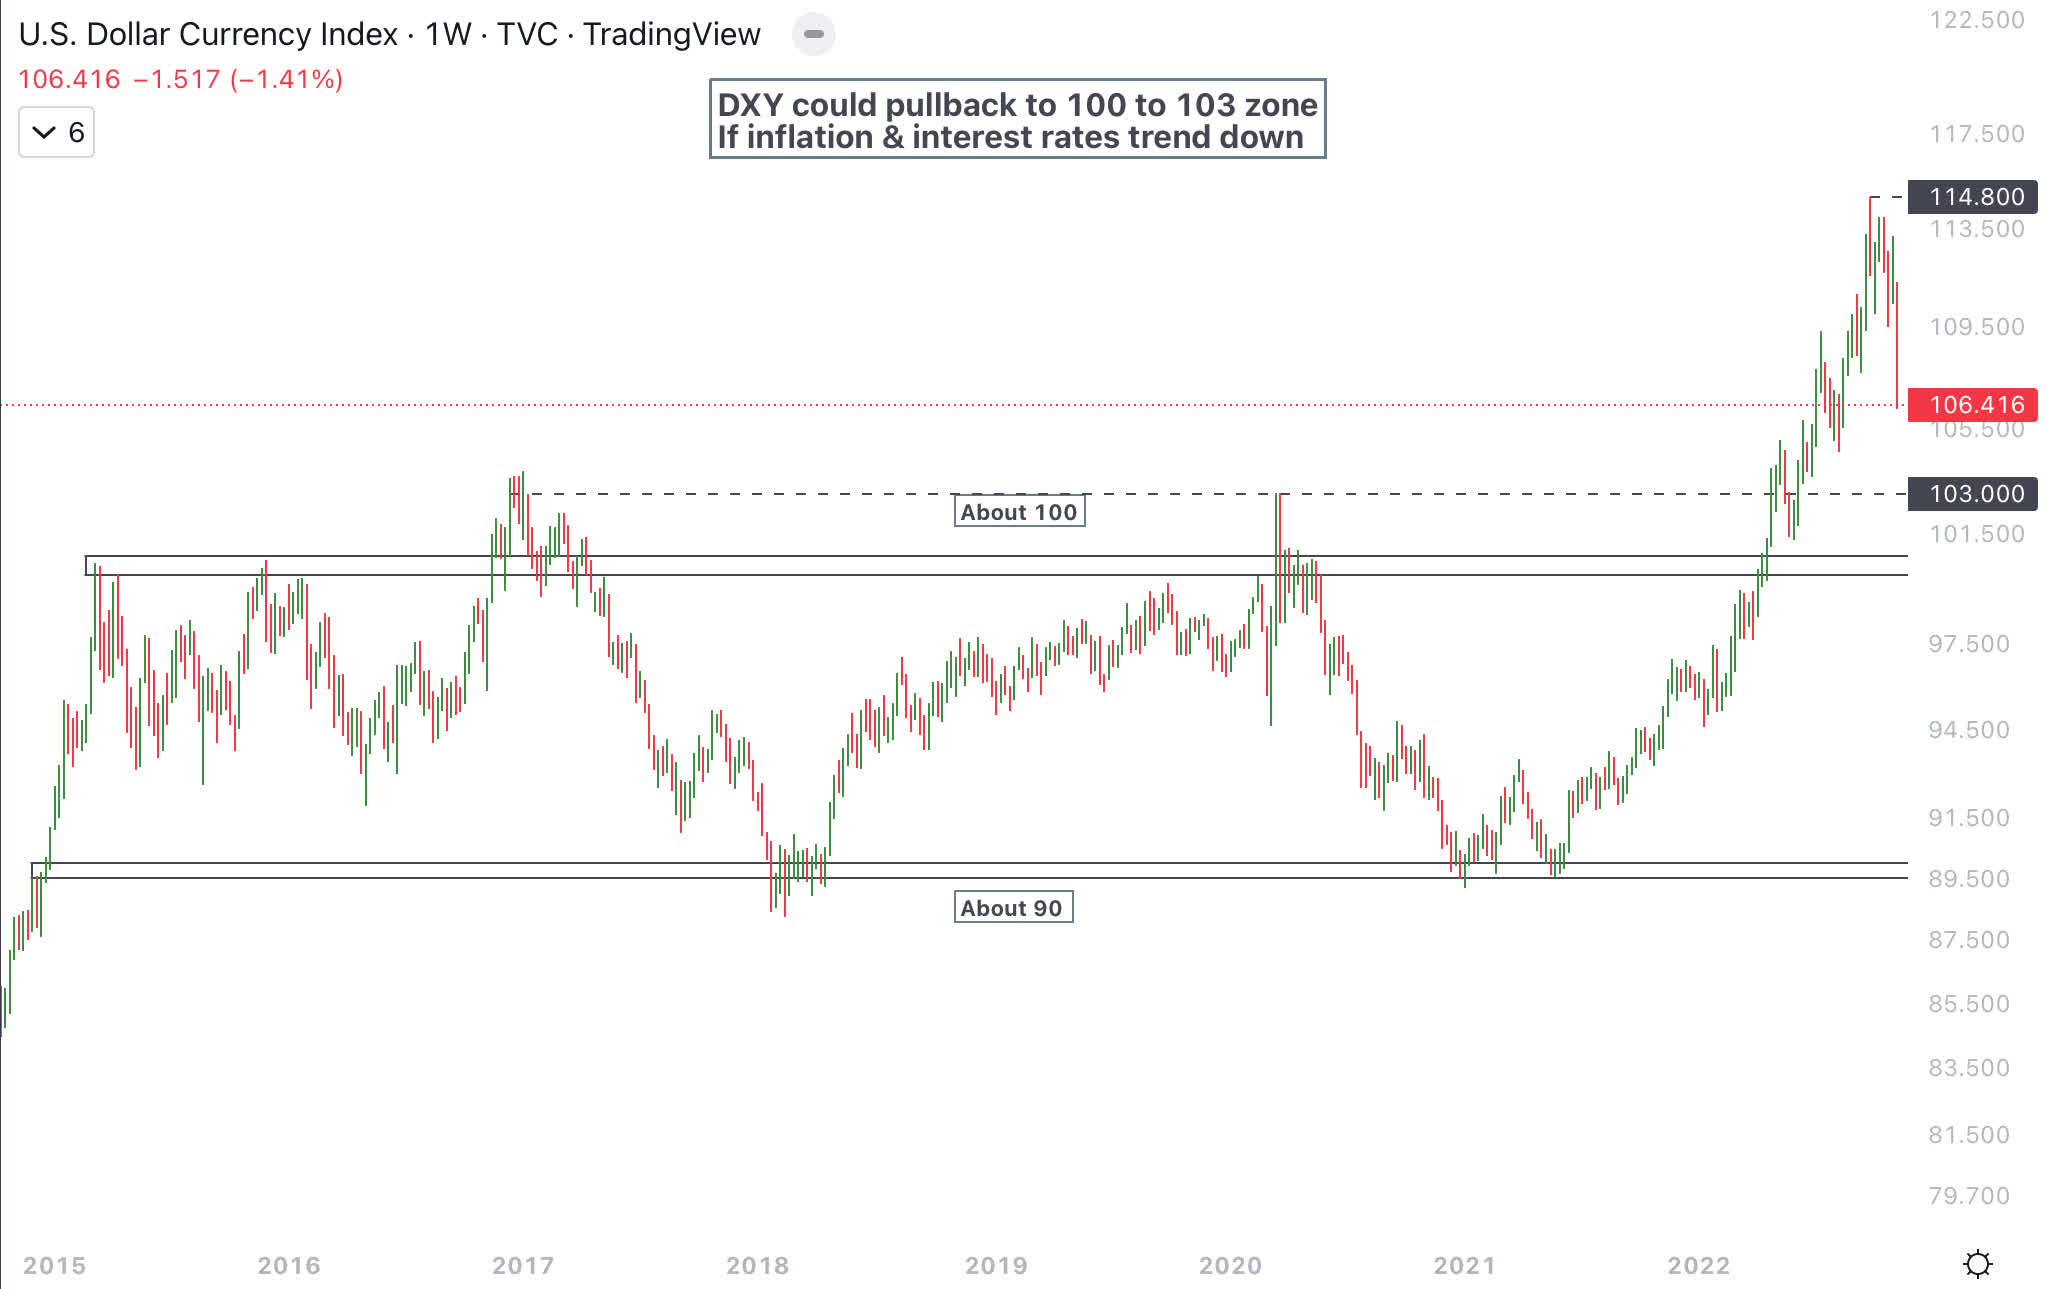
Technical Analysis
The S&P 500 broke below the June 2022 closing low of 3666 and also below intra-day low of 3636 and went down to 3492 intra week before closing the week at 3583 on October 14th. S&P 500 bounced off the 200-week moving average but is below the down-trending 50-week moving average.
S&P 500 Weekly Chart (Author )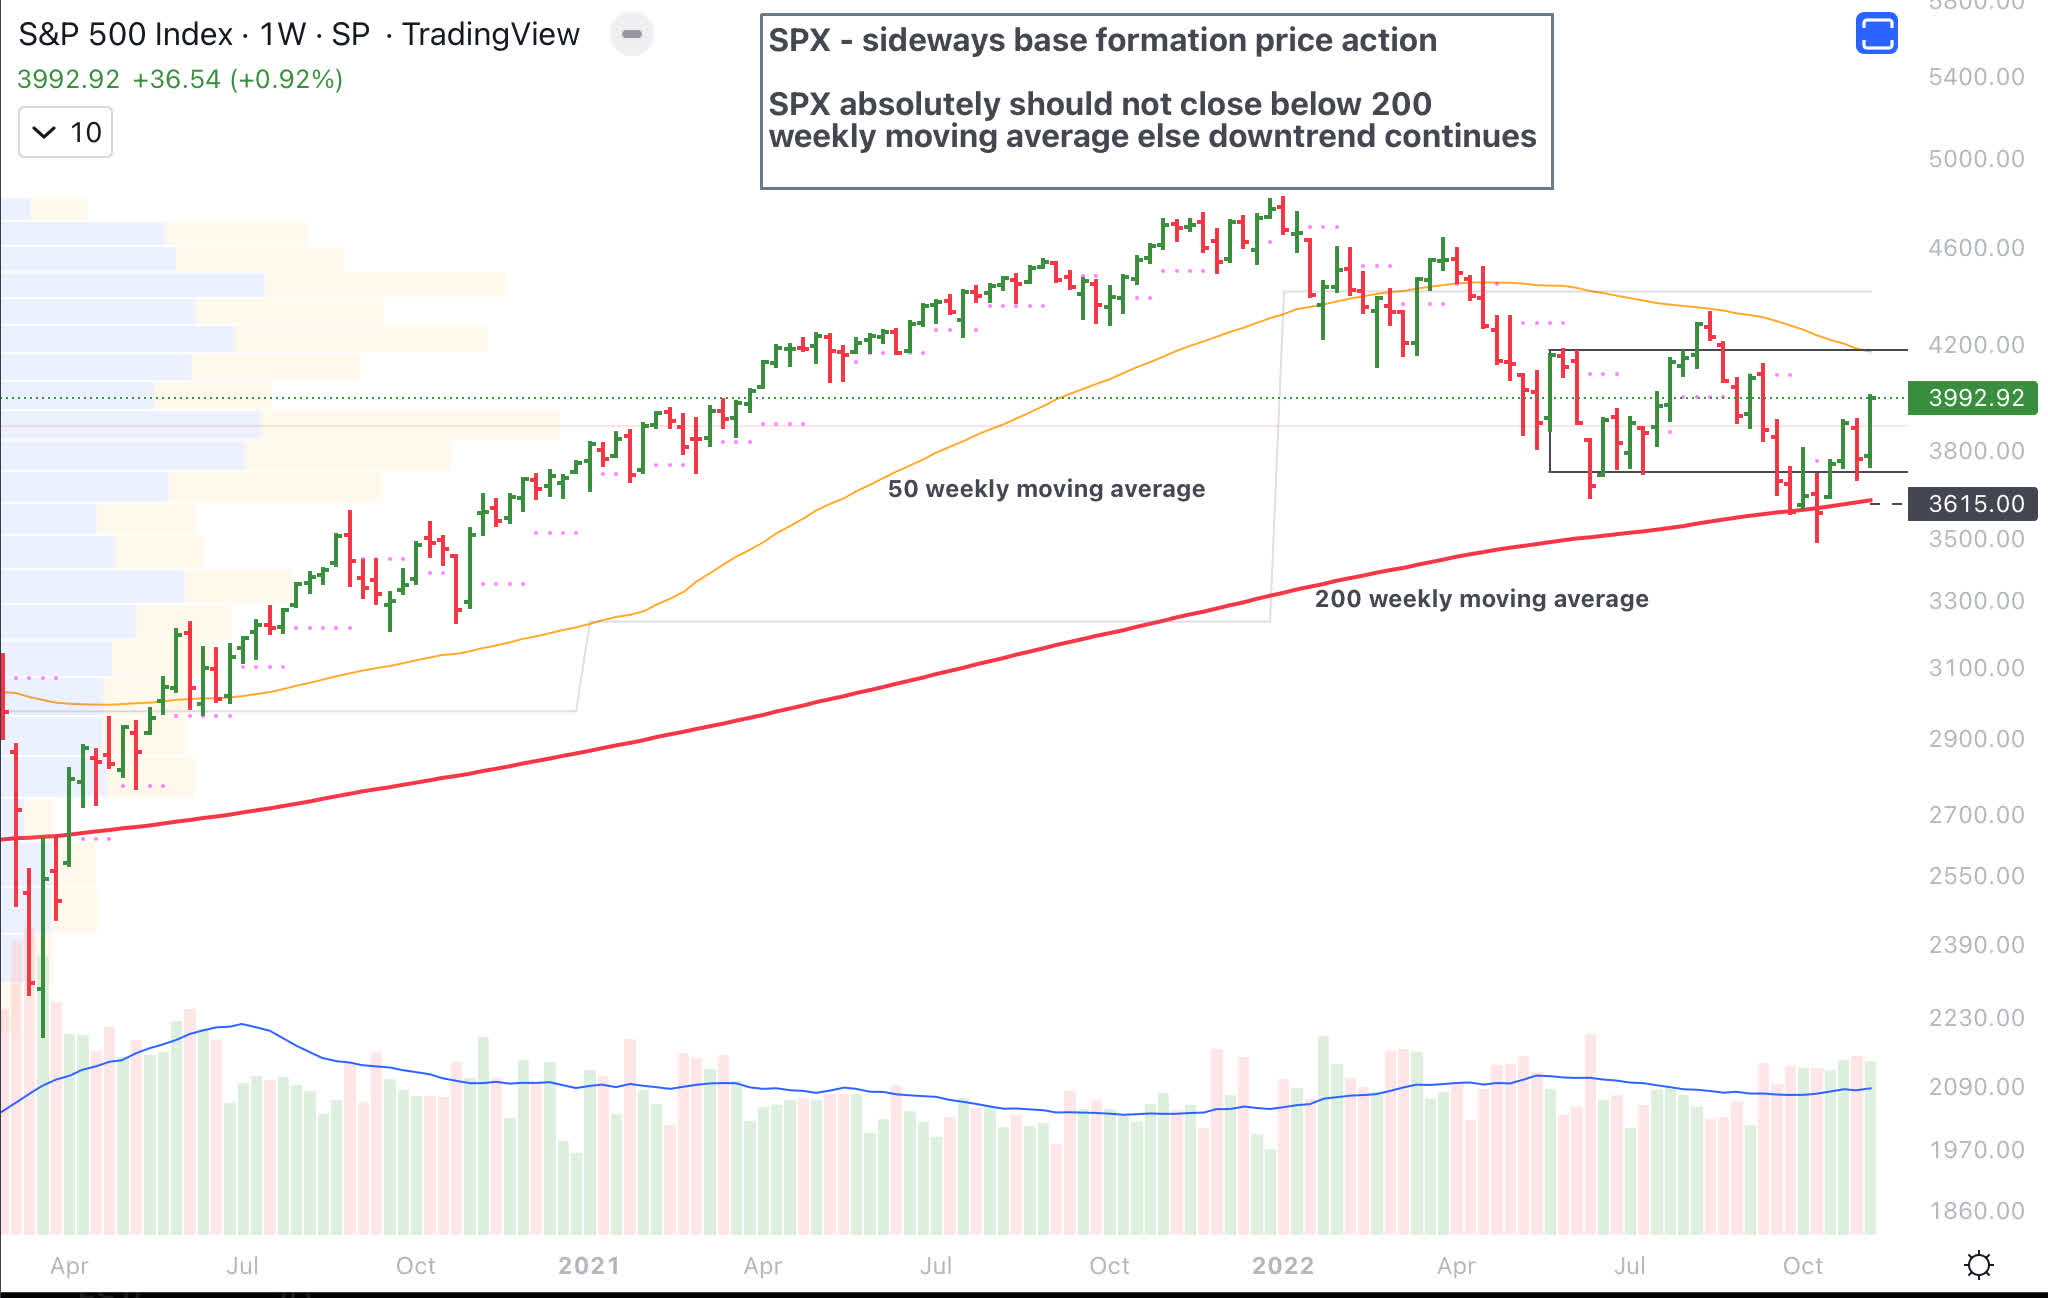
The daily chart of the S&P 500 clearly shows sideways consolidation since June 2022, with spikes above and below the range which is from 3750 to 4150. If the S&P 500 closes and stays above 4150 on a weekly basis, it could be starting a new uptrend, while a breakdown and close below 3750 on a weekly basis would mean the downtrend is likely to continue.
S&P 500 Daily Chart (Author )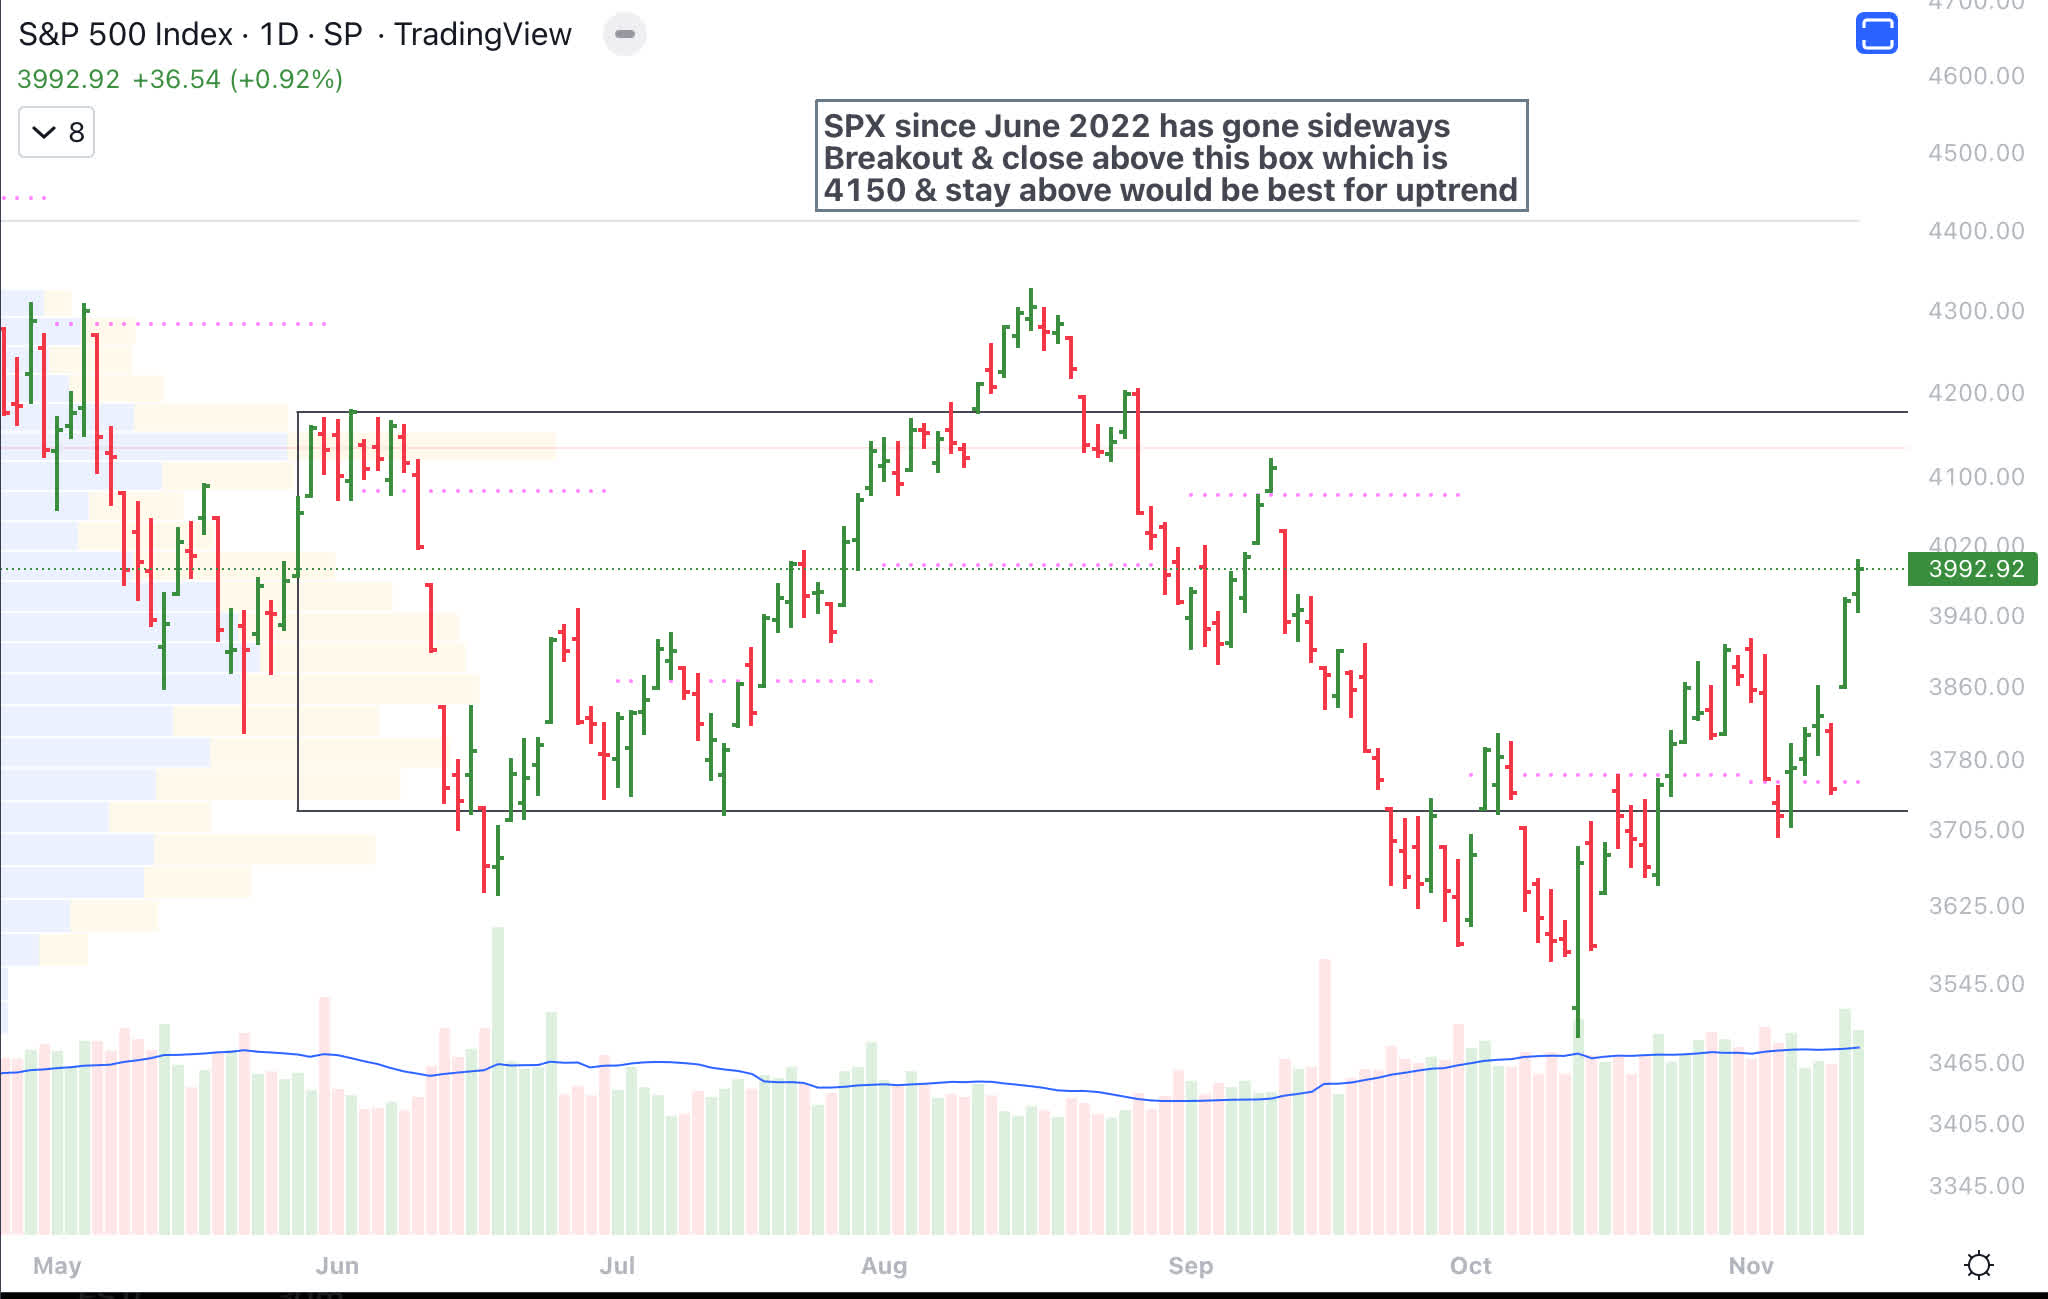
Another way to look at the chart is using AVWAP (anchored volume weighted average price). I expect the price action to form a base as long as the S&P 500 closes the week above 3750 supported by AVWAP from October lows. Resistance is around 4120 (AVWAP from all time high). For an uptrend, S&P 500 will have to stay above 4120 even during pullbacks.
S&P 500 AVWAP (Author )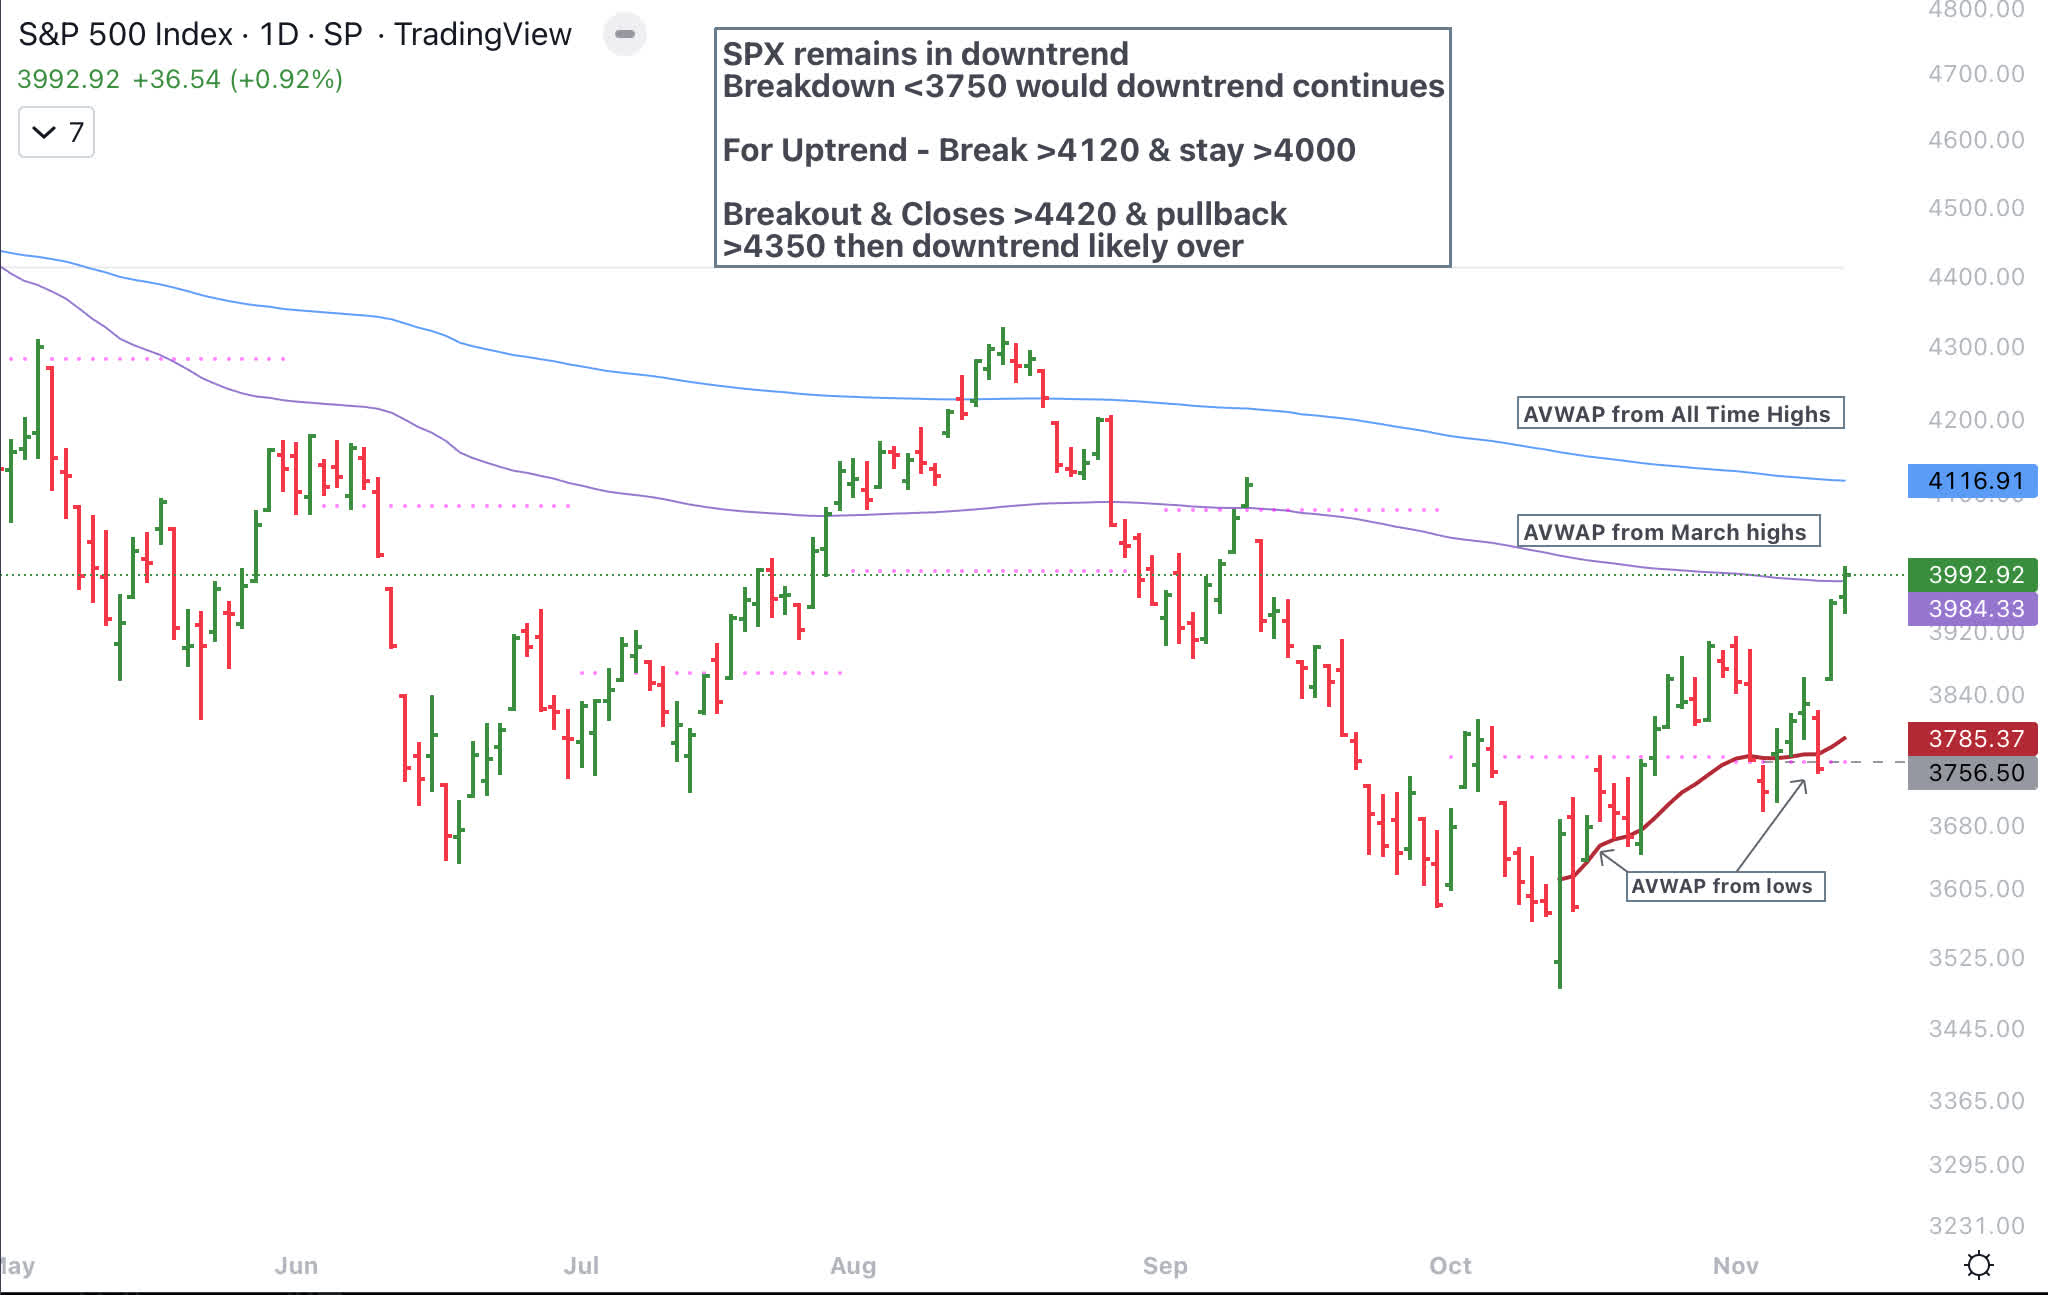
The Ichimoku chart is another way to show price action. It is safer to buy when the S&P 500 closes above the cloud. For the S&P 500 to close above the cloud, it’ll have to close and stay above 4250.
S&P 500 Ichimoku Chart (Author )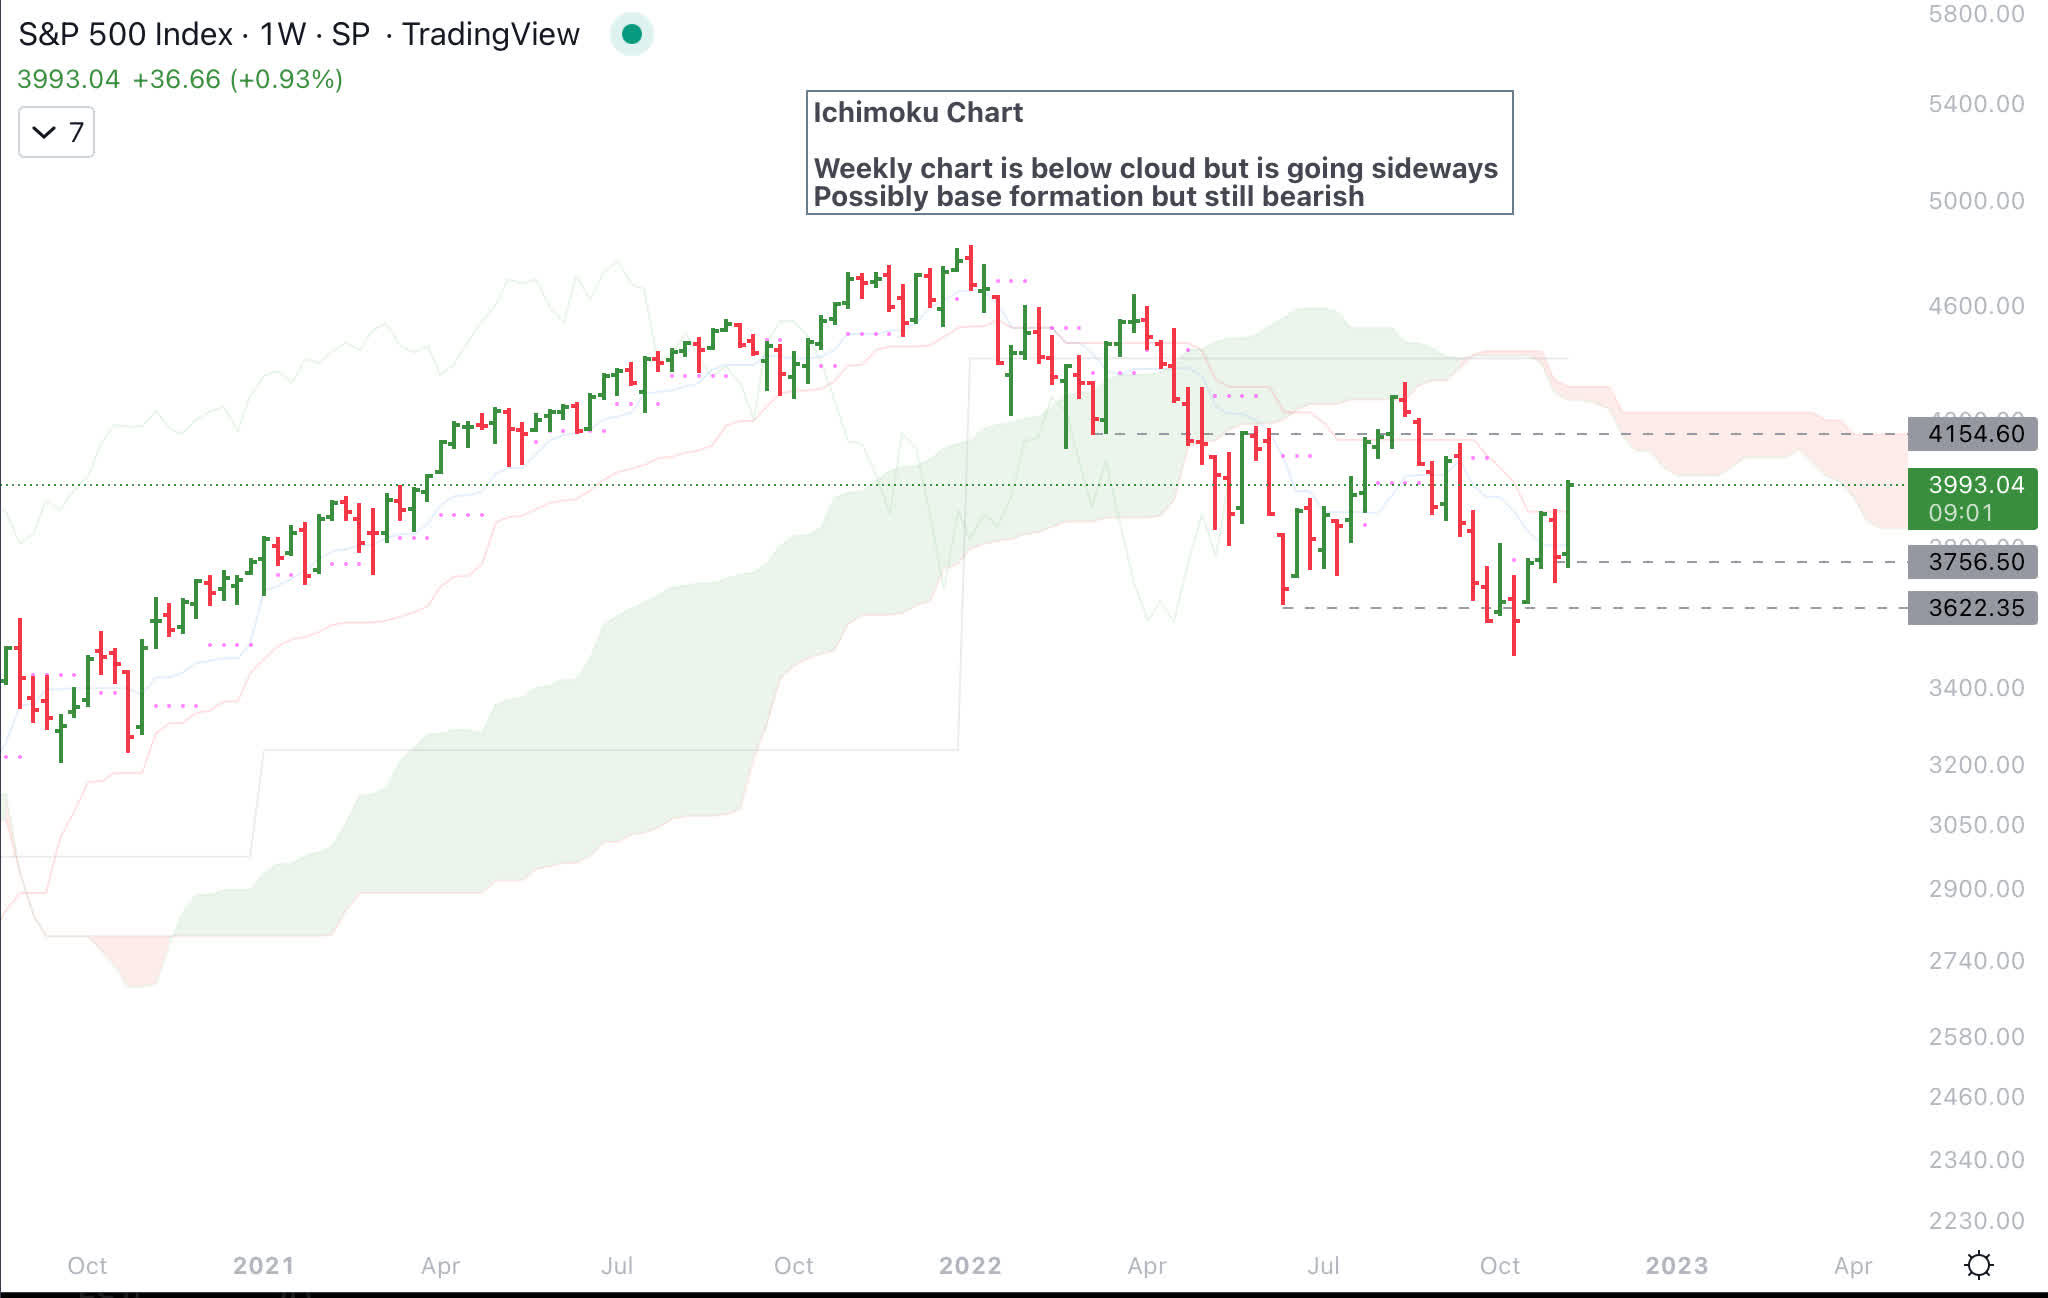
In the series of charts below, I’ll illustrate the evidence for sideways consolidation before a new uptrend. The first chart below is a comparison of the S&P 500 to the Dow Jones Transportation Average (DJT). As is clearly visible in the chart, DJT is breaking out above the September 2022 bounce. It is critical at this stage for DJT to make higher lows. If DJT breaks out and closes above 15280, then that would be fairly bullish for the S&P 500.
S&P 500 Dow Transport Charts (Author )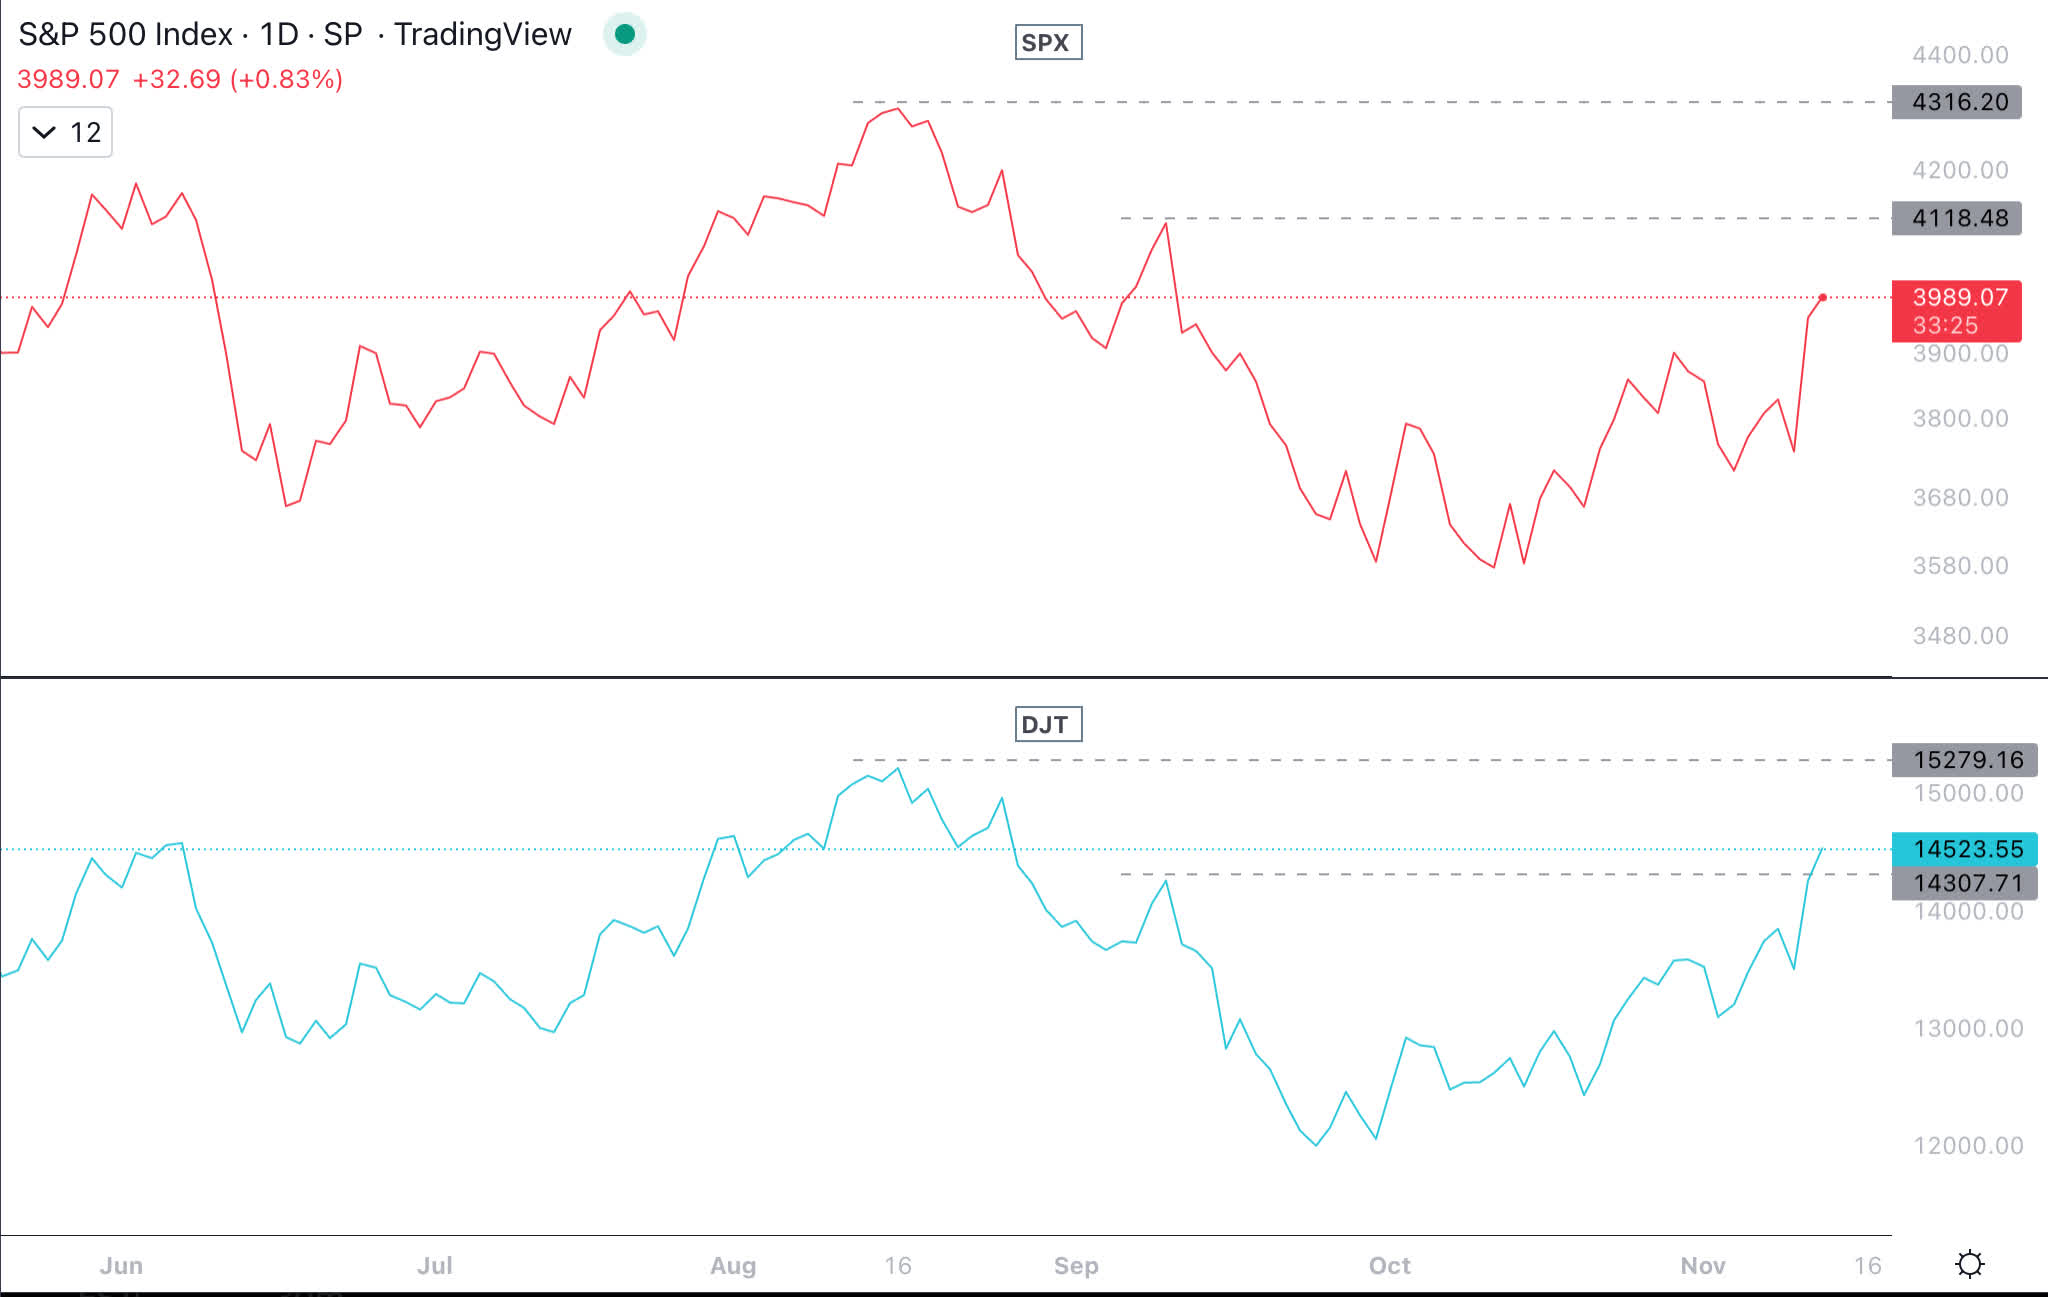
The small-cap index (IWM) did not make a lower low in October which is a positive divergence to S&P 500. If IWM closes and stays above 201, then that would be positive for equities as small caps lead markets in a new uptrend.
S&P 500 IWM Charts (Author )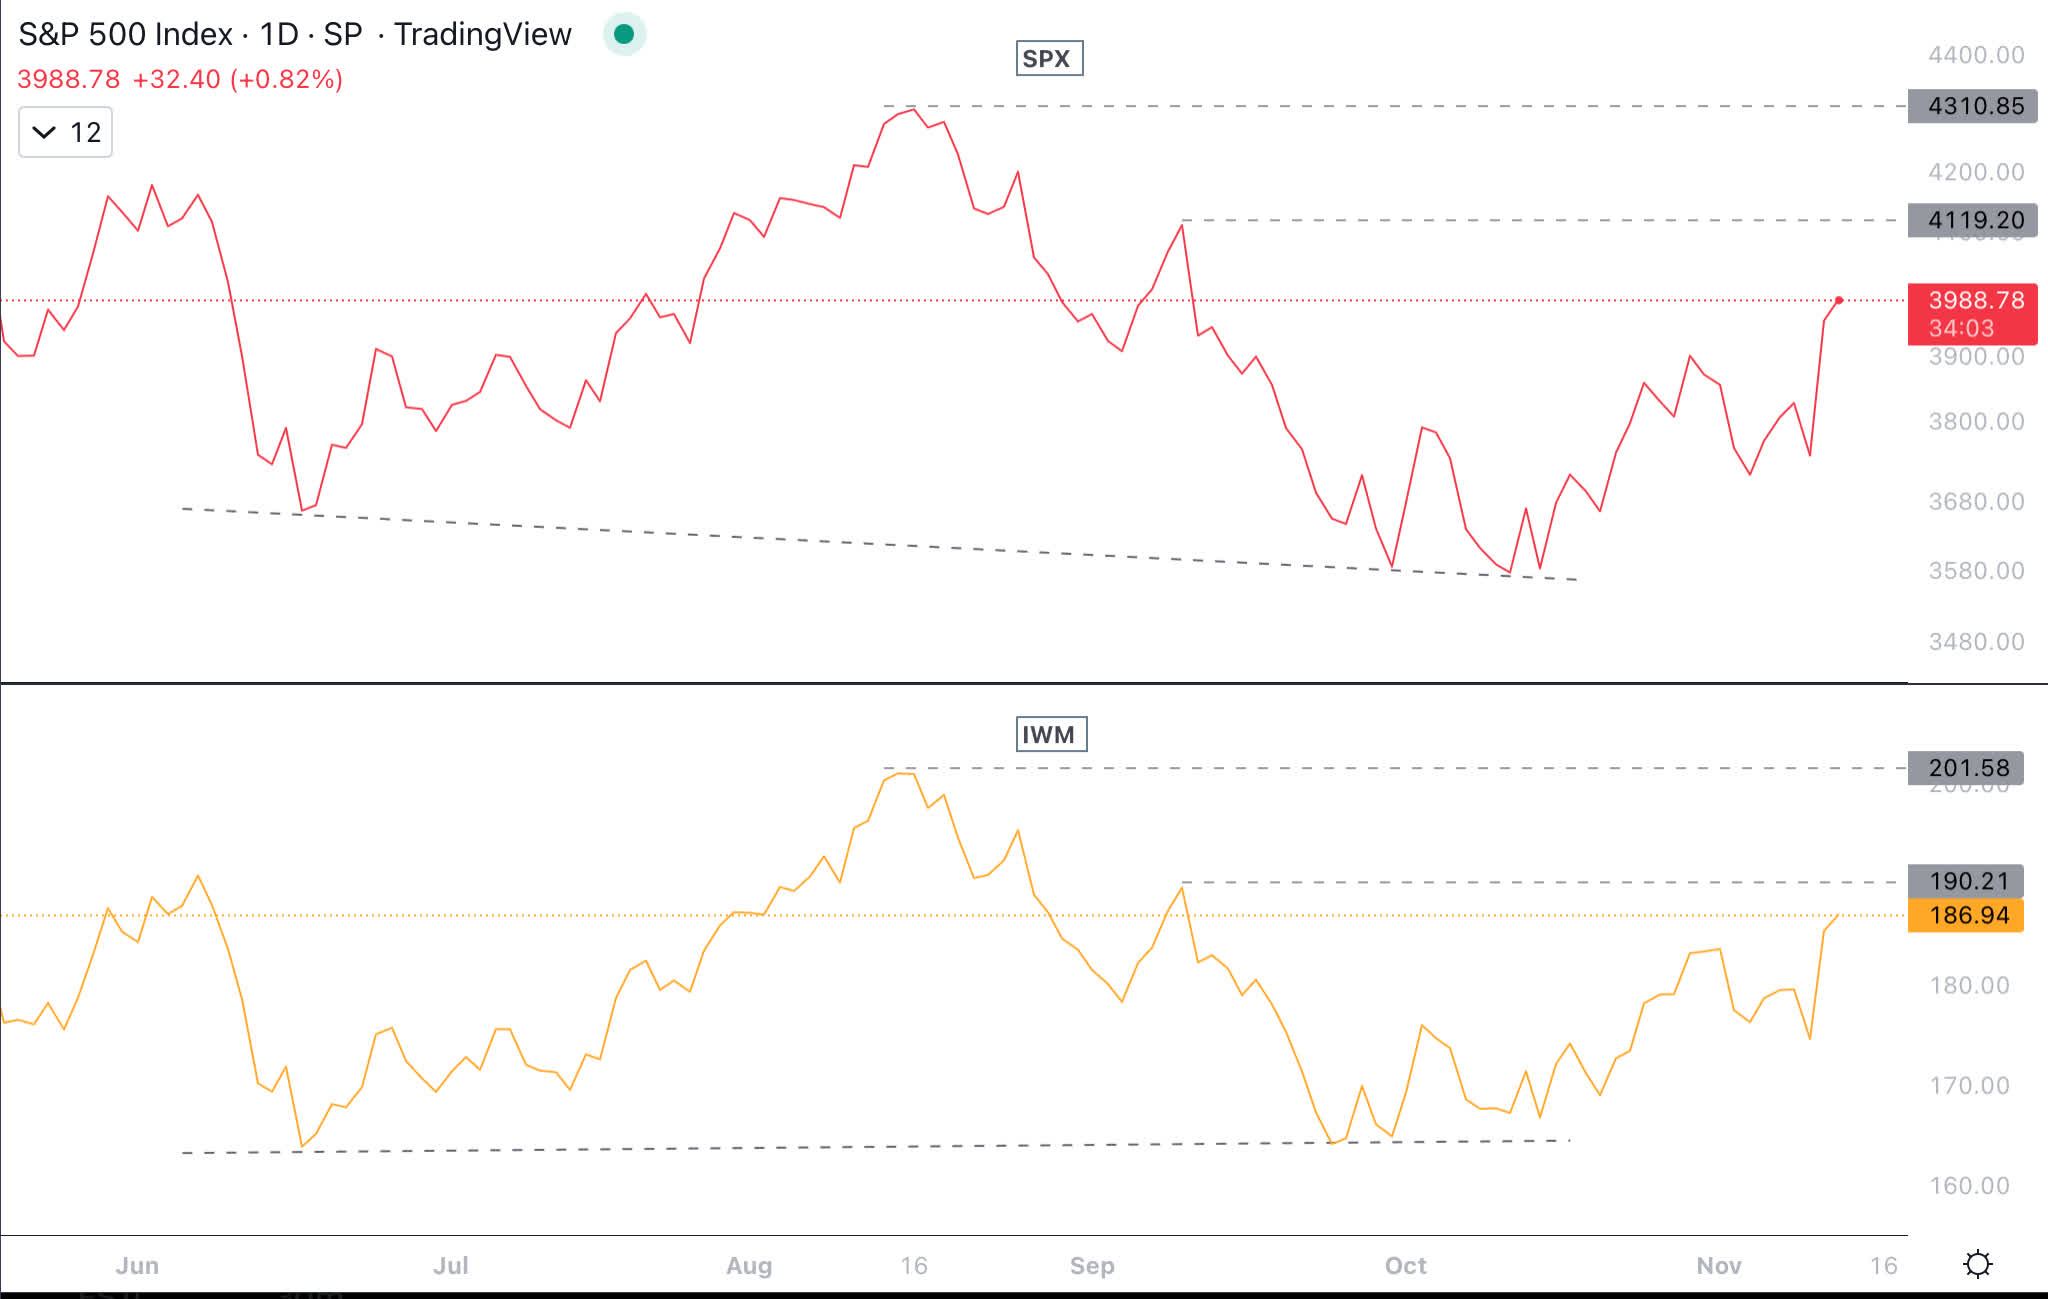
The percentage of stocks above their 50-day moving average and 200-day moving average has been leading the price component of the S&P 500. This is a positive development.
S&P 500 Pct > 200 & 50 day moving average (Author )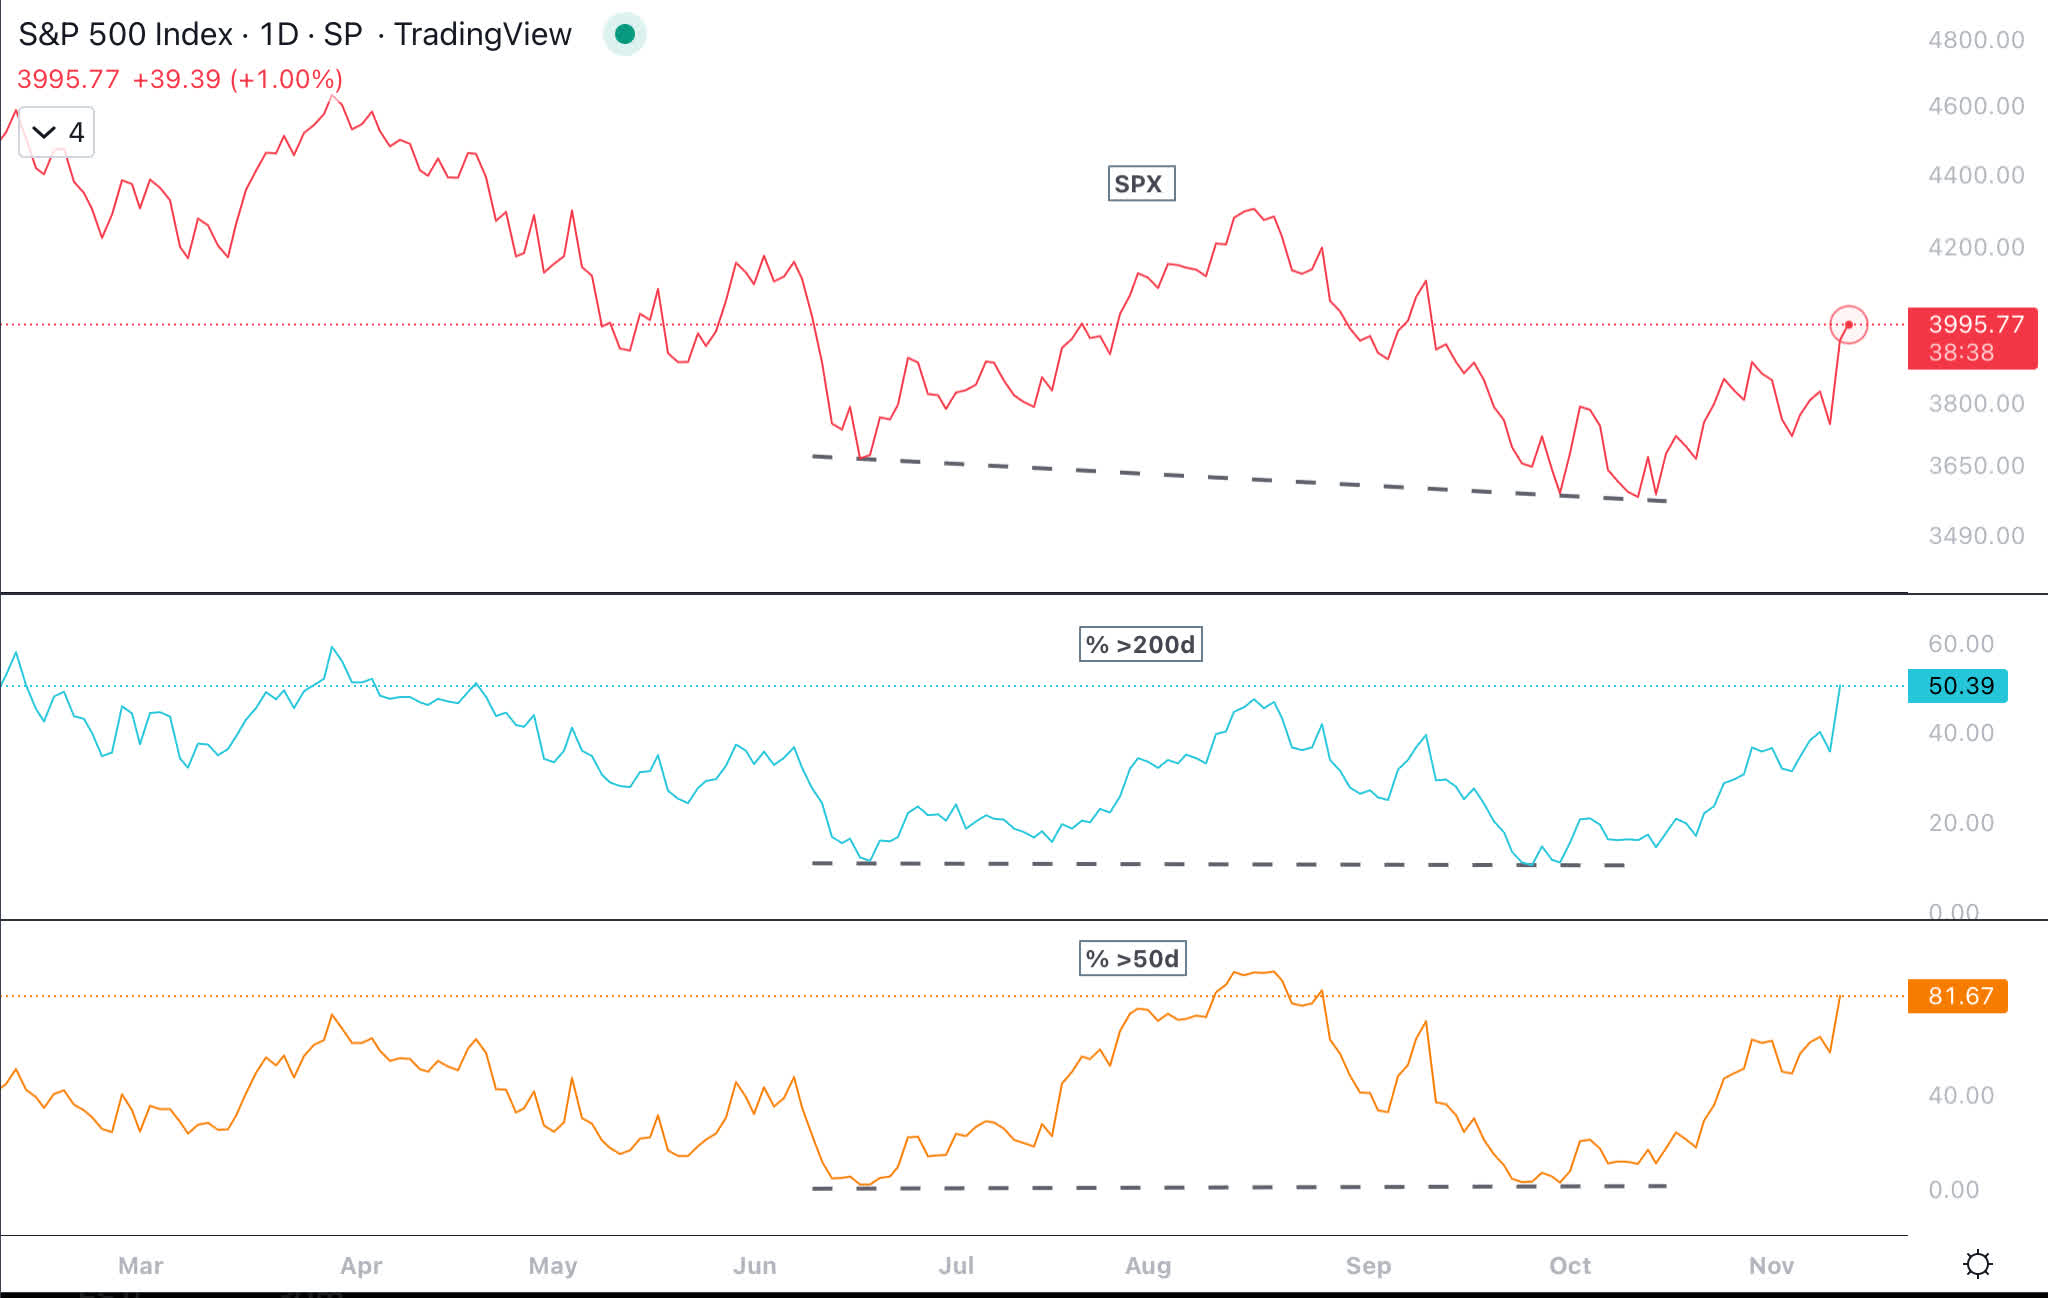
So far in 2022, large cap value has outperformed large cap growth. While large-cap growth is down 22%, large-cap value is basically flat. This could continue, as interest rates are likely to remain higher than in past years.
Large Cap Growth vs Value (Author )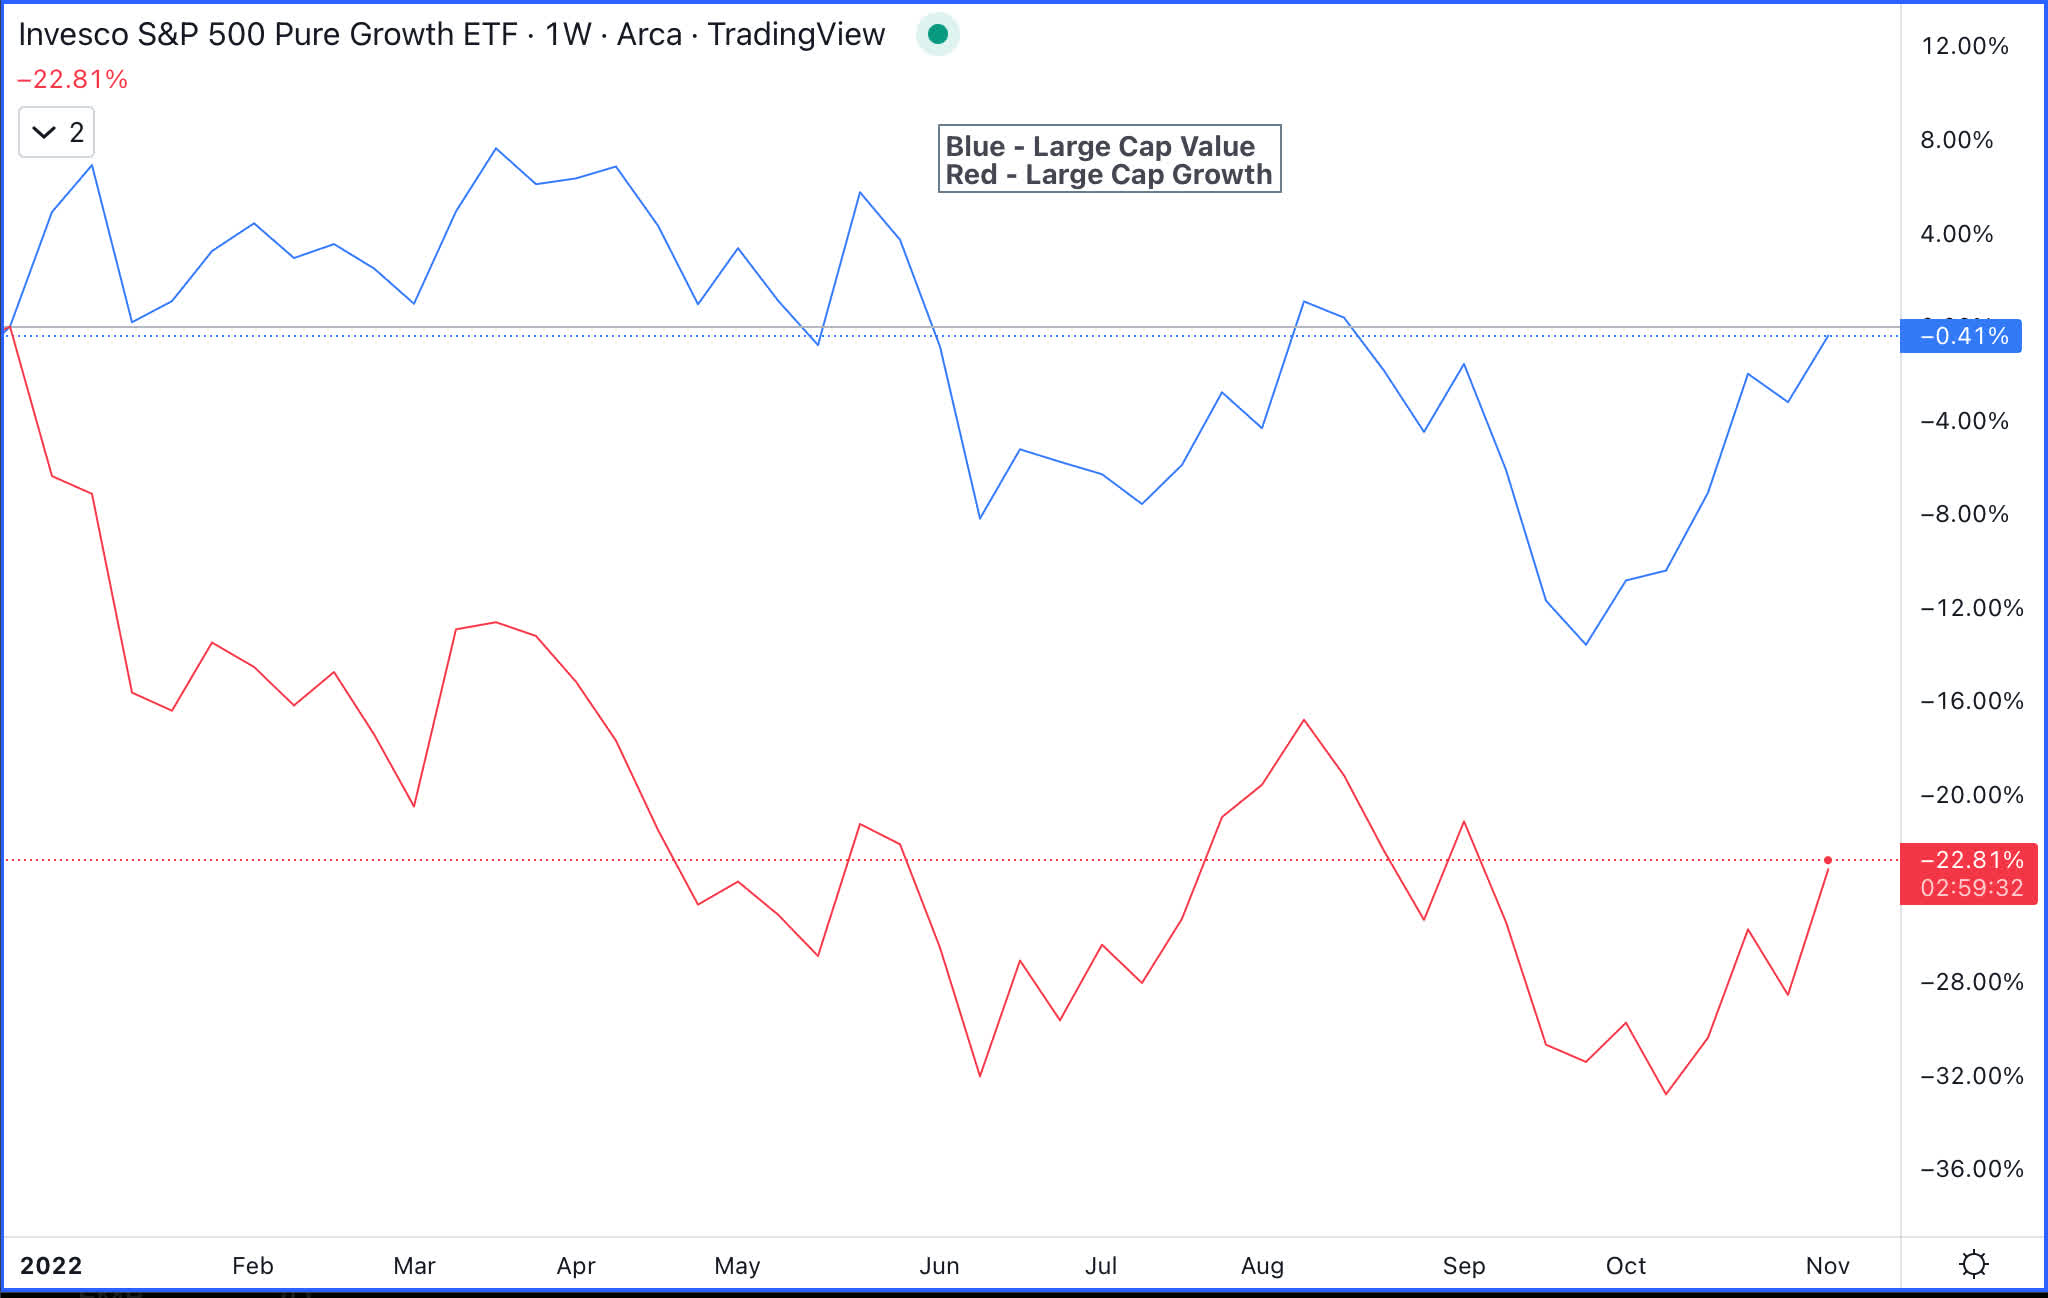
While the S&P 500 is below its 50-week moving average, the Mid Cap Index (MDY) closed last week above the 50-week moving average. If MDY can continue to trend higher, then it will be positive for equities.
Mid Cap Chart (MDY) (Author )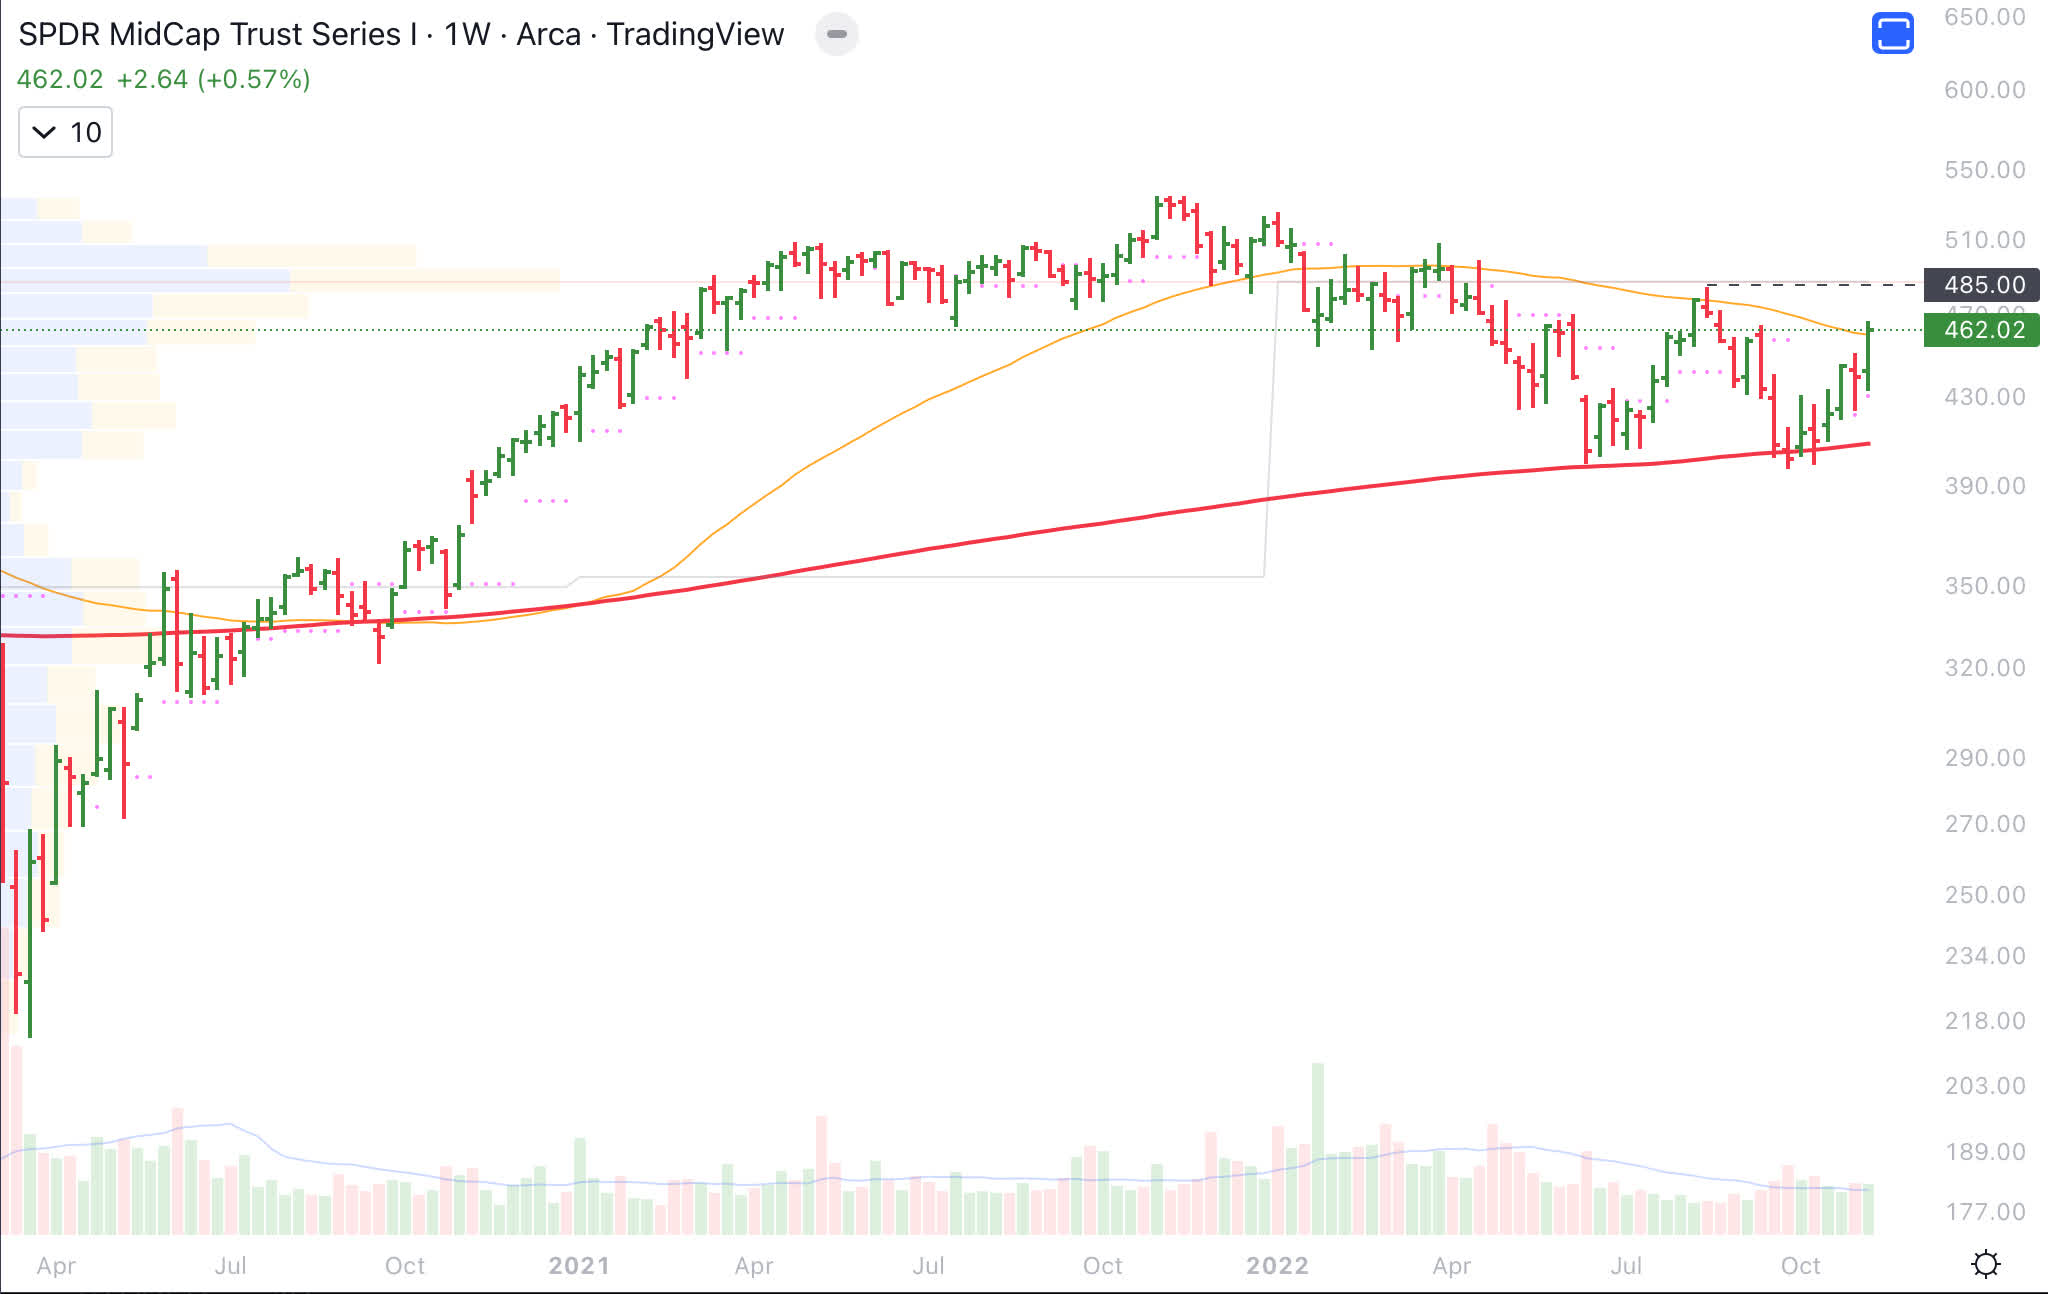
Dow Jones Industrial Average (DJI) also closed above the 50-week moving average and a breakout and close above 34,400 would be very positive. In fact, DJI is just about 7% below its all-time high.
Dow Jones Industrial Average Chart (DJI) (Author )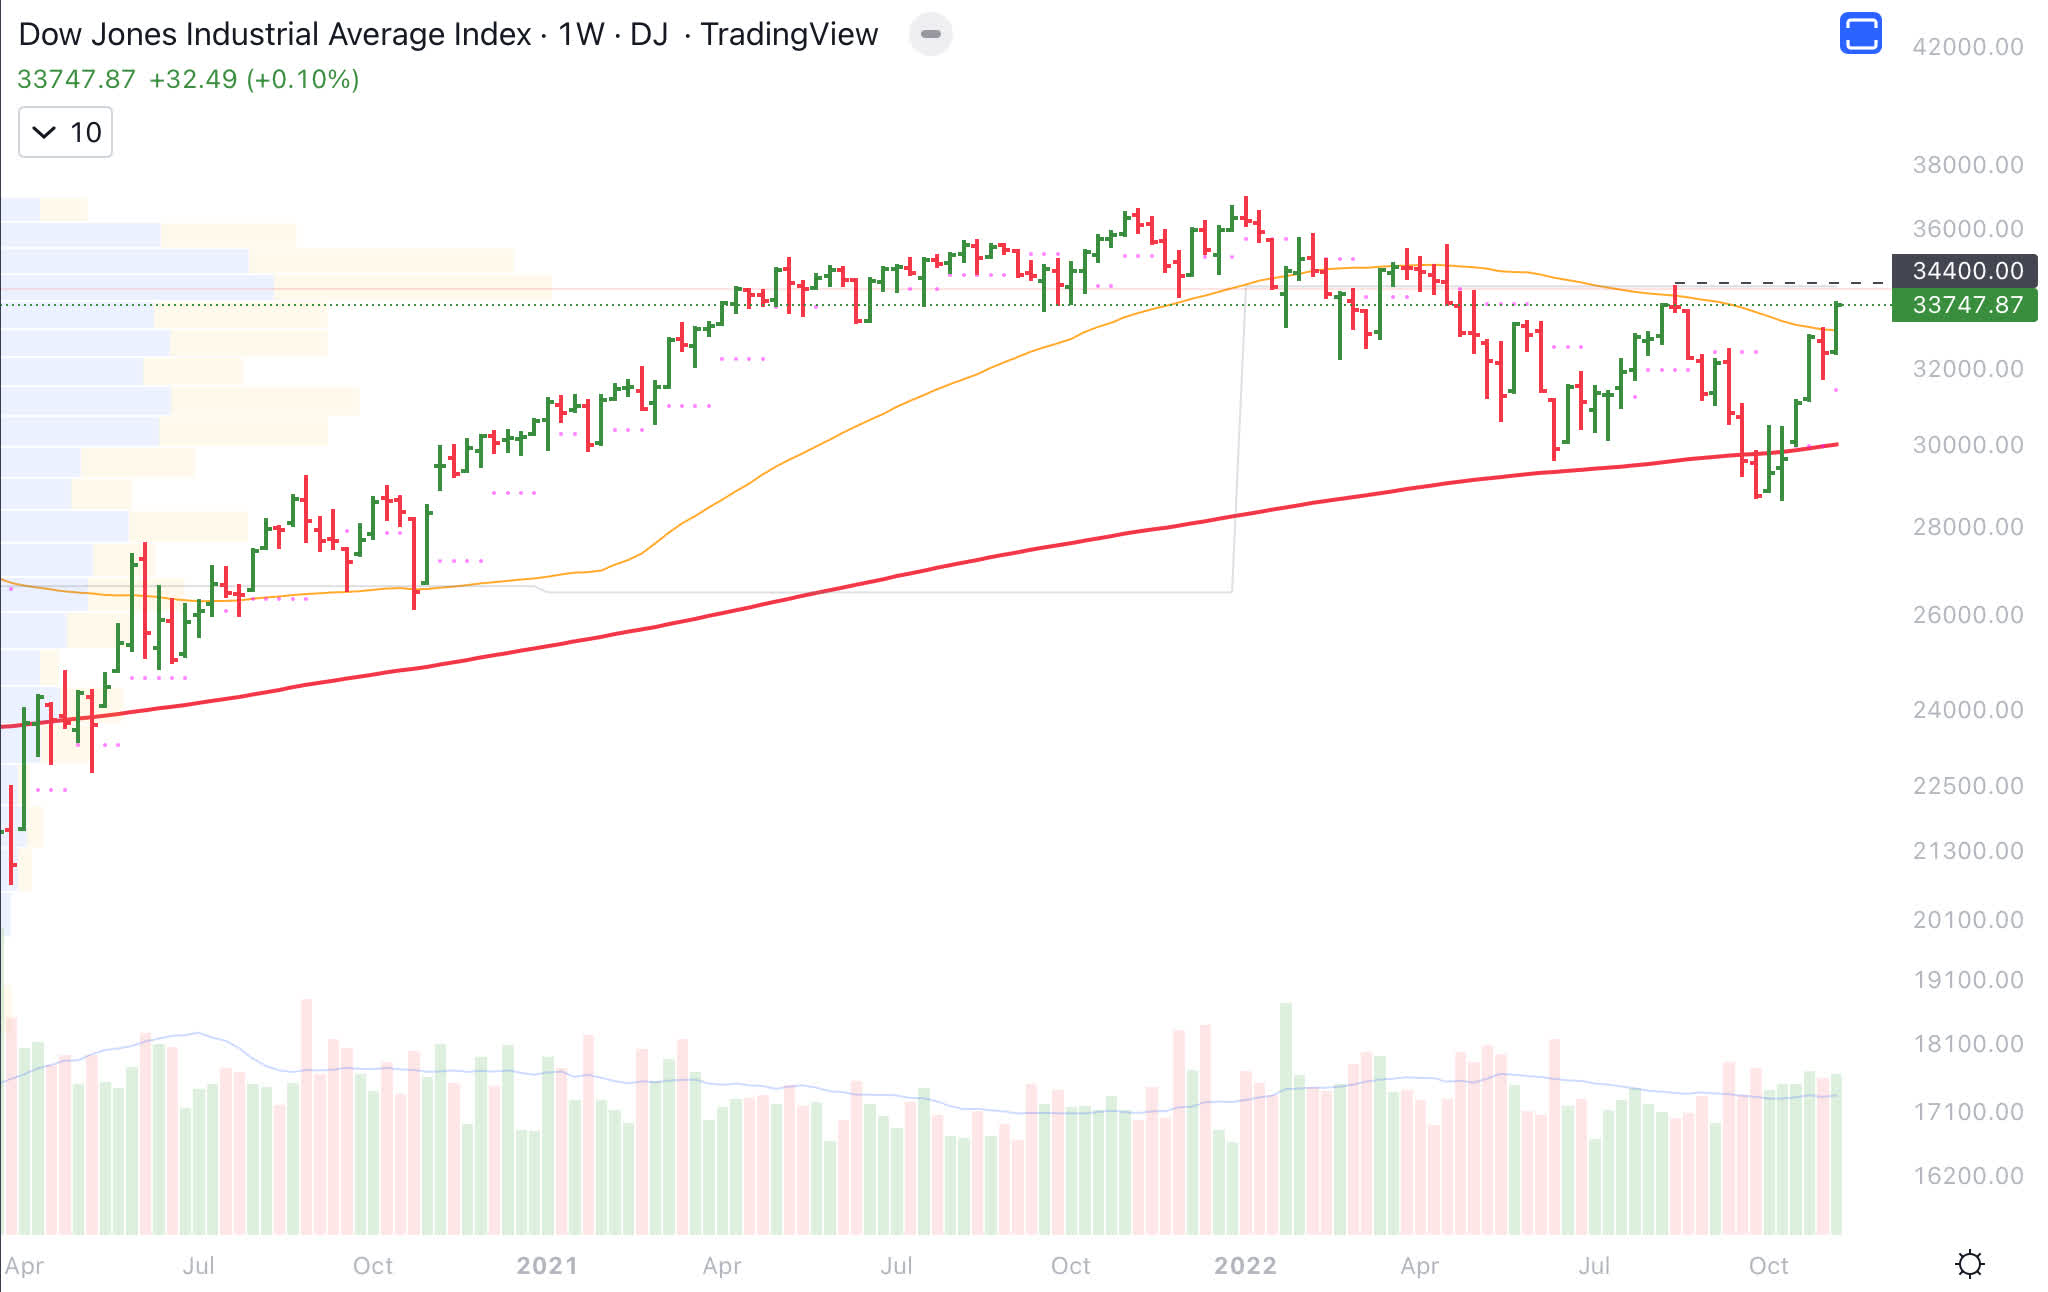
Risks
In the United States, yield curve inversion has always preceded recession. The yield curve inversions that are closely watched are the 10-year minus 2-year and the 10-year minus 3-month. Below is the 10-year minus the 2-year chart.
10-year 2-year yield curve chart (St Louis Federal Reserve )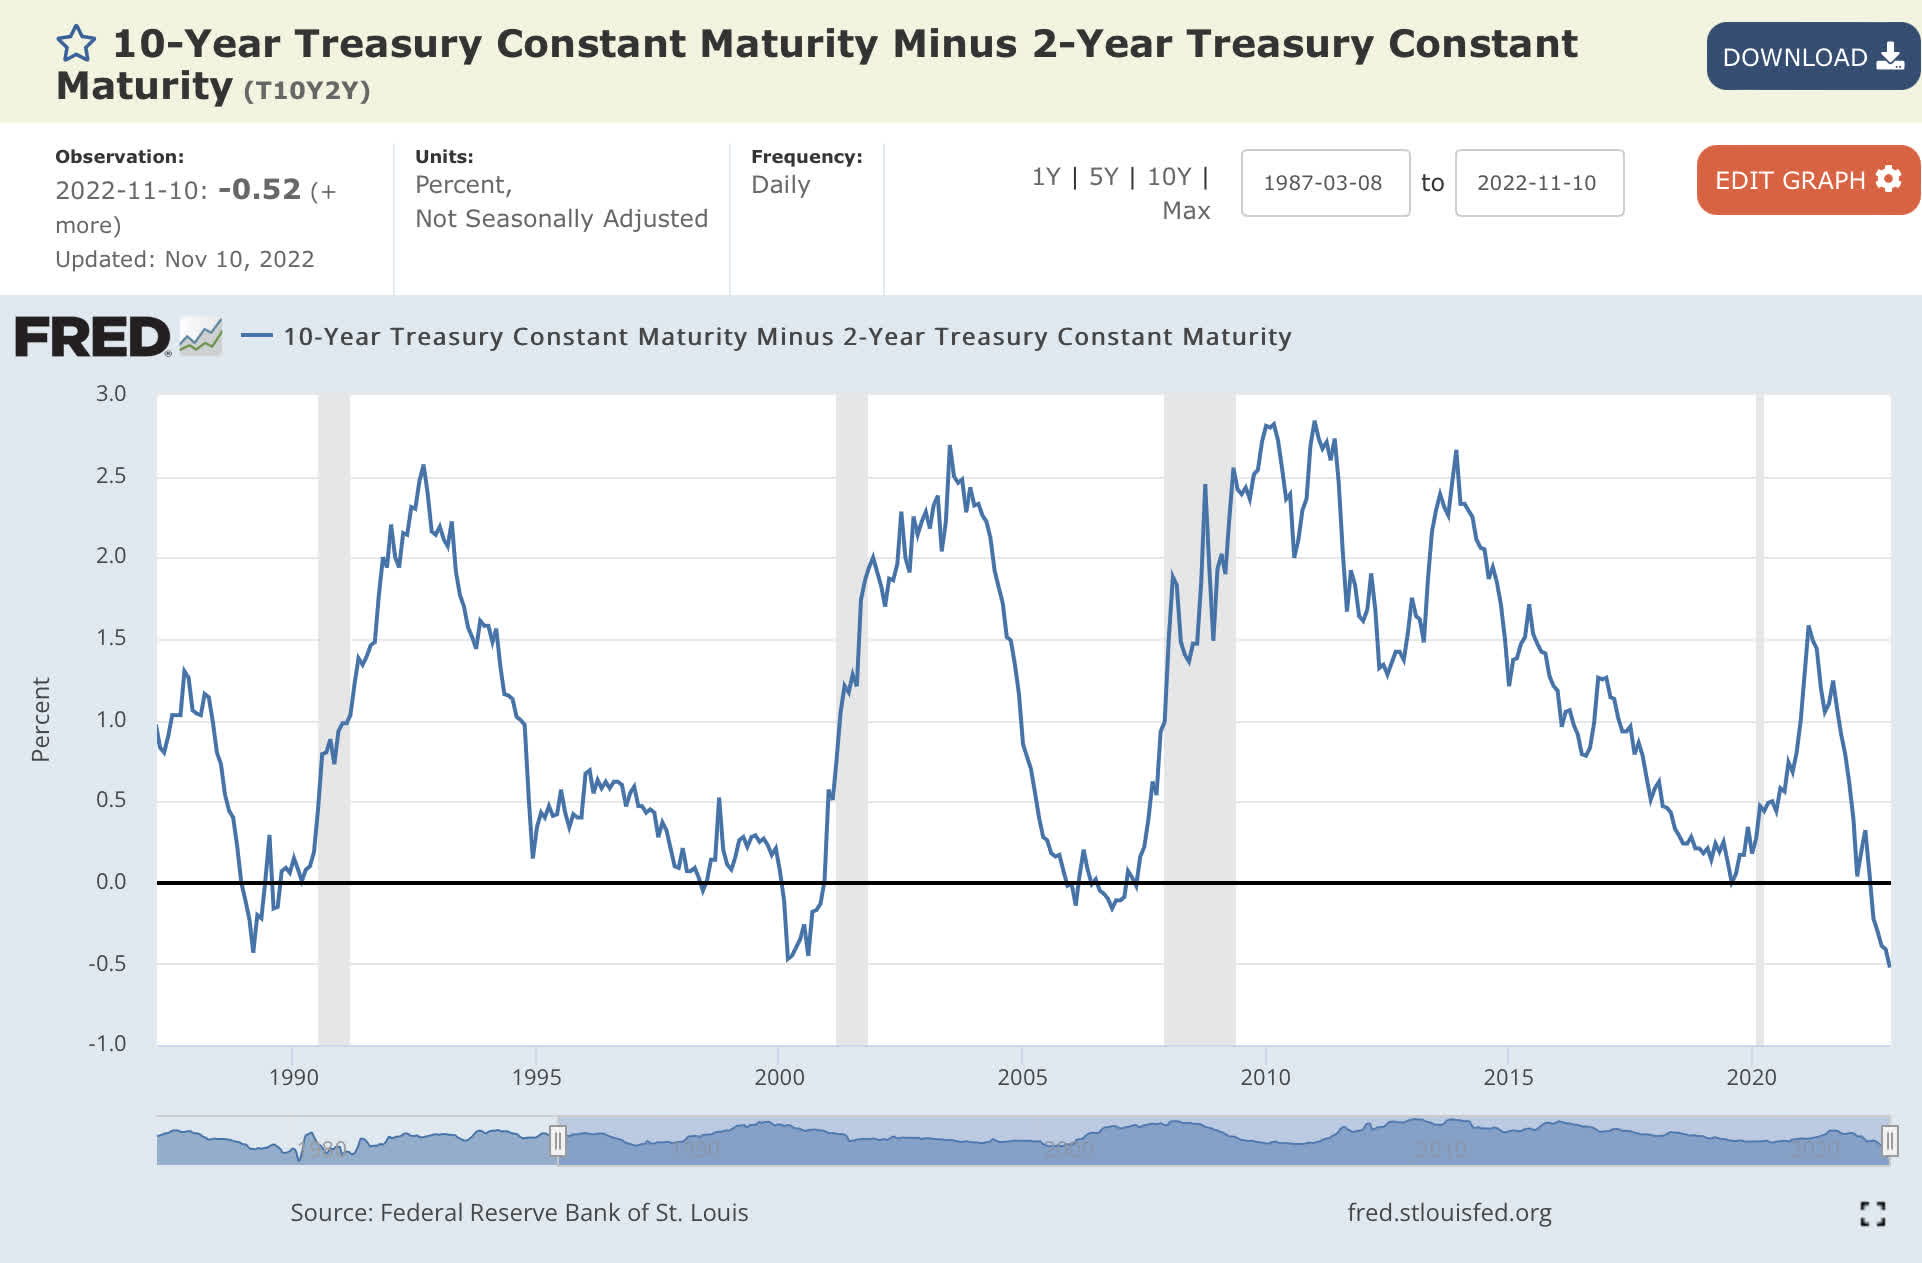
When the 10-year minus 3-month yield curve inverts along with the 10-year minus 2-year yield curve, the likelihood of a recession increases. Below is the chart of the 10-year minus 3-month yield curve.
10-year 3-month yield curve chart (St Louis Federal Reserve )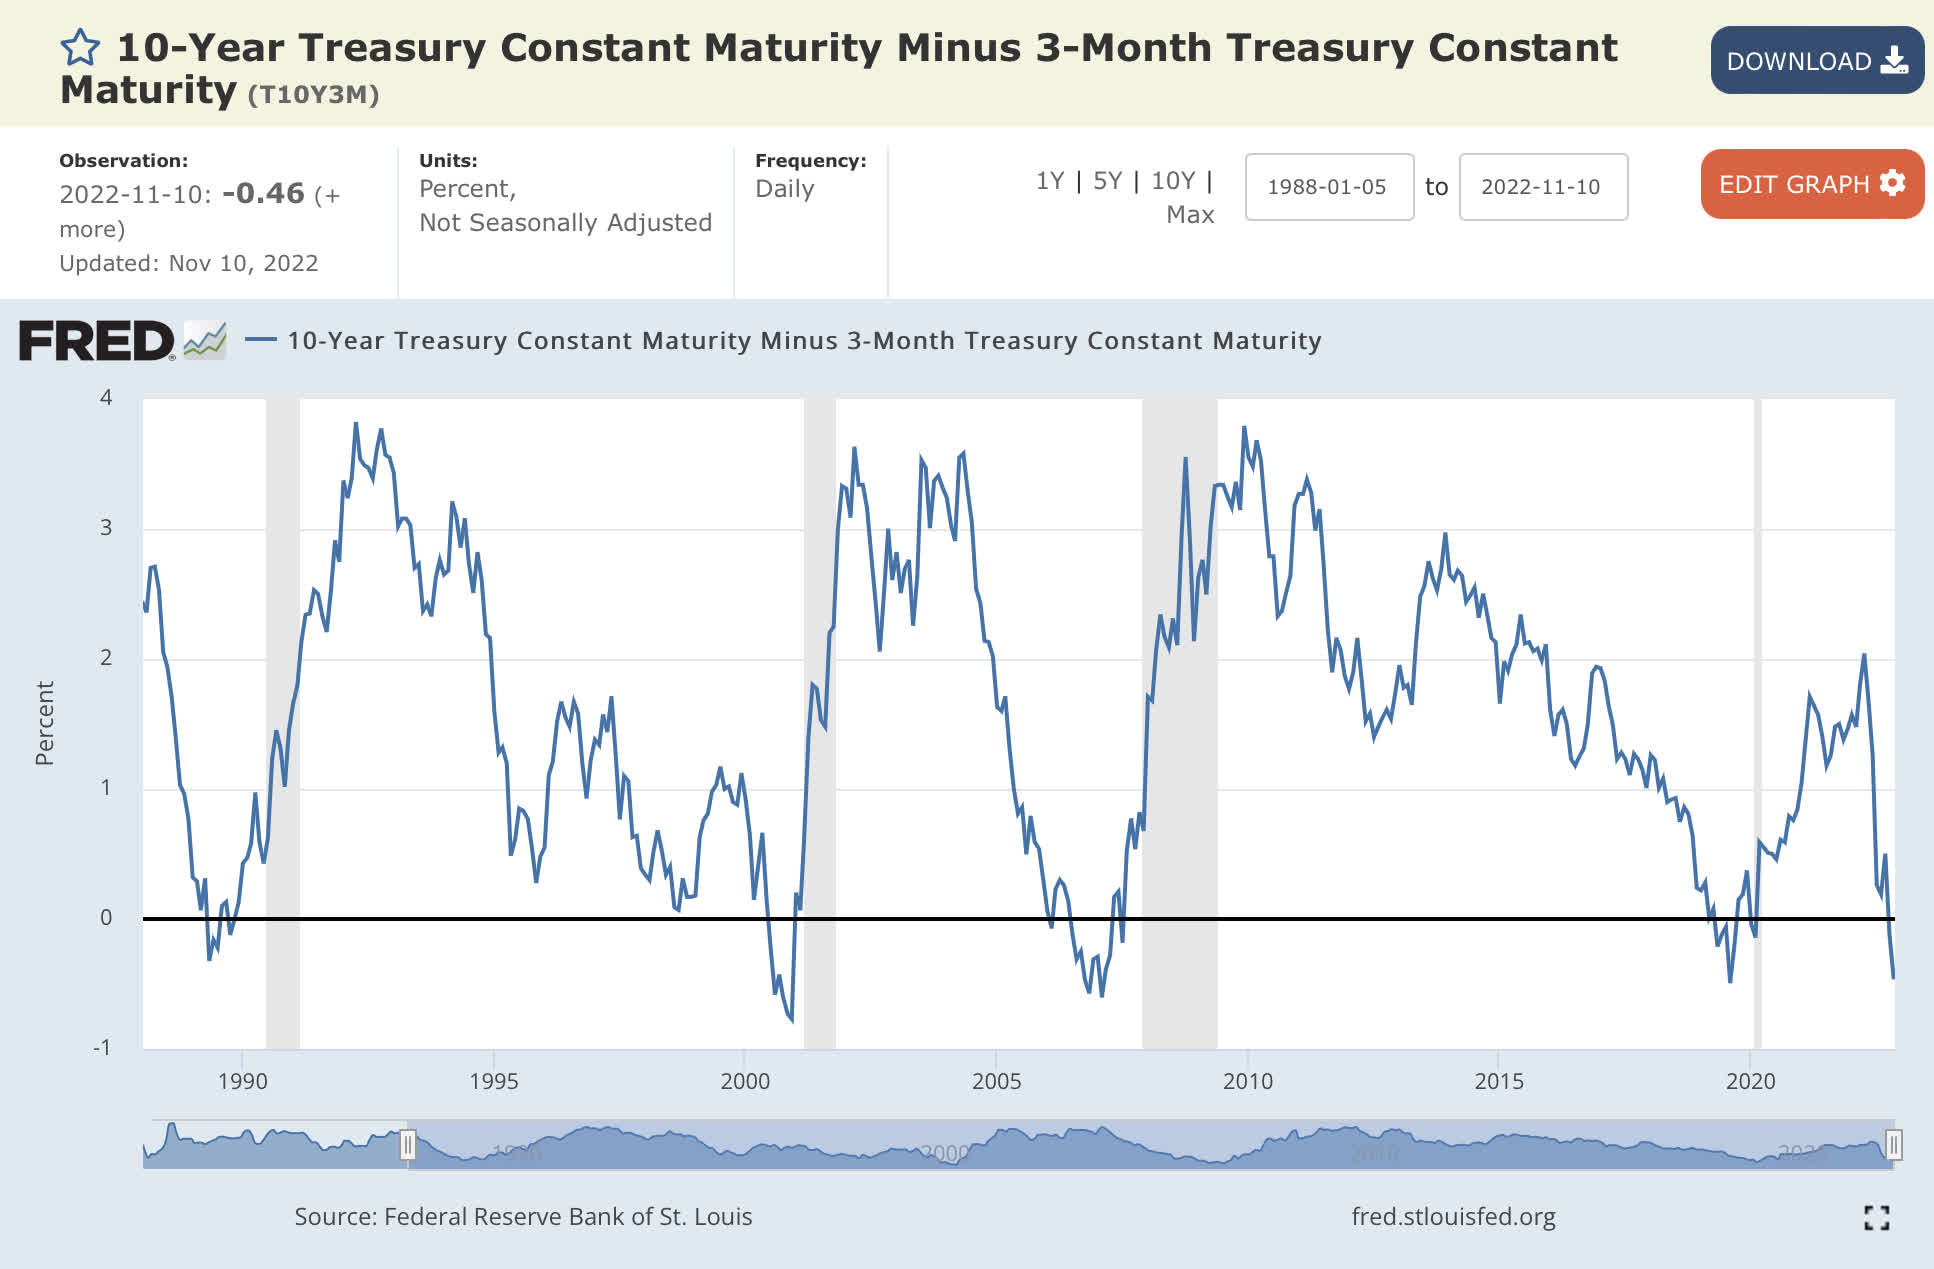
Even if inflation and interest rates are coming down, the economy could be headed into a recession, which would impact revenue and earnings. Equities will anticipate that and start to break through prior support levels. In addition to the inverted yield curve, the Federal Reserve is doing quantitative tightening, which remains a headwind.
Summary
We will not know for a few months if the stock market bottomed in October 2022 or we are about to get another steep drop; however, equities go up over time. Inflation would result in higher revenue and earnings for stocks in nominal terms. Stock markets bottom well ahead of the economy and earnings and start to look at future earnings growth. So far, the evidence shows us that there are signs to be optimistic about lower inflation leading to lower interest rates and a relatively weaker dollar, all of which would be positive for equities.
For the S&P 500, the levels to watch are 3750 and 4150. A S&P 500 close above 4150 is positive for adding to equities, while a close below 3750 could result in the continuation of the downtrend. Small-cap indexes, mid-cap indexes, transports, and large-value indexes are beginning to outperform. A broadening of the rally and a longer base formation are healthy for SPX and overall for U.S. equities.
Be the first to comment