

S&P 500 Analysis:
- In aggregate, the S&P 500 turns lower in September
- Tech stocks (FANG) valuations drop as hurdle rates (US10Y) rise
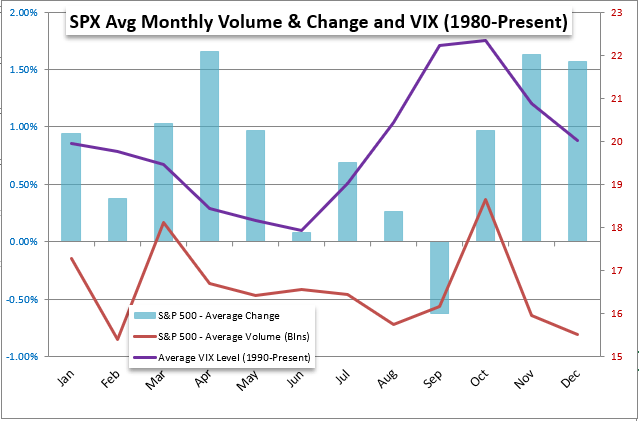
S&P 500 Historically Underperforms in September
The S&P 500 Index traded in line with expectations for the month of September as the stock index closed 4.76% lower. There have been a number of recent headwinds for US large cap stocks: systemic risk via Evergrande, the debt ceiling, rising treasury yields and increasing support from global central bankers to reign in stimulus measures; but historically, September tends to witness a sell-off regardless of the specifics.
Chart prepared by John Kicklighter
With Labor Day marking the end to the summer holidays average volume tends to see a lift as more market participants flood into the markets. The negative historical performance of the index only adds to the rising VIX level as protective cover for a falling market receives a boost.
US Equity Headwinds (Monetary Policy, Rising Yields, Debt Ceiling & Evergrande)
Large cap US stocks have enjoyed an extended run of gains since March 2020 as fiscal and monetary policy worked hand-in-hand to create an accommodative environment for the economic recovery. However, The Fed and other prominent central banks are seriously considering, or have already implemented, measures to reduce stimulus purchases with the view of eventually hiking interest rates.
Keeping with rates, the US 10 Year Yield has witnessed a sizeable increase in the latter weeks of September. Higher yields may have persuaded investors to shift from riskier stocks to the ‘safety’ of the US government, which stands behind all bond repayments.
Rising US 10 Year Yields
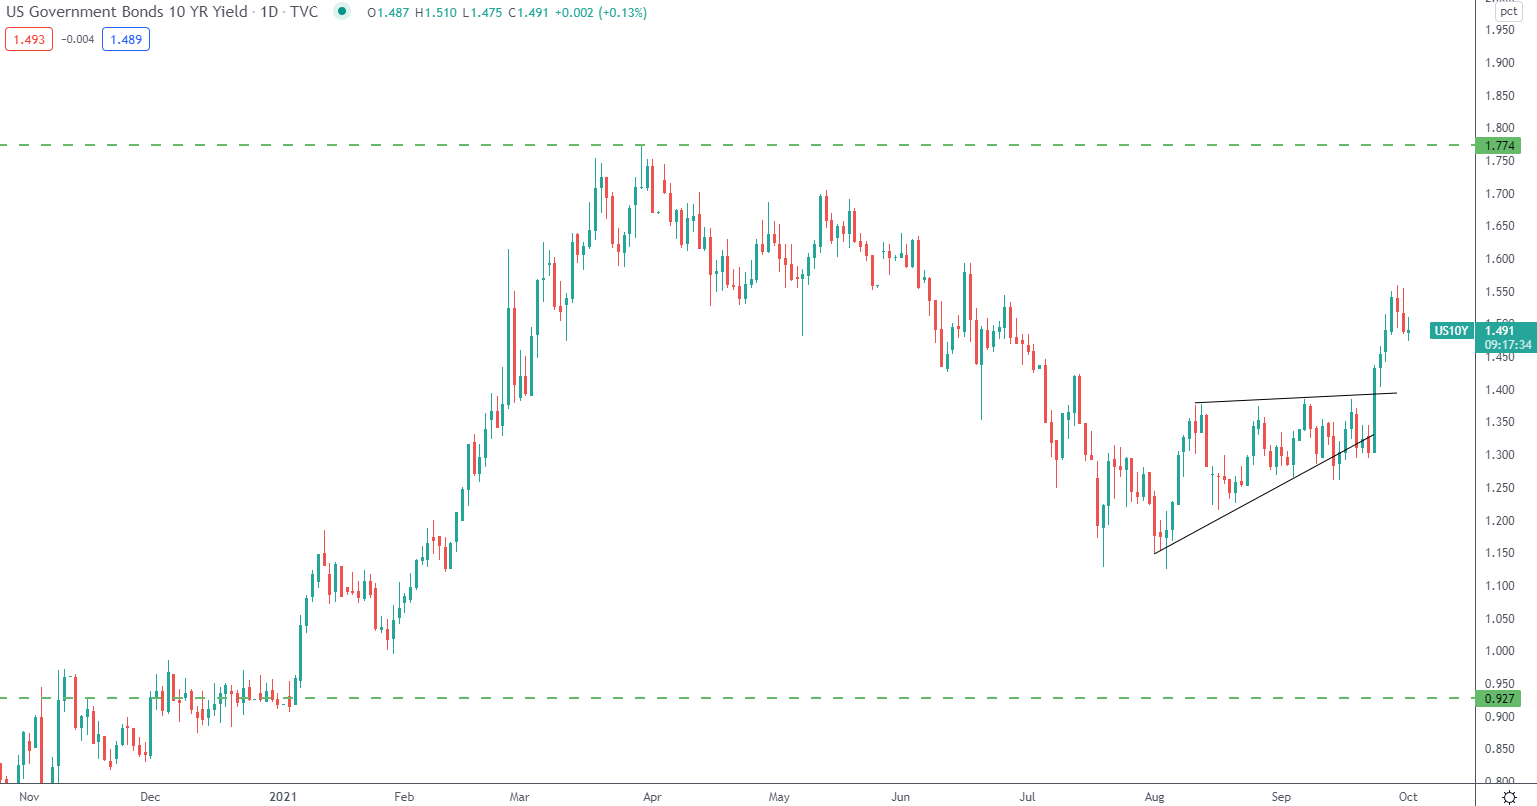
Chart prepared by Richard Snow, TradingView
The issue of the US debt ceiling brings into question the safety element of US treasuries as Democrats and Republicans failed to agree to raise the debt ceiling. Warnings from US Treasury Secretary, Janet Yellen of the US government potentially running out of money to service existing debt obligations near the middle of October if no agreement can be found.
The effect of the rising treasury yields on the stock market plays out via a particular equity valuation technique that discounts future earnings using the treasury rate or similar risk-free benchmark rate. Higher ‘risk-free’ yields result in lower valuations for stocks which carry a significantly more risk.
Learn how to value a stock through our article delving into equity valuation techniques
Tech stocks have carried much of the brunt of what looks to be a sector rotation towards cyclicals such as financials, as rates climb.
Systemic risks arising from Evergrande remain high but have taken somewhat of a back seat after the central bank vowed to protect homebuyers’ interests.
US 500 Key Technical Levels
Since printing an all time high at the start of the month, the index has witnessed a choppy decline. The index trades closer to the 200 day moving average than it has since June 2020 (using IG charts with a Sunday candle), as trend traders weigh up the probabilities of a change to the one way traffic observed thus far. In addition, a simple cross of the 200 day moving average may not be sufficient to look for short entries.
Currently, the 4270 level supports the index as lower prices were rejected at this level while the 161.8% Fib level (4143) of the Feb – March 2020 drop acts as secondary support. Bullish continuation plays may become viable if price can close and hold above the 4375 area with a view to climb up to 4480 before testing the all time high.
US 500 Daily Chart
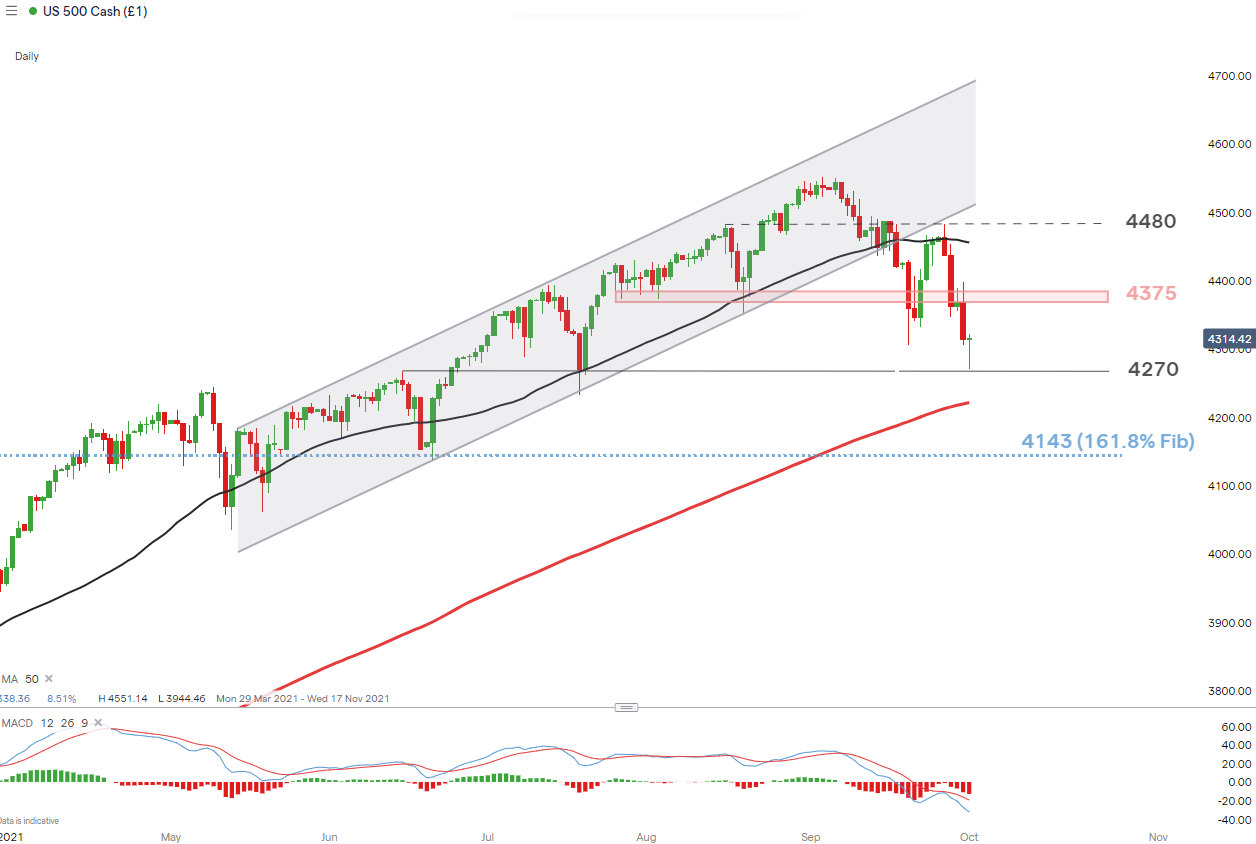
Chart prepared by Richard Snow, IG
— Written by Richard Snow for DailyFX.com
Contact and follow Richard on Twitter: @RichardSnowFX
Be the first to comment