

ThitareeSarmkasat
U.S. bond yields have crept higher over the past several trading sessions following a series of economic data that has raised doubts over the Federal Reserve’s potential monetary policy path in 2023. 10-Year yields in particular have climbed from 3.41% on 4 December to 3.85% at the time of writing, presenting an attractive entry point for investors looking to lock in yields near the October peak of 4.24%.
U.S. Bond Yields, 10s, 5s, 2s (TradingView.com)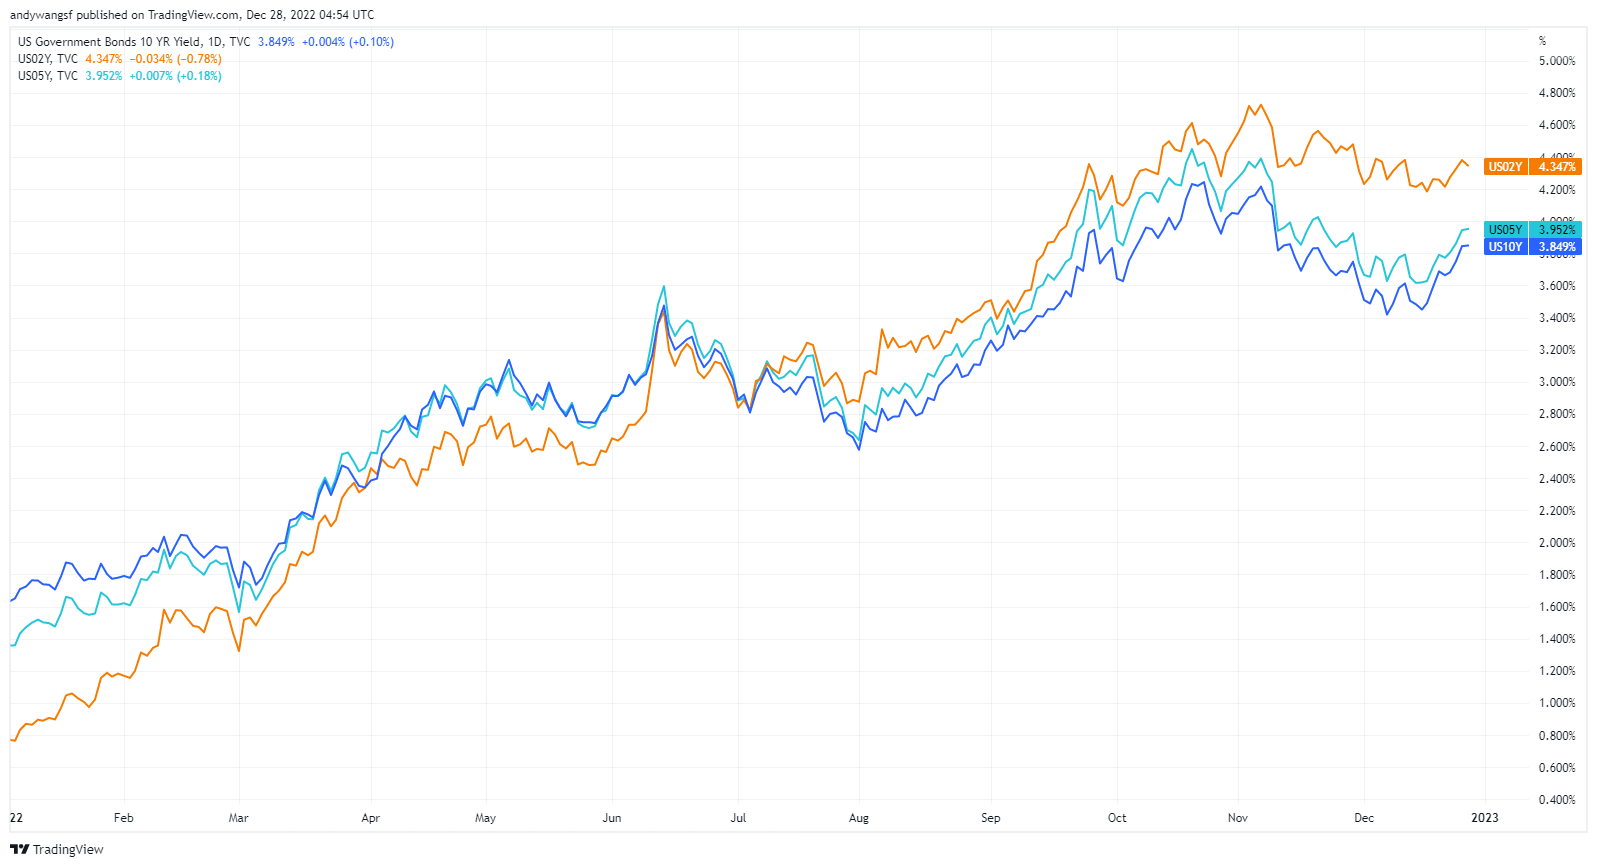
The Bureau of Economic Analysis reported on 23 December that core personal consumption expenditures (PCE) climbed 4.7% year-on-year in November, just slightly above expectations of 4.6%. The recent rise in yields was also accompanied by a sell-off across global bond markets after the Bank of Japan (BoJ) tweaked its yield curve controls on 20 December, alongside U.S. economic data that showed gross domestic product increased at an annual rate of 3.2% in Q3, versus the previous estimate of 2.9%.
These reports, however, do not alter our core view for yield compression in 2023. Not only do we see default risk moderating on the back of a resilient economy, but we also expect the much-awaited Fed pivot to materialize in late 2023 that will drive broad-based declines in yields. We continue to see high-yield bonds setting up for historic gains that could potentially surpass equity returns in the next one to two years.
Admittedly, we were surprised by the uptick in U.S. bond yields over the past week, especially given that most of the evidence we see continues to point towards disinflation and resilient private consumption. Nonetheless, we remain convinced that yields have peaked and will ultimately trend lower in anticipation of Fed monetary policy normalization in 2023.
Fed’s Dot Plot Forecasts Have Been Priced In
The Fed’s December “Dot Plot” projections indicate that its policy rate is expected to peak at 5.1% in 2023 according to the median forecast. Thereafter, the policy rate is expected to be cut to 4.1% sometime in 2024. These projections are generally in line with our view that the U.S. economy will be resilient enough to accommodate Fed funds rates of 4.5% to 4.75%.
Bloomberg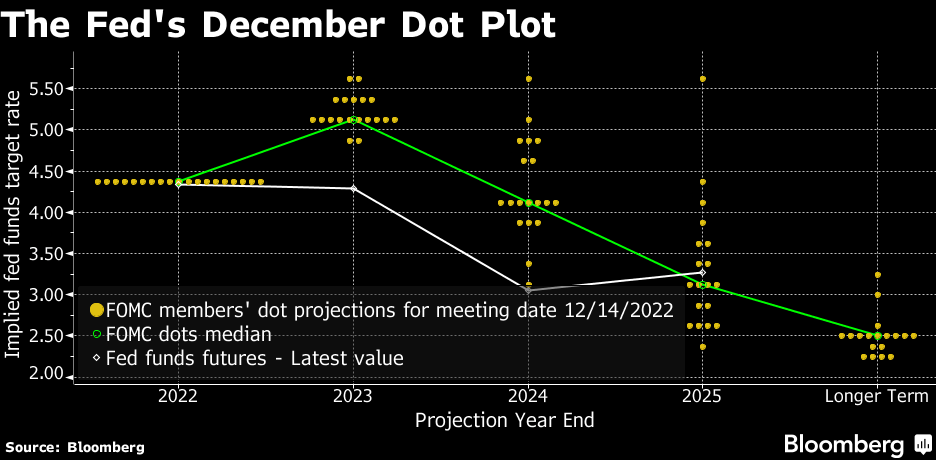
For now, the scenario that the Fed could take its policy rate beyond 5.0% remains a tail risk in our view. We also appreciate that the FOMC is in a difficult position of having to carefully manage market sentiment so that financial market conditions do not ease prematurely. Thus, it is reasonable that the FOMC may have chosen to err on the side of caution by signaling its commitment to fight inflation, and its willingness to do so even at the expense of the economy. For 2023, seven out of 19 FOMC members expect rates to rise above 5.25% and for rates to remain above 4.1% in 2024.
Signaling and posturing aside, the reality that inflationary pressures continue to ease broadly across supply chains and commodity markets means that the odds for monetary policy normalization by end-2023 are improving. Accordingly, we view the recent uptick in yields as a great opportunity, and potentially the final chance, for investors to add high-yield bonds to their portfolios.
One of the easiest ways for investors to quickly build diversified exposure to U.S. high yields is to invest in a high-yield bond ETF. Indeed, we have recently initiated coverage of the iShares iBoxx $ High Yield Corporate Bond ETF (HYG) with a “Strong Buy” rating on 7 November, and we maintain our bullish view on HYG. Next, we will look at another high-yield bond ETF that we think is equally attractive as HYG.
SPDR Portfolio High Yield Bond ETF
According to fund information provided by State Street Global Advisors, the SPDR Portfolio High Yield Bond ETF (NYSEARCA:SPHY) seeks to provide investment results that correspond generally to the price and yield performance of the ICE BofA US High Yield Index. The index is weighted by market capitalization and designed to measure the performance of dollar-denominated high-yield (below investment grade) corporate debt.
At the time of writing, SPHY had around US$822 million in assets under management, which is relatively small compared to HYG (US$17 billion). However, SPHY has a much lower expense ratio of just 0.1% and a higher average yield-to-maturity of 8.86%, compared to 0.48% and 8.27% respectively for HYG.
In terms of performance, notice how closely correlated the two ETFs are and that prices virtually trade in lockstep throughout the year with a small year-to-date performance gap of just 0.6% (SPHY being the laggard) in the accompanying chart below. Thus, we think both are equally good proxies for establishing a broad and diversified exposure to U.S. high-yield bonds.
YTD Performance HYG & SPHY (TradingView.com)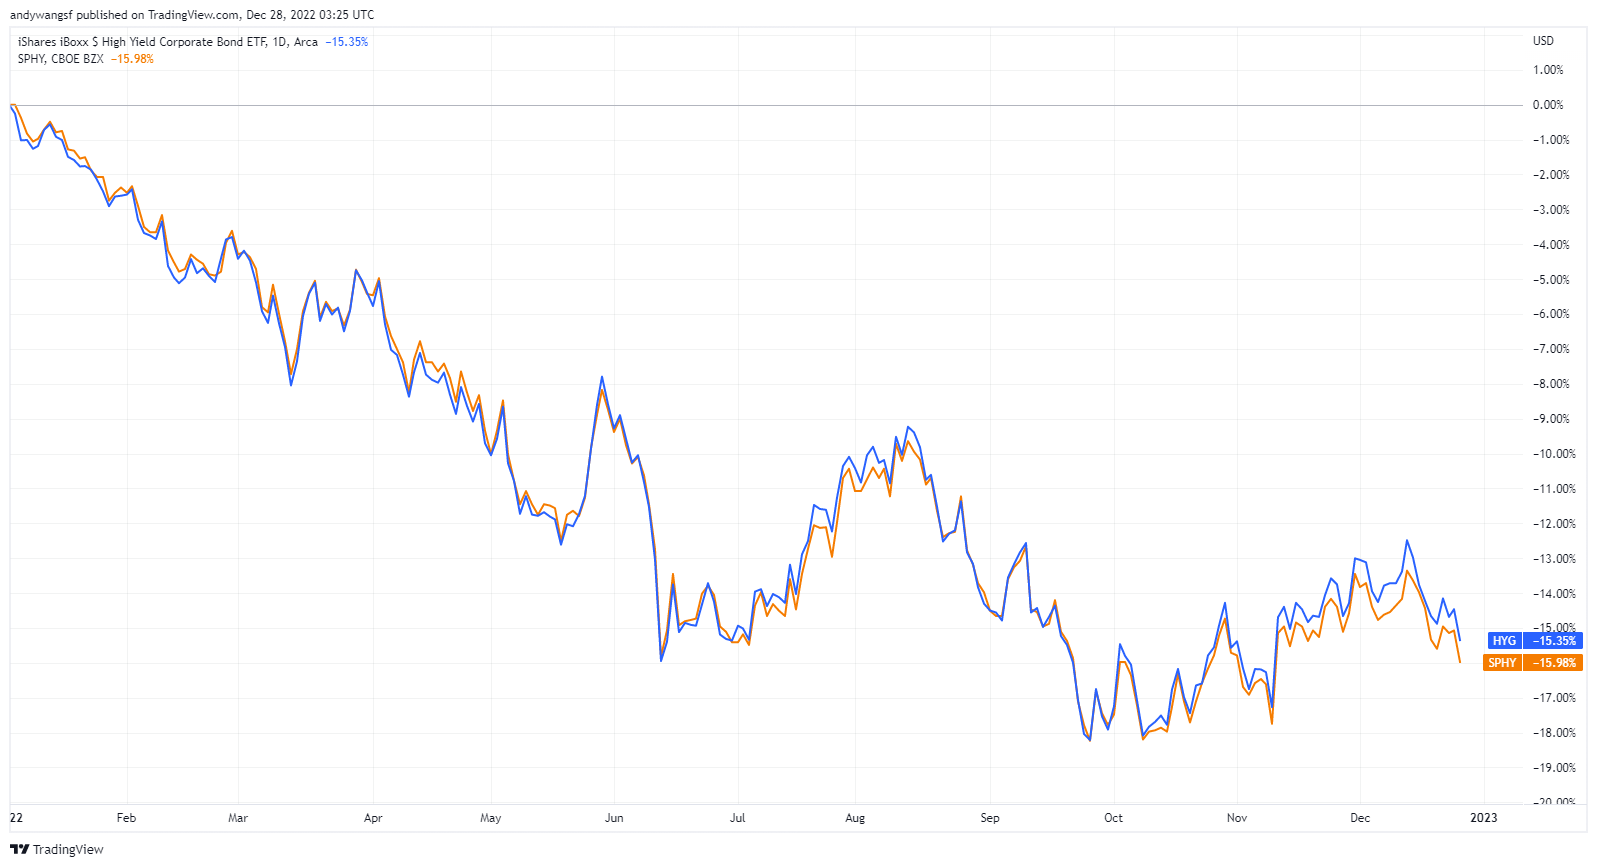
Below are some other metrics that are commonly used to compare bond ETFs. We have provided the latest available snapshot from the respective issuers for comparison.
State Street Global Advisors iShares
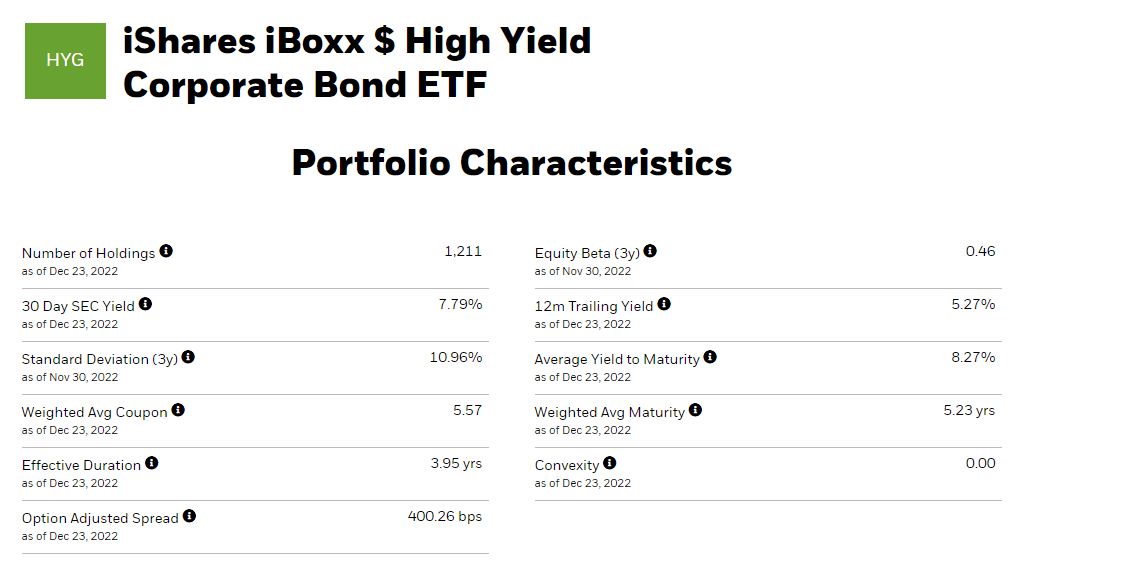
Overall, both ETFs have quite similar structures in terms of average maturity (5.2 – 5.6 years), and duration (3.87 – 3.95 years). The major difference is that SPHY’s portfolio is slightly riskier and therefore offers a slightly higher yield. Although SPHY’s portfolio has a significantly larger number of holdings (1,944) compared to HYG’s (1,211), both ETFs are adequately well-diversified with individual holdings not exceeding 0.5% of the portfolio.
We particularly like SPHY’s low expense ratio of just 0.1%, which makes the ETF more suitable for investors seeking to invest over a longer-term horizon.
SPHY’s trading metrics are healthy with tiny spreads, average daily volumes of around US$2.5 billion, and the fund trading very close to NAV.
etf.com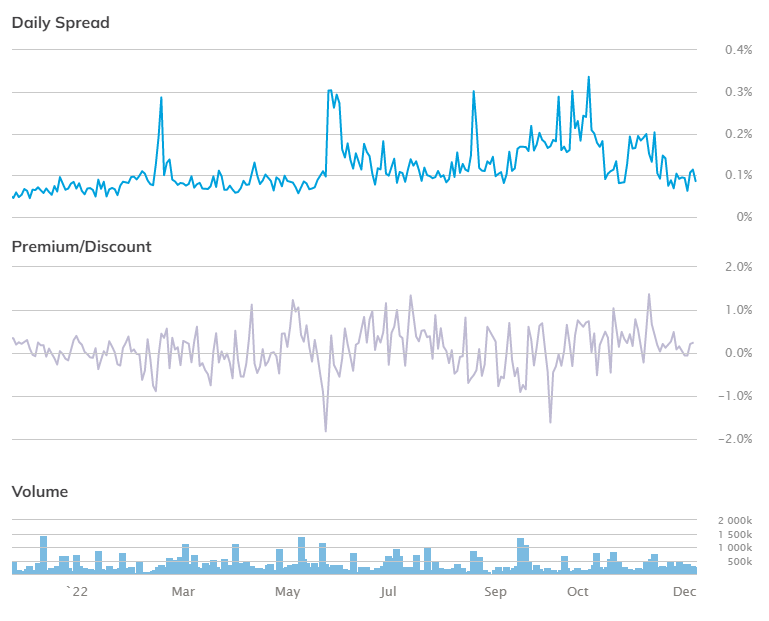
Typically, the consumer cyclical sector is deemed as a risky sector as consumers tend to cut back on discretionary spending first when anticipating an economic downturn. However, US consumers are in really good shape heading into 2023 due to factors including healthy household balance sheets, strong labor markets, and rising wages. This bullish outlook on US consumer spending partly explains why we think the risks associated with investing in SPHY and the broader high-yield fixed-income space, are much more benign compared to past economic cycles.
As the accompanying figure shows, SPHY is currently weighted more heavily towards Consumer Cyclicals with exposure to the sector making up 21.7% of the portfolio. This heavy concentration towards the consumer cyclical sector, however, is not unique to SPHY and is similarly observed with the portfolios of other comparable high-yield corporate bond funds. This is mainly due to the construction of major corporate bond indices aimed at accurately representing the U.S. economy (private consumption makes up around 70% of U.S. GDP).
State Street Global Advisors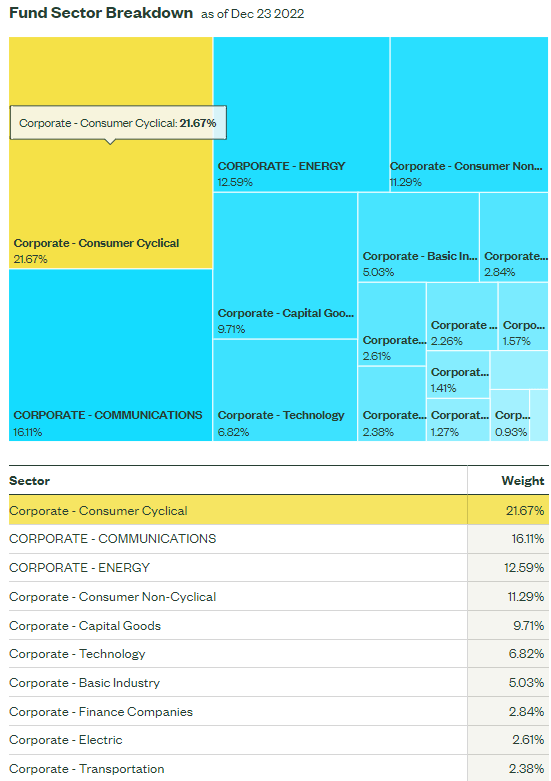
Perhaps this is why high-yield bonds have witnessed such a sharp sell-off in 2022 as investors stick to the old playbook of dumping consumer discretionary risk assets at the very first sign of an economic downturn. Indeed, such views have been frequently echoed by Wall Street analysts calling for a steep pullback in private consumption that will throw the U.S. economy into a deep recession, adding that inflation running at decades highs will impact spending.
From our perspective, each economic cycle is different and we have yet to see conclusive evidence that would indicate a sharp slowdown in private consumption is imminent. The overwhelming fear that is gripping the market reminds us of Warren Buffett’s timeless quote: “Be fearful when others are greedy, and be greedy when others are fearful”.
In Conclusion
We continue to see high-yield bonds setting up for historic gains that could potentially surpass equity returns in the next one to two years. Our bullish outlook on US consumer spending also explains why we think the risks associated with investing in high-yield fixed income are much more benign compared to past economic cycles.
We initiate our coverage of the SPDR Portfolio High Yield Bond ETF (SPHY) with a “Strong Buy” rating.
Be the first to comment