

Andrii Yalanskyi/iStock via Getty Images
Article Purpose
Today’s article aims to inform readers of the significant changes made to the Invesco S&P 500 GARP ETF (NYSEARCA:SPGP) in recent months. As a result of its latest semi-annual reconstitution, SPGP’s portfolio is 27% Financials, 18% Health Care, and 15% Technology, has an estimated 20% earnings growth rate and trades at an ultra-low 15x forward earnings. These metrics are excellent, but I intend to look under the hood and reveal other tradeoffs readers should consider. I think SPGP is better than it was in the first half of the year, but the concentration in a few sectors and the added volatility that comes with it isn’t worth the risk in this uncertain market. Therefore, I’m maintaining my hold rating on SPGP.
ETF Overview
Strategy
SPGP tracks the S&P 500 GARP Index, using five factors to select 75 constituents from the parent Index at each semi-annual reconstitution in December and June:
- three-year earnings per share growth
- three-year sales per share growth
- financial leverage
- return on equity
- earnings to price ratio
Traditional GARP investing focuses on earnings growth and price-earnings ratios, so it’s nice to see the Index also considers sales growth, which is less volatile and more difficult to manipulate. Furthermore, the inclusion of the financial leverage (total assets / common equity) to accompany the return on equity screen ensures growth results from either high profit margins (net income/sales) or more efficient use of assets (sales/total assets). The DuPont Model, which breaks down the sources of a company’s ROE, helps us easily understand the math.
Corporate Finance Institute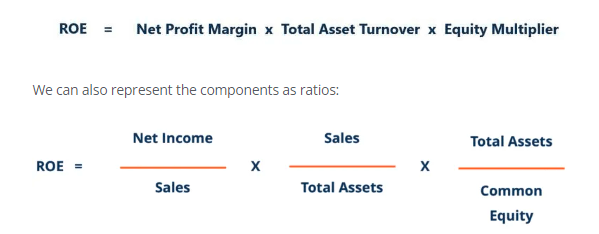
The net result is that companies aren’t using excessive leverage to boost profits. This screen is essential now that interest rates are rising as the Federal Reserve seeks to cool inflation.
The process for selecting constituents is to first calculate a growth score for S&P 500 constituents, with the top 150 qualifying. Then, 75 companies are chosen based on their quality and value scores, with the Index ultimately being growth-score weighted. Finally, stock and sector allocations are capped at 5% and 40%.
Performance
It’s crucial to differentiate between Index performance and fund performance because SPGP has changed its strategy several times since its inception in June 2011. According to Invesco, SPGP began tracking its current Index on June 21, 2019. Therefore, performance history is limited, but here is how it compared with the SPDR S&P 500 ETF (SPY) since July 2019.
Portfolio Visualizer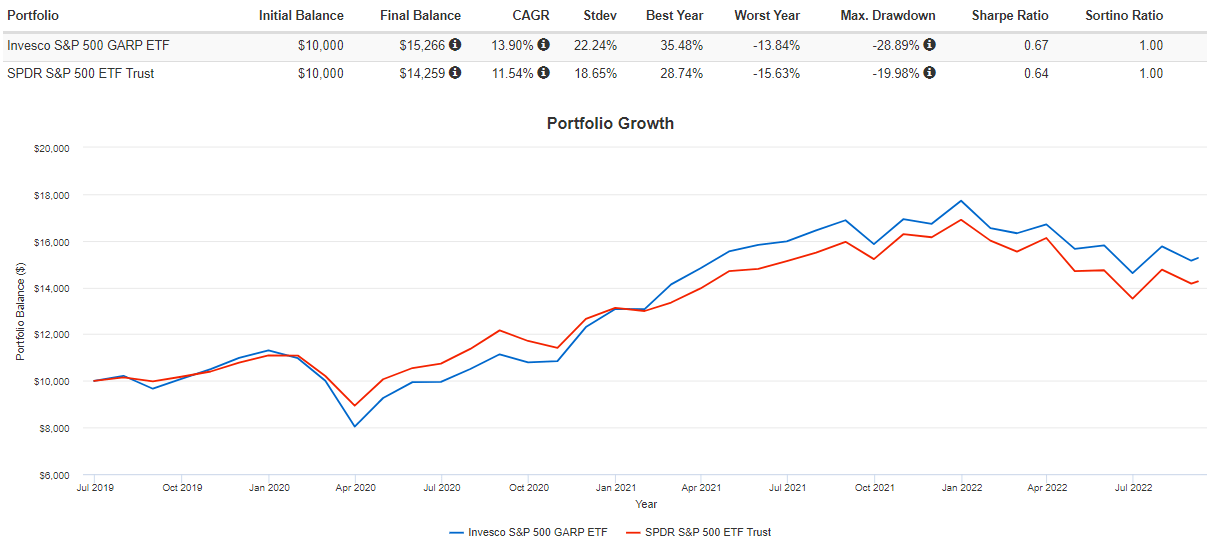
SPGP has gained an annualized 13.90% compared to 11.54% for SPY. It’s been more volatile and had a much larger drawdown in Q1 2020 (28.89% vs. 19.98%), but its risk-adjusted returns were still better.
Readers can also consider backtested results starting in September 2012. Annualized returns were 12.46% compared to 12.90% for SPY for the ten years. Between September 2012 and June 2019, the GARP Index trailed the S&P 500 Index by 1.75% per year (12.13% vs. 13.87%).
S&P Dow Jones Indices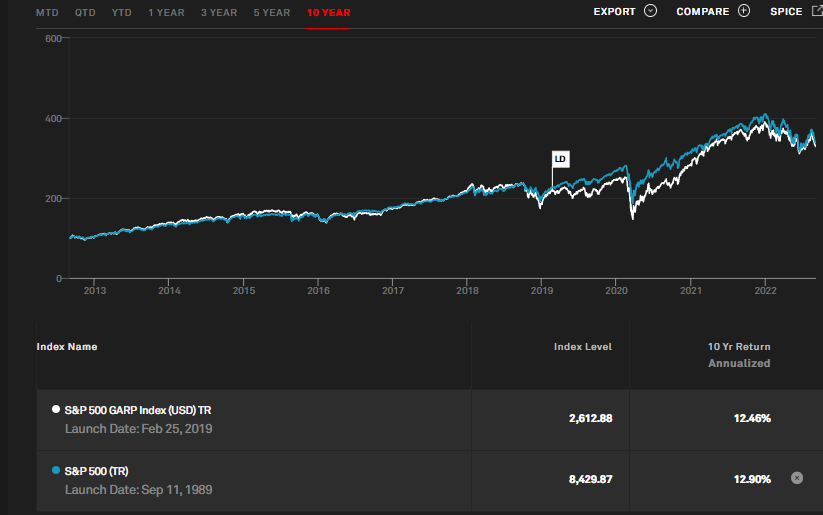
I’m unsure what to make of these results, as backtested data is often biased. However, I’m less interested in what the Index did historically and more focused on how it’s constructed today. Therefore, let’s look at SPGP’s sector exposures and top holdings next.
Top Holdings and Sector Exposures
SPGP’s top ten holdings total 18.76%, indicating it’s reasonably well-diversified at the individual company level. Worth noting is that SPGP’s top 25 holdings total 41.76%, and the top 50 total 73.60%. Therefore, it seems closer to an equal-weight ETF, likely because there isn’t a wide range in growth scores among the selected companies.
Invesco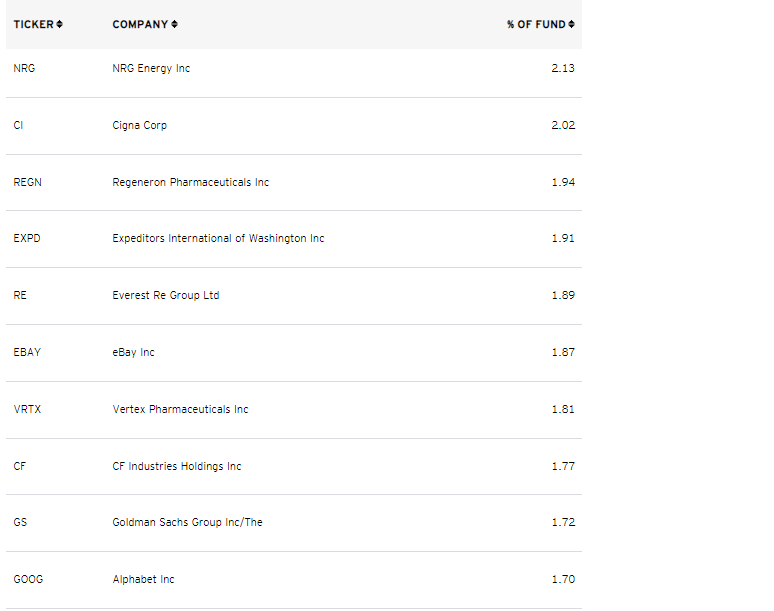
The following table, courtesy of Morningstar, compares SPGP’s sector exposures with SPY and the SPDR S&P 500 Growth ETF (SPYG). The highlight is SPGP’s 27.56% exposure to Financials, suggesting substantial “growth-at-a-reasonable-price” opportunities in the sector.
Morningstar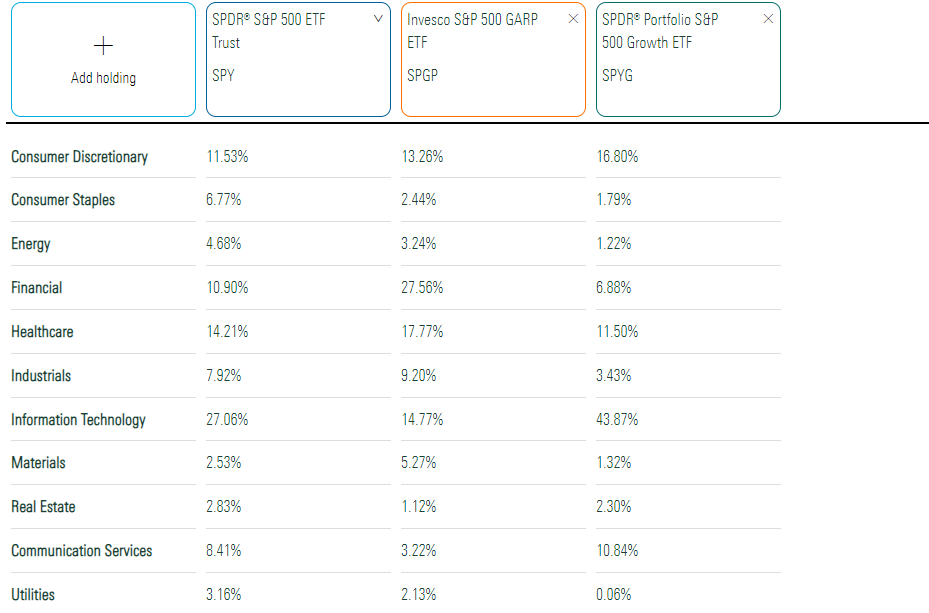
Financials exposure increased by about 10% after the June reconstitution, while Health Care dipped by 13%. According to backtested data, the average exposure for the Financials sector was closer to 11% from 1995 to 2019, and this latest reconstitution saw 33 new holdings. This further suggests that investors shouldn’t pay much attention to SPGP’s past results. SPGP’s current portfolio is substantially different than what would be considered typical.
S&P Dow Jones Indices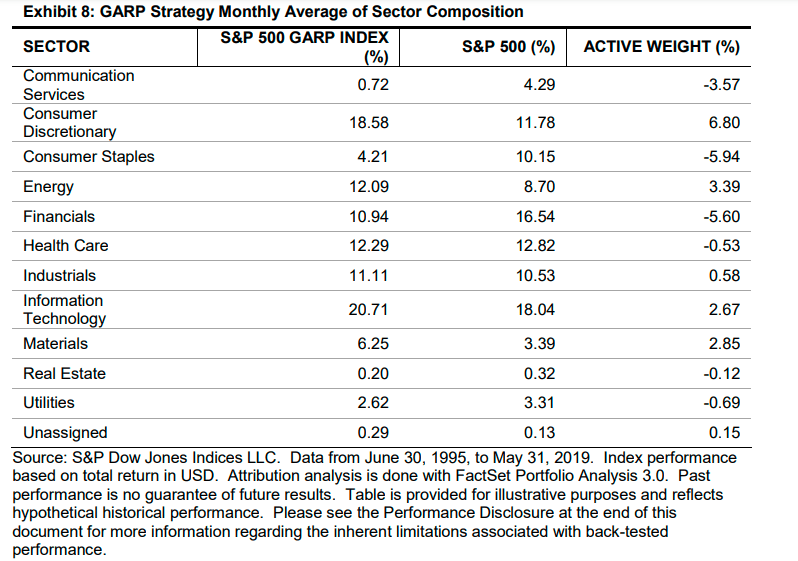
Fundamental Analysis
Company Snapshot
It’s no surprise that SPGP scores well on growth and valuation. After all, that’s what it’s designed to do. The following table highlights these metrics for the top 25 holdings.
The Sunday Investor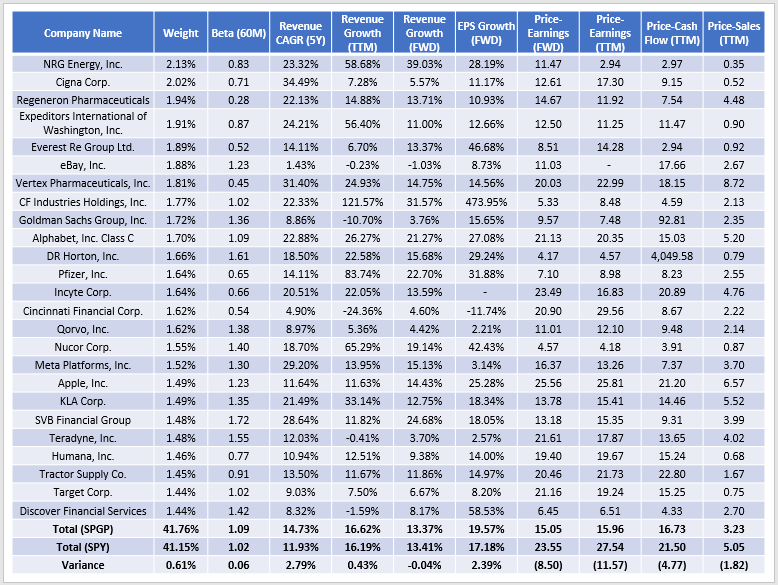
Remember that SPGP’s screens are backward-looking, and many of these companies have had incredible sales growth recently. Examples include NRG Energy (NRG) at 58.68%, Expeditors International of Washington (EXPD) at 56.40%, and CF Industries (CF) at 121.57%. Slower-growing companies like eBay (EBAY) usually offer low valuations as compensation.
Forward-looking estimates may be more appropriate, given how market dynamics have changed this year. Estimated sales growth is around 13% for SPGP and SPY, while SPGP has a 2.39% edge in estimated earnings per share growth (19.57% vs. 17.18%). However, SPGP wins easily on all valuation metrics. Its forward price-earnings ratio is 8.50 points lower and is significantly cheaper on trailing earnings, sales, and cash flow.
SPGP Structure: Financials Sector Is Advantaged
These favorable metrics can be misleading because the GARP Index doesn’t select stocks as they compare to their sector peers. To illustrate, consider the trailing price-earnings ratios and five-year sales growth rates for each S&P 500 sector as of August 2022.
The Sunday Investor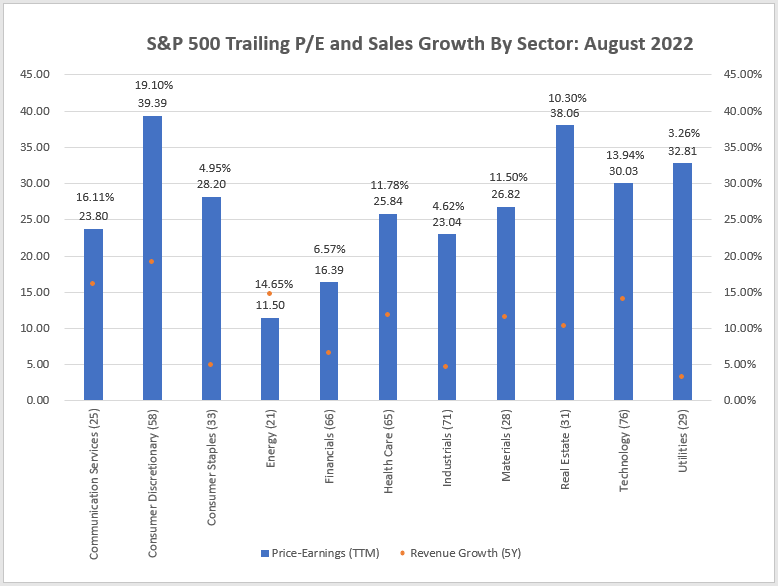
The trailing price-earnings ratio for the Financials sector is 16.39, the second-lowest next to Energy. Since the sector is known for trading at low valuations and there are 66 companies to choose from, I think that gives it a structural advantage. In contrast, the Utilities sector has a weighted-average 32.81 price-earnings ratio, a 3.26% five-year sales growth rate, and a sample size of just 29. The odds of these stocks getting large representation in SPGP are low.
Industry Snapshot
Next, I want to look beyond SPGP’s sector compositions and into the specific industries themselves. The following table highlights the top 25, with summary metrics at the bottom for SPGP and SPY.
The Sunday Investor
SPGP’s weighted-average market capitalization is only $142 billion, $375 billion lower than SPY. With few exceptions, SPGP steers clear of mega-cap stocks, so it could be a solid complementary ETF to SPY that will enhance diversification. However, investors should expect more volatility, given the current portfolio’s 1.09 five-year beta. The overexposure to smaller Regional Banks and Consumer Finance stocks drives this volatility, which might harm investors in a bear market. Even if we look at YTD returns, several are doing much worse than SPY’s 16% decline.
Seeking Alpha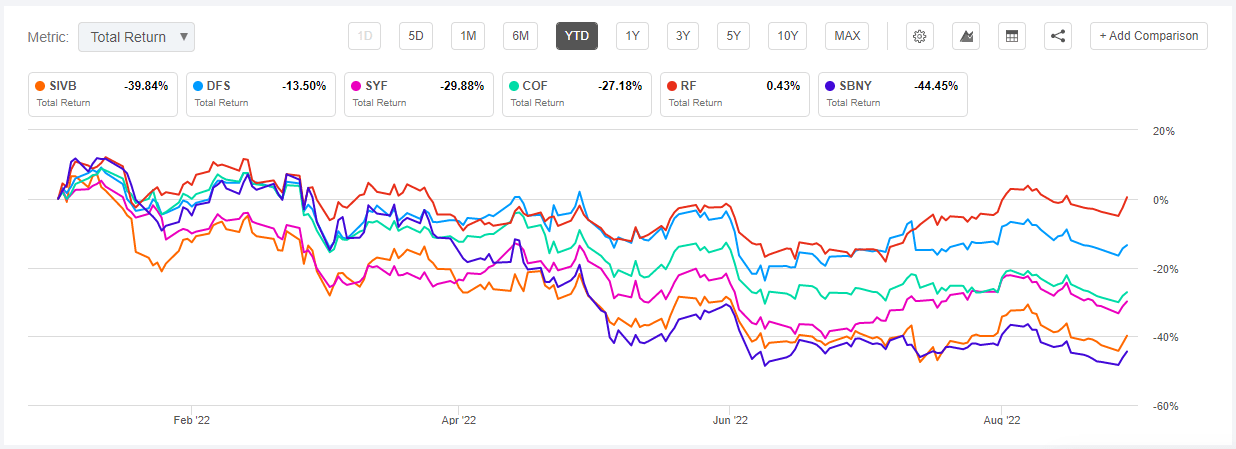
And if we look back to the Great Financial Crisis between November 2007 and February 2009, the losses were even more remarkable. Capital One Financial (COF) and Regions Financial (RF) lost around 80%.
Seeking Alpha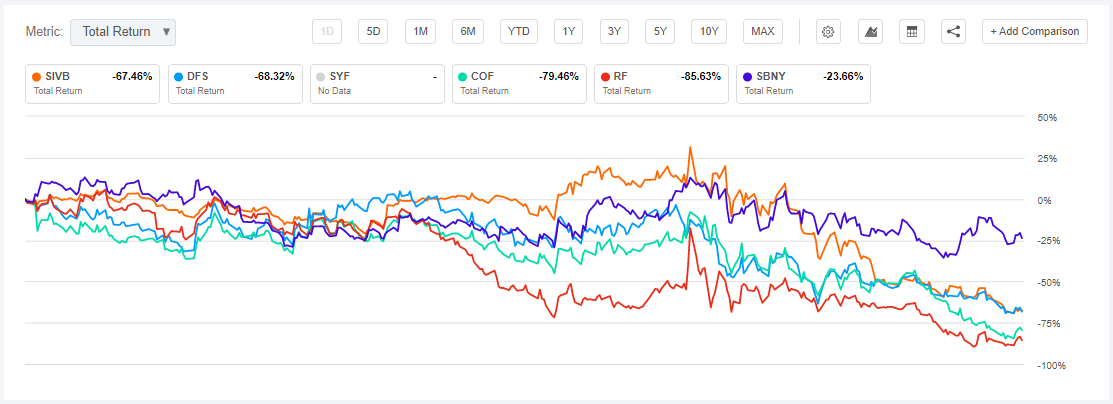
Of course, the past isn’t prologue, but certain industries tend to be riskier, and it’s challenging to pick out top performers in advance when an industry comes under pressure. Higher interest rates add to the risk of a recession, and the yield curve has been inverted since July. An inverted yield curve often precedes recessions (shaded areas). Therefore, I don’t think it’s a good idea to be adding to a high-beta portfolio like SPGP right now.
St. Louis Federal Reserve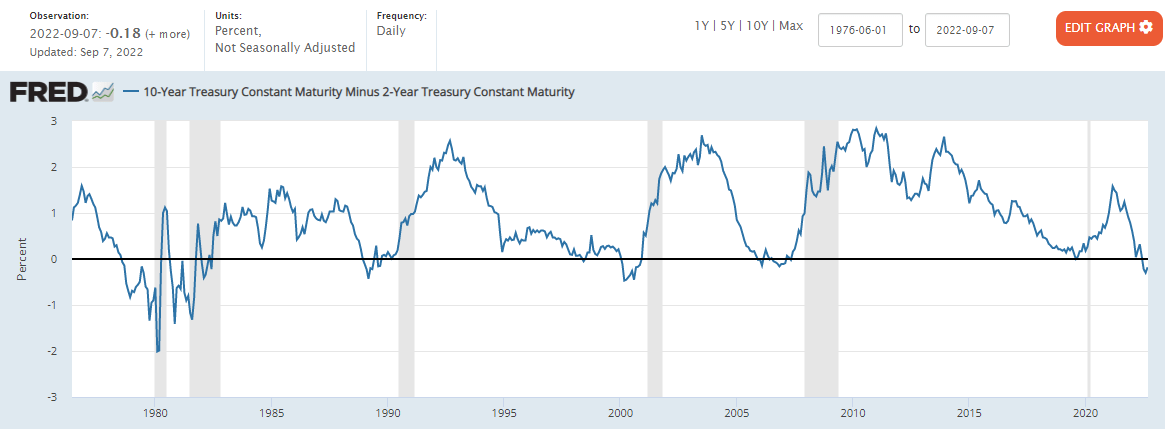
One final point to consider is how many of SPGP’s constituents had a poor last quarter, as measured by sales surprise figures. The weighted-average surprise was only 1.16% or about half of SPY’s 2.28%. Again, I want to focus on SPGP’s 22 Financials sector constituents to highlight this risk. The table below shows how these companies’ quarterly sales surprises are steadily declining. In Q3 2021, they were 4.01%, but that figure is -3.78%. At this point, it feels too much like trying to catch a falling knife, and given the uncertainties in the market, it’s not a game I recommend playing.
The Sunday Investor
Investment Recommendation
At first glance, SPGP’s fundamentals are excellent. It trades at 15x forward earnings and has a nearly 20% earnings growth rate, but these numbers mask critical risks investors should consider:
- It’s heavily concentrated in just a few sectors.
- Its Financials sector stocks have negative-trending sales surprises, suggesting recent price declines are warranted.
- There are too many uncertainties, and buying an above-average-volatility ETF isn’t appropriate.
SPGP can be used as a complement to SPY, given it currently focuses on lesser-known names in the S&P 500, but still, I wouldn’t add now. I’m rating SPGP as a hold, and look forward to providing an update later this year when its Index reconstitutes next.
Be the first to comment