

Andrii Yalanskyi/iStock via Getty Images
Investment Thesis
Today’s article aims to inform readers of recent changes to the Invesco S&P 500 GARP ETF (NYSEARCA:SPGP). After December’s Index reconstitution, SPGP is back to overweighting Health Care and reduced exposure to many Financials sector holdings I wrote cautiously about in September. The current portfolio trades at an attractive 16.43x forward earnings and has an estimated 14.51% earnings growth rate, precisely the type of figures GARP investors expect. However, I caution that these changes appear speculative. Analysts are pessimistic about most of the holdings, reflected by SPGP’s disastrous 4.38/10 EPS Revisions Score. This score is the worst among any U.S. large-cap ETF I track and suggests the estimated growth may not materialize. Therefore, I don’t recommend buying SPGP now, and I look forward to taking you through the latest changes and fundamentals next.
SPGP Overview
Strategy Discussion
SPGP tracks the S&P 500 GARP Index, using five factors to select 75 constituents from the S&P 500 Index each June and December, as follows:
- Three-year earnings per share growth
- Three-year sales per share growth
- Financial leverage
- Return on equity
- Earnings-To-Price
The financial leverage screen is smart because it limits the influence of companies whose earnings were primarily achieved using debt. As shown in the graphic below, if we restrict the last component (financial leverage), return on equity is achieved by either stronger earnings margins or more efficient use of sales, both of which are desirable.
Corporate Finance Institute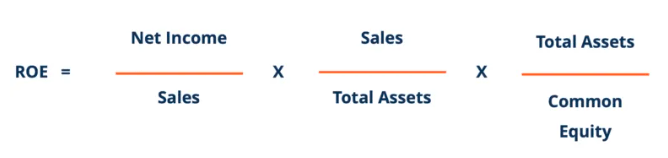
The selection process begins by calculating a growth score for S&P 500 constituents, with the top 150 qualifying. Next, 75 companies are chosen based on their quality and value scores, with the components weighted by their growth scores. Naturally, this order of operations means growth is preferred over value. However, I recently discussed the shrinking growth gap between broad-market value and growth Indexes. For example, the Vanguard Value ETF (VTV) and the Vanguard Growth ETF (VUG) had 11.89% and 15.20% estimated earnings growth rates on December 20, 2022. Six months ago, the gap was 9.67% (14.35% vs. 24.02%). The result is that more traditional value stocks pass that initial 150-stock screen, and that’s reflected in SPGP’s sector exposure changes.
Sector Exposures and Top Ten Holdings
SPGP has 28.07% exposure to Health Care stocks, up from 18.98% last month. Most exposure is Biotechnology (8.38%), Health Care Equipment (5.33%), and Health Care Services (4.36%), which have five-year betas of 0.83, 0.98, and 0.92.
Invesco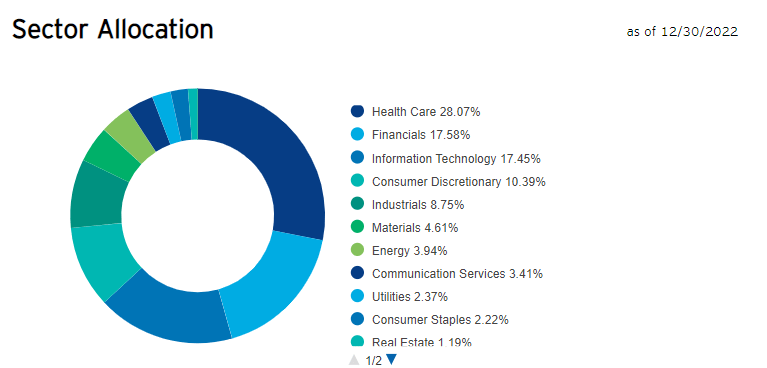
Financials sector exposure dipped from 27.12% to 17.58%. Except for a slight increase in Technology (14.90% to 17.45%), these were the main changes from a sector perspective. The Index has a 40% sector limit, but it’s not currently challenged.
SPGP also has a 5% individual cap, but the largest one, NRG Energy (NRG), is only 2.37%. The top ten holdings total less than 20%, so while it’s not an equal-weight fund, it’s close. The implication is that most holdings have similar growth scores, so for this reason, I will assess the portfolio at the industry level instead.
Invesco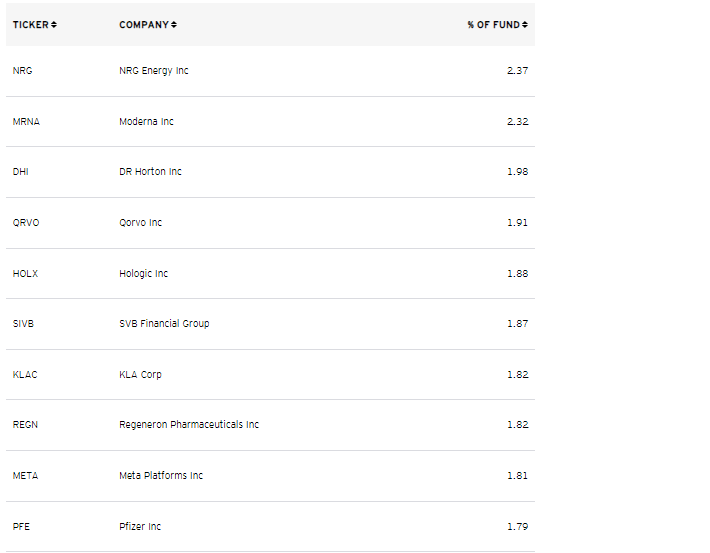
Performance
SPGP’s strategy has changed several times since its June 2011 inception. SPGP began tracking its current Index on June 21, 2019, so there’s little track record to analyze. Still, here is how it’s compared with the SPDR S&P 500 Value ETF (SPYV), the SPDR S&P 500 ETF (SPY), and the SPDR S&P 500 Growth ETF (SPYG) since July 2019.
Portfolio Visualizer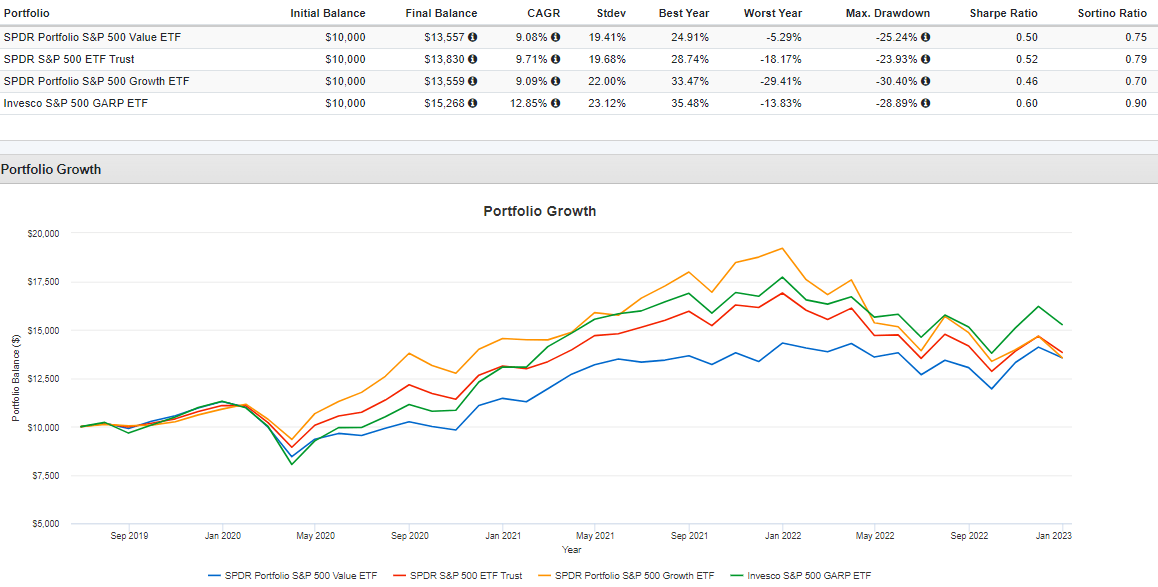
These results are excellent, even with the overall higher volatility. SPGP gained an annualized 12.85% vs. 9.08%, 9.71%, and 9.09% for SPYV, SPY, and SPYG. It even had a solid Q4 2022, gaining 10.73%. However, SPYV outperformed 13.46%, reflecting how value is still in favor.
SPGP Analysis
Reconstitution Recap
SPGP added 17 companies last month with a 23.69% combined weighting. Here is how they performed in the second half of 2022.
Portfolio Visualizer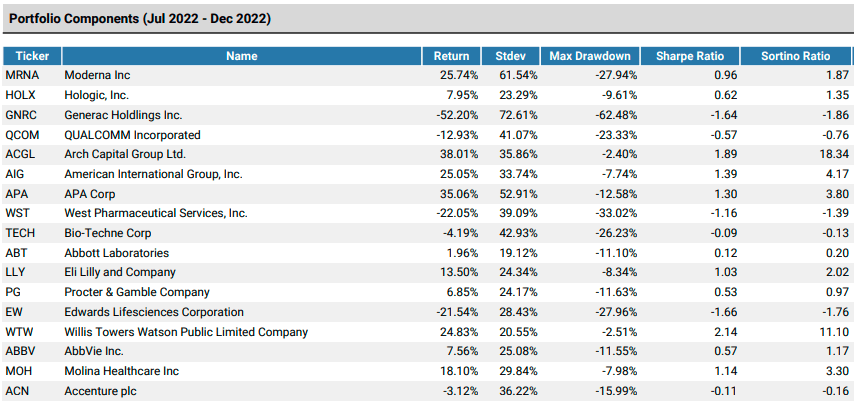
The average gain was 5.21% compared to a 2.57% decline for SPYG. In contrast, the 17 deletions gained 10.73%. Since the deletions performed better than the additions, this is evidence of some profit-taking.
Portfolio Visualizer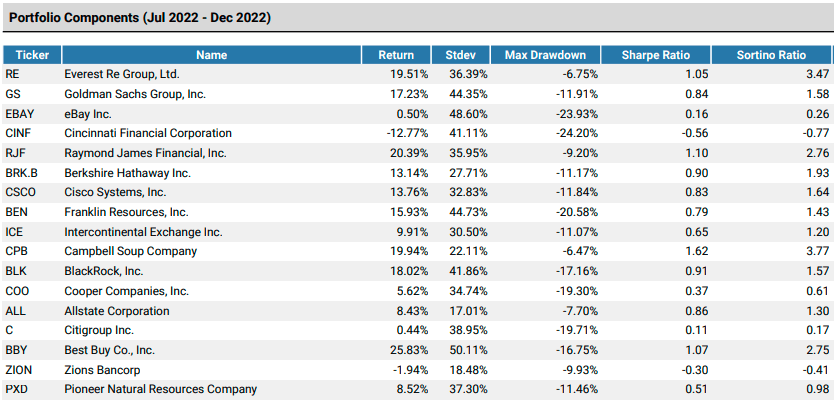
SPGP Fundamentals: Additions vs. Deletions
While profit-taking is usually thought of positively, it’s only sometimes prudent because the replacement stocks could be poor-quality ones, and that’s where I slightly lean. Most additions have poor outlooks, indicated by the 3.08/10 EPS Revision Score. Furthermore, only 17.79% of analysts have upgraded their next quarter’s earnings estimates for these additions. Estimated forward earnings valuations (19.46x) are cheap, but there are several Health Care names that I’m surprised qualified this time. They include Bio-Techne (TECH), Eli Lilly (LLY), and Procter & Gamble (PG). These companies either have elevated valuations, low estimated earnings growth, or both.
The Sunday Investor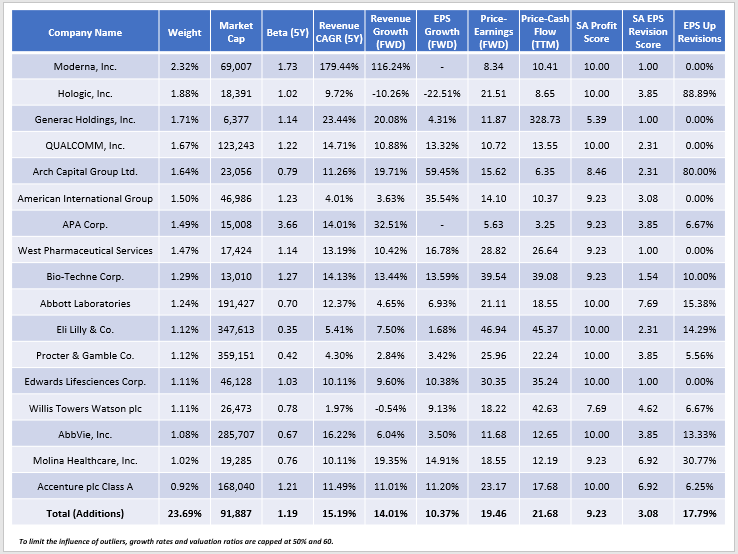
In contrast, analysts have a better outlook for the deleted stocks. The weighted-average EPS Revision score is 4.84/10, and 31.06% of analysts have upward revisions on the next quarter’s earnings.
The Sunday Investor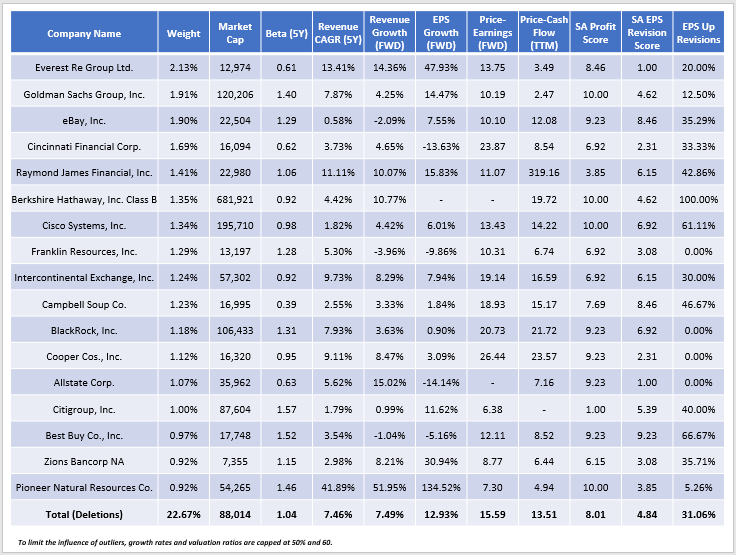
SPGP Fundamentals vs. SPY
The following table highlights selected fundamental metrics for SPGP’s top 25 industries, which total 86.96% of the portfolio. The weighted-average market capitalization is only $125 billion, far below $417 billion for SPY, and the historical 1.12 five-year beta is materially higher.
The Sunday Investor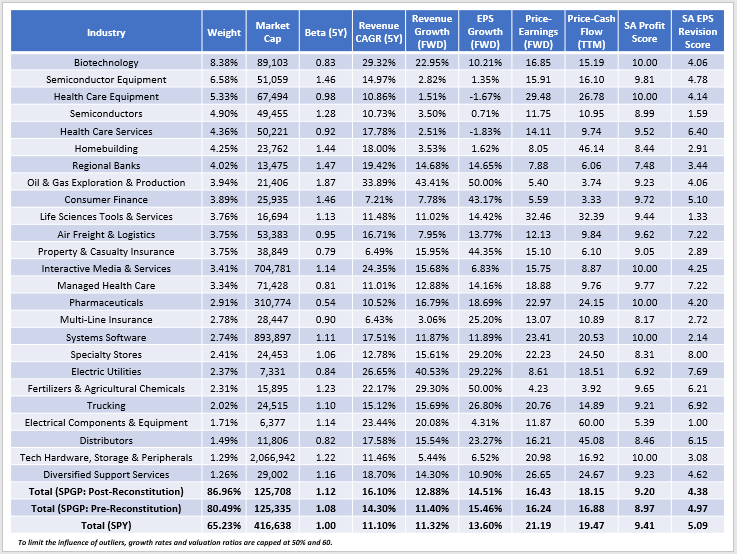
Historically, SPGP’s constituents have grown sales by 16.10% per year over the last five years, although that may not be saying much now that interest rates are much higher. Expected sales growth is 12.88%, slightly better than what SPY offers (11.32%). The Financials sector also drives better-expected earnings growth. These companies partially skew the results and make SPGP’s fundamentals look better than what’s realistic. The table above lists low earnings growth rates for Semiconductor and Health Care Equipment and Services stocks, which collectively total 21.17% of the portfolio. Most of these top industries have poor EPS Revision scores, too.
Where SPGP succeeds is its relatively low 16.43x forward earnings valuation, providing investors with a solid safety margin. That’s almost five points less than SPY but only a slight discount on trailing cash flow (18.15x vs. 19.47x). Notice how the previous portfolio traded at 16.88x trailing cash flow, possibly indicative of SPGP’s reliance on meeting these growth targets. A critical risk is if analysts continue to lower expectations, so investors need sentiment to turn around. According to Yardeni Research, the S&P 500 had four consecutive quarters of single-digit earnings surprises, which followed six quarters of double-digit earnings surprises. Only 17/75 of SPGP’s holdings (24.72% of the total weight) reported double-digit earnings surprises last quarter, so it’s doubtful SPGP will perform well without a solid turnaround in Q1 2023.
Investment Recommendation
SPGP’s latest reconstitution was eventful, swapping about 23% of the portfolio while taking minor profits in some well-performing stocks. The ETF is now 28% Health Care and 18% Financials, similar to how it was in the first half of 2022. Furthermore, SPGP trades at just 16.43x forward earnings with a 14.51% estimated earnings growth rate. While expected with a GARP strategy, these factors are nevertheless attractive, and the fund’s track record proves the strategy can work.
My biggest concern is SPGP’s poor 4.38/10 EPS Revision Score. Compared to 230 other large-cap ETFs, it’s the lowest. It’s remarkable how poorly Wall Street analysts view SPGP’s constituents, and a position in SPGP represents a strong contrarian view. That’s not what I suggest, especially for an ETF that is known for substantial changes each reconstitution. Therefore, I recommend investors avoid the SPGP in the near term and wait to see if the bearish sentiment turns around after the next earnings season.
Be the first to comment