

Poike/iStock via Getty Images
Investment Thesis
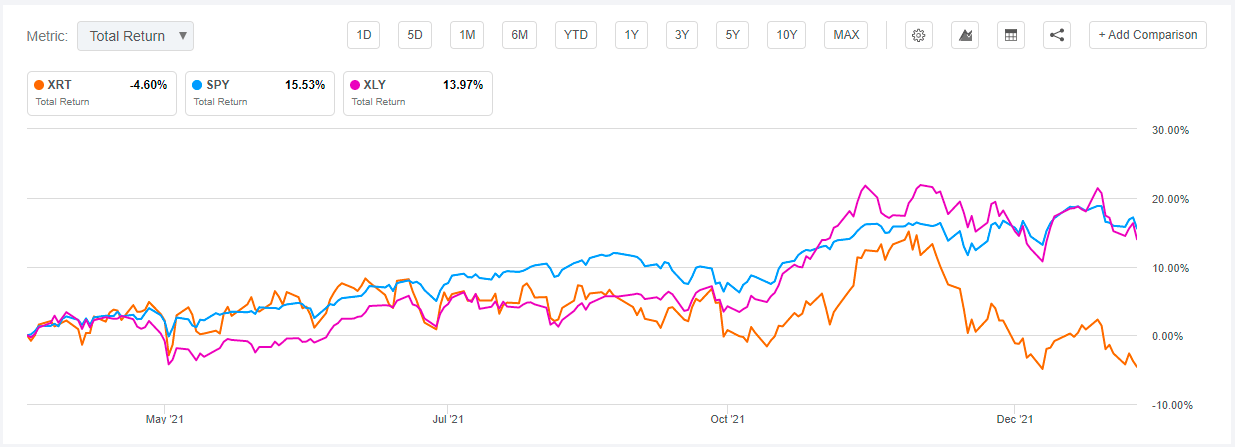
In April 2021, I recommended against owning the SPDR S&P Retail ETF (NYSEARCA:XRT), theorizing that U.S. retail stocks had prices far above their fair values, and thus, a short-term correction was in order. Since that article, XRT has underperformed the SPDR S&P 500 Index ETF (NYSEARCA:SPY) and the SPDR Consumer Discretionary Select ETF (NYSEARCA:XLY) by about 18% to 20%.
Now that the correction is in and market participants are beginning to take fundamentals more seriously, I wanted to update my analysis to see if today’s price represents a better buying opportunity. To find out, I’ll be going over XRT’s 109 constituents in detail, looking at their historical growth rates, price-earnings ratios, and analyst expectations, all in the context of how attractive retail stocks are now that we are hopefully nearing the end of the pandemic. My assessment is that while retail stocks are much more reasonably valued today, XRT includes too many poorly-profitable and arguably, speculative stocks that can have a significant drag on returns. Therefore, it’s wise to wait for a more positive trend on retail sales before taking a position.
ETF Overview
XRT tracks the S&P Retail Select Industry Index, which currently includes 109 securities, 88% in Consumer Discretionary and 12% in Consumer Staples. The Index uses a modified equal-weighting scheme and is rebalanced quarterly at the end of March, June, September, and December. This method may be advantageous for those concerned about the high price-earnings ratios of mega-cap stocks like Amazon (NASDAQ:AMZN). Amazon’s current weighting of 1.01% is only slightly higher than the Index’s smallest company by market capitalization, Shift Technologies (NASDAQ:SFT).
The Index is considered a primary sub-industry Index, with eligibility requirements as follows:
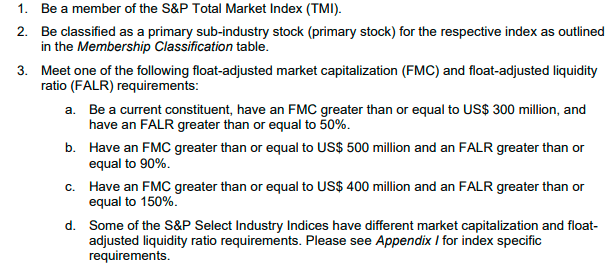
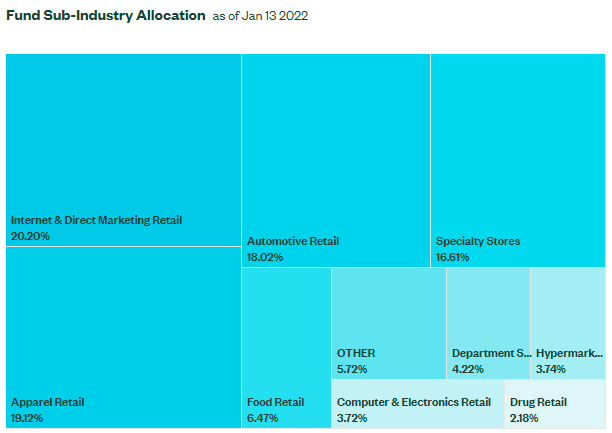
As of January 13, 2022, XRT is mainly comprised of stocks in the Internet & Direct Marketing Retail (20.20%), Apparel Retail (19.12%), Automotive Retail (18.02%), and Specialty Stores (16.61%) industries. Included in these industries are stocks like eBay (NASDAQ:EBAY), TJX (NYSE:TJX), O’Reilly Automotive (NASDAQ:ORLY), and Tractor Supply (NASDAQ:TSCO).
For the ETF’s top ten holdings, the list is shown below. Keep in mind that this won’t be very revealing because of the Index’s modified equal-weight methodology.

Finally, I’ve summarized some of XRT’s key descriptive statistics below.
- Current Price: $83.68
- Assets Under Management: $927 million
- Expense Ratio: 0.35%
- Launch Date: June 19, 2006
- Trailing Dividend Yield: 1.64%
- Five-Year Dividend CAGR: 18.43%
- Ten-Year Dividend CAGR: 18.84%
- Five-Year Beta: 1.01
- Number of Securities: 109
- Portfolio Turnover: 62%
- Assets in Top Ten: 11.48%
- 30-Day Median Bid-Ask Spread: 0.01%
- Tracked Index: S&P Retail Select Industry Index
As shown, XRT is not a popular fund since it doesn’t even manage $1 billion in assets yet, but it is an efficient one. Its median bid-ask spread is just 0.01%, indicating its highly liquid holdings. When assessing an ETF’s liquidity, the volume of the underlying holdings matters more than the volume of the ETF.
The 0.35% fees are standard for SPDR Industry ETFs, and the dividend growth rates are terrific. However, what caught my eye was XRT’s five-year beta of 1.01. As I will demonstrate, this is not true today. XRT’s holdings are highly volatile, and the weighted-average beta right now is 1.49.
XRT Performance
Since July 2006, XRT has returned an annualized 11.60%, 2.03% behind XLY but 0.77% better than SPY. I think betting on the U.S. consumer is a solid strategy in the long run, but the difficulty will always be getting the timing right. It’s much more volatile than the broader Consumer Discretionary sector, which means investors need to watch trends and valuations closely to avoid overpaying.
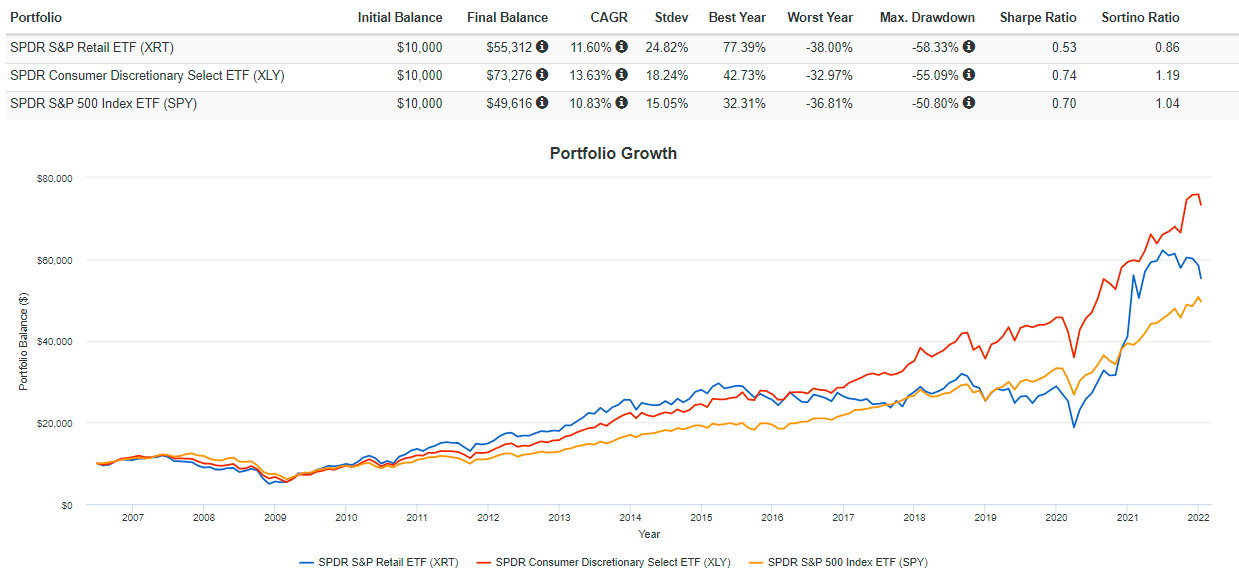
The graph above highlights this above-average volatility. XRT’s annualized standard deviation was 24.82% compared with 18.24% for XLY and 15.05% for SPY. However, huge returns are possible. For example, XRT’s best year came in 2009 when it gained 77.39%, 36.82% better than XLY. It also outperformed by about 12% and 15% in 2020 and 2021, respectively. In my view, the trick is to get in when valuations are low, but enthusiasm is on an uptrend. That’s what I hope to assess for readers in the following analysis of XRT’s fundamentals.
XRT Fundamentals
Operating Margin Trends: U.S. Retail
First, I want to provide median operating margin trends over the last five years for XRT’s current constituents. Operating margins, together with sales, helps determine profitability and is a metric that can vary significantly with U.S. retail stocks.

I’m pleased to see the increase in operating margins over the last year. With about half of companies reporting earnings sometime in Q4 2021, margins are as good as they’ve been in the previous five years. As I suggested in April, strong margins should support high returns and high valuations; otherwise, most valuation is based on speculation. I was uncomfortable buying into that during such an uncertain time with the pandemic. However, I see strength forming on margins again, so let’s look at XRT’s fundamentals next to assess its valuation and composition across industries.
Snapshot By Industry: U.S. Retail
I have created a table to highlight XRT’s fundamental metrics by industry, with comparisons to XLY in the last row. With XRT’s price declining since my previous article, I’m not surprised to see the forward price-earnings ratio at a low level. However, it’s worth looking further into, as there are some problem areas I want to discuss.
Created By Author Using Data From Seeking Alpha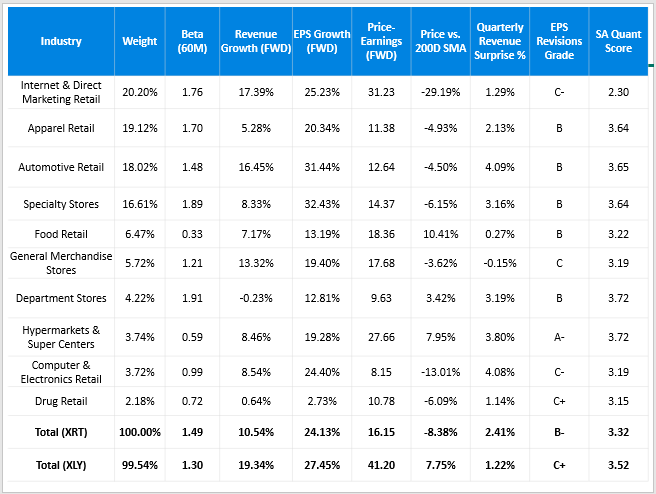
First, I want to reiterate how much different XRT’s current constituents’ five-year beta is compared to what the ETF has experienced over the last five years. Currently, the ETF is overweight stocks in the Internet & Direct Marketing Retail industry, which has been incredibly volatile lately. Indeed, in pandemic days, predicting where stocks in this industry will go is very challenging, and it’s reflected in the 1.76 beta figure.
Second, XRT’s weighted-average forward revenue and earnings growth rates of 10.54% and 24.13% are strong. Though not as strong as the broader Consumer Discretionary sector, the 16.15x forward earnings valuation helps. Retail stocks also beat analysts’ revenue expectations last quarter by 2.41% compared to 1.22% for XLY, and analysts are more optimistic about future earnings, as evidenced by Seeking Alpha’s stronger EPS Revisions Grade. Given these figures, I’m confident in the future of the U.S. Retail industry.
XRT’s Problem: Too Many Weak Companies
We must remember that XRT holds the entire U.S. retail industry in equal weight. Unfortunately, this means the inclusion of many weak companies. You may have noticed the Seeking Alpha Quant Grade of just 2.30 for the Internet & Direct Marketing Retail industry. It’s also the most richly-valued industry in XRT, even after trading 29.19% below its 200-day moving average price. It’s an area of concern for me, so let’s take a closer look.
Created By Author Using Data From Seeking Alpha
As shown, there are ten stocks with Quant Scores around two or less, which means Seeking Alpha has rated them Bearish or Very Bearish. Many, like Stitch Fix (NASDAQ:SFIX), RealReal (NASDAQ:REAL), and Overstock.com (NASDAQ:OSTK), are considered small-cap growth stocks and are trading near their 52-week lows (as indicated by the Annual Price Position column). In total, 13.56% of the weight in XRT have a Bearish or worse Quant Rating. In XLY, that figure is only 0.57%, and in SPY, it’s only 0.33%. So, I want investors to realize the additional risk XRT presents. Even if the U.S. Retail Industry recovers, as I expect it eventually will, there’s a solid chance these weak stocks will weigh down XRT.
Economic Data
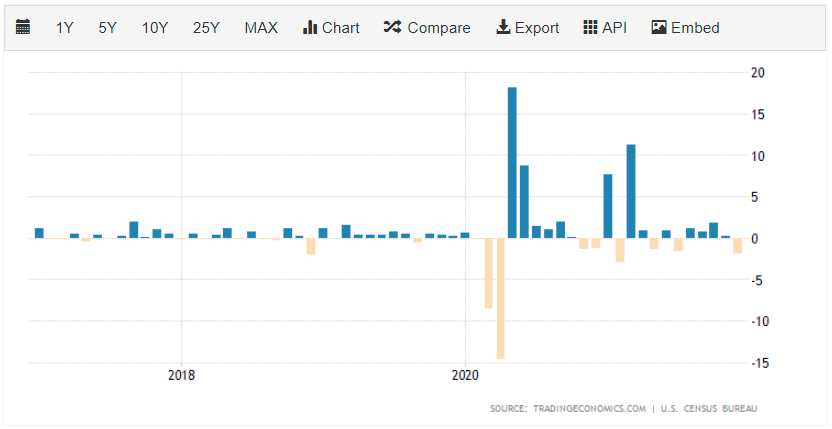
The U.S. Census Bureau just announced lower-than-expected retail sales for December 2021. The Advance Monthly Retail Trade number was $626.8 billion, or 1.9% lower than last month when economists expected no change. Auto sales managed a meager 0.3% gain, but online retailers saw an 8.7% decrease since, presumably, shoppers were ahead of the game amid global supply chain disruptions. Home furnishing sales dropped 5.5%, and even restaurant and bar sales slipped 0.8%.
I believe that retail sales figures going forward will likely be upward trending, but it’s just a very choppy trade right now. The graph below highlights the last five years’ worth of retail sales figures. You can see that ever since the pandemic began, it’s been bouncing up and down, and until we get a firm handle on it, the choppiness will continue.
Investment Recommendation and Conclusion
XRT is very tempting right now. It’s trading at an attractive 16.15x forward earnings and has seen its price fall sharply from its 52-week high price of $104.41 down to $83.68. Operating margins are increasing despite disappointing sales figures, and it seems like there is light at the end of the tunnel as restrictions fade, even in the face of Omicron. I think many U.S. retail stocks have a bright future.
My issue with XRT has to do with how many small-cap growth companies it includes and the roughly equal weights assigned to them. From a risk-reward perspective, there isn’t much to gain from diversifying into companies with poor profitability metrics. In addition, many aren’t even trading at a discount. For example, the Internet & Direct Marketing Retail industry has the highest price-earnings ratio at 31.23. XRT has over 20% allocated to this industry, which, arguably, is the most at risk today.
To conclude, while we’re closer to XRT being a buying opportunity than when I last covered the ETF, we’re not there yet. Too much uncertainty remains, and I think the better play is to tilt your portfolio more in favor of value right now. Therefore, I’m neutral today, but look forward to providing another update in a few months.
Be the first to comment